Joseph SchwSDWIA Bridgearz, CFA 612.355.4365

Stephen Dygos, CFP® 612.355.4364

Benjamin Wheeler, CFP® 612.355.4363

Paul Wilson 612.355.4366

www.sdwia.com

Market Update
(all values as of 04.30.2024)

Stock Indices:

Dow Jones 37,815
S&P 500 5,035
Nasdaq 15,657

Bond Sector Yields:

2 Yr Treasury 5.04%
10 Yr Treasury 4.69%
10 Yr Municipal 2.80%
High Yield 7.99%

YTD Market Returns:

Dow Jones 0.34%
S&P 500 5.57%
Nasdaq 4.31%
MSCI-EAFE 1.98%
MSCI-Europe 2.05%
MSCI-Pacific 1.82%
MSCI-Emg Mkt 2.17%
 
US Agg Bond 0.50%
US Corp Bond 0.56%
US Gov’t Bond 0.48%

Commodity Prices:

Gold 2,297
Silver 26.58
Oil (WTI) 81.13

Currencies:

Dollar / Euro 1.07
Dollar / Pound 1.25
Yen / Dollar 156.66
Canadian /Dollar 0.79
 

Macro Overview

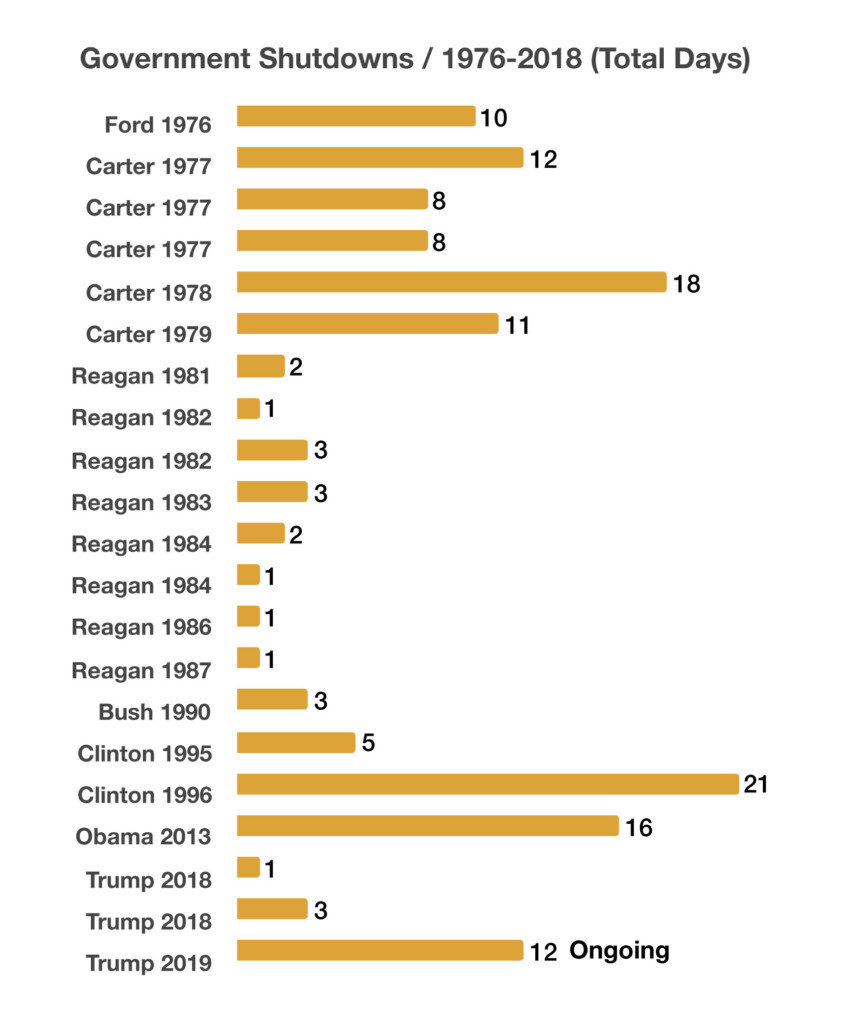
Weariness among investors escalated towards the end of 2018 as uncertainty surrounding trade, the Federal Reserve, a government shutdown, and global economic growth lingered into the new year.

Even during the turbulent year of 2018, the U.S. economy continues its resilience into 2019, with unemployment at its lowest level in 49 years, wage growth reaching levels not seen since 2009 and consumer spending and industrial production remaining strong. A tight labor market along with moderate inflation has maintained an accommodating environment for consumers.

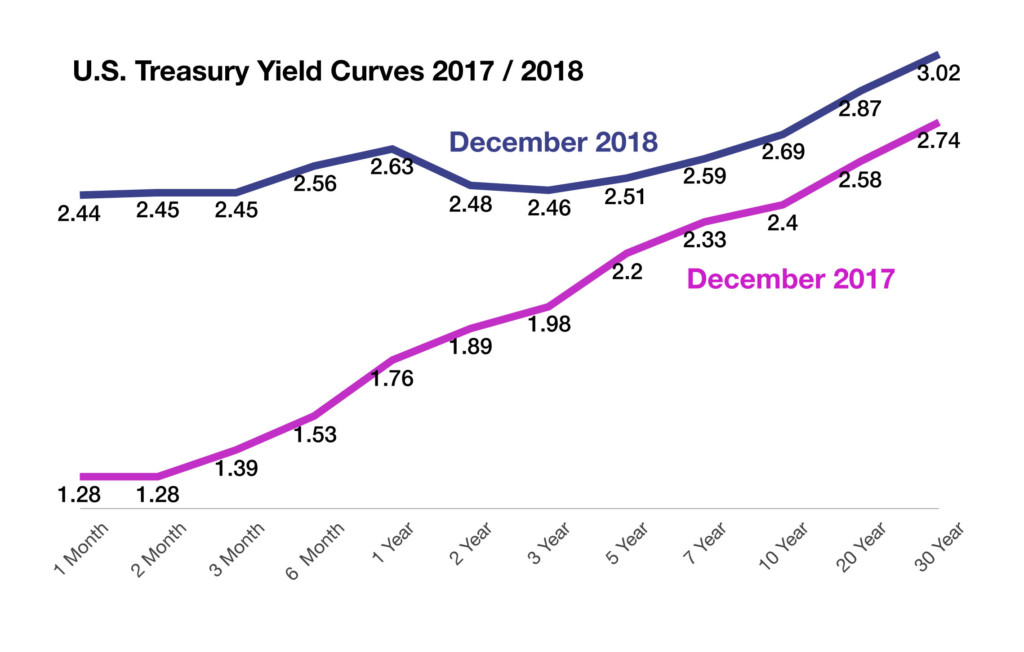
The year-end climate heading into 2019 became more challenging as equity markets reacted negatively to another rate hike in December along with two more expected hikes in 2019. Ironically, the market views the Fed hikes as a validation by the Fed that U.S. economic activity is healthy enough to endure further rate increases.

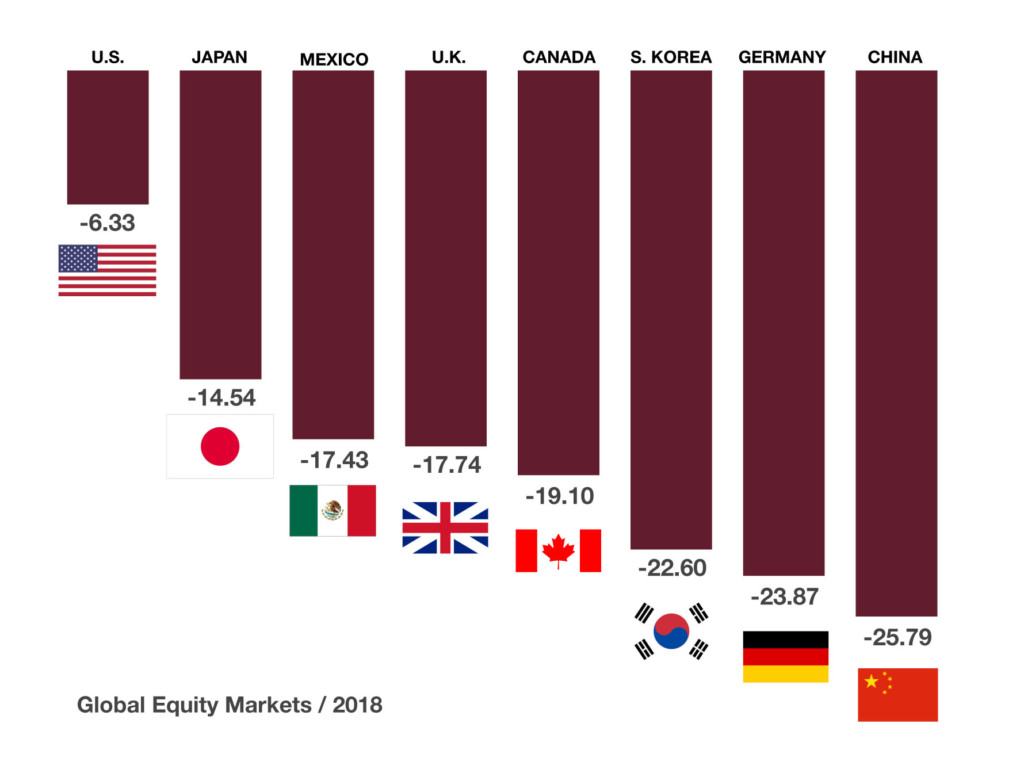
Global equity markets ended 2018 in negative territory with nearly every major index in both developed and emerging markets falling. China’s stock market was among the worst performer internationally as trade tensions took a toll on Chinese manufacturers and exporters. U.S. stock markets experienced volatility that had not occurred in several years resulting in a pullback for all major domestic equity indices in 2018.

Ongoing trade disputes and the imposition of new tariffs negatively influenced the markets and economic projections throughout year. Relations with China were forefront as the administration negotiated trade terms intended to better protect U.S. intellectual property and disparate tariffs.

Growing U.S. oil production and an increase in supplies led to a drop of U.S. oil prices by 25% in 2018. The benchmark for U.S. oil, West Texas Intermediate (WTI), fell from $60 per barrel in the beginning of the year to $45 per barrel by year-end, simultaneously reducing the price of gasoline nationwide.

According to the Federal Reserve Bank of New York, the likelihood of a recession remains relatively low with less than a 15% probability one will occur in the next year. The Fed has historically seen greater than 30% probabilities before each of the last seven recessions since 1970.

Sources: Federal Reserve Bank of New York, Treasury, Labor Dept., Bloomberg


Short Term Bond Rates Rise – Fixed Income Review

Shorter term bond yields rose closer to longer term bond yields, thus further flattening the Treasury bond yield curve, an economic gauge closely followed by market analysts. The benchmark 10-year Treasury Bond ended the year at 2.69%, down from a mid-year high of 3.24% it reached in November.

The Fed indicated that it would continue to shrink its balance sheet by $50 billion a month, a reversal from balance sheet expansion following the 2008-2009 financial crisis. What this means is that rather than buying government bonds in the marketplace and placing them on the Fed balance sheet, the Fed will instead forego holding additional bonds and allow bonds to mature without replacing them. This is a form of quantitative tightening as is raising short-term rates.

Over the past year, nearly every developed country central bank began reversing monetary stimulus and started tightening just as the Federal Reserve has. The anticipation of rising rates and less accommodative policy may be prohibitive for smaller emerging market economies in need of inexpensive capital.

The Fed raised rates four times in 2018 and has risen rates nine times since it began tightening rates from near-zero three years ago. The Fed signaled that it expects to raise rates at least twice in 2019. Some analysts believe that the Fed has raised rates in order to be able to lower them as a form of stimulus should economic conditions deteriorate.

Sources: Treasury Dept., Federal Reserve


Global Equity Markets Decline – Equity Review

Volatility throughout the trading year kept stock valuations tough to determine. A popular process that analysts use to value stocks is based on Price Earnings (PE) ratios, calculated by dividing the current market price of a stock by its earnings per share. PE ratios for stocks began the year above 20 for all three major equity indices and finished the year near 15. The lower the PE the less expensive stocks are relative to their earnings so a drop in PEs has made stocks more appealing to value seeking investors.

Billions of dollars in pension funds are among the culprits responsible for the dramatic upswings in the equity markets towards the end of December. Pensions allocate to equities for long-term holds rather than short-term trades, boosting the overall stability of the markets.

Global equity markets experienced widespread negative returns for 2018 with both developed and emerging market indices falling. Domestic equities faired better than international stocks for the year as earnings optimism and a strong dollar helped stabilized U.S. markets.

An increase in the use of options as a hedge against market volatility increased to roughly 20 million option contracts a day being traded, surpassing previous records according to data compiled by Options Clearing Corporation. Creative option strategies have evolved as increased stock volume accompanied by consistent volatility has become the norm. Computer as well as human initiated trades have also leant to staggering trading days resulting in wild market swings as traders cover open option contracts.

Sources: Options Clearing Corp., Bloomberg, Federal Reserve; https://fred.stlouisfed.org/series


Tax Rule Changes For 2019 – Tax Planning

Various changes are effective for the 2019 tax year beginning January 1, 2019. The changes affect most every tax payer both as an employee and self employed business owners.

A provision in the tax code known as indexing will affect 2019 Tax Brackets & Rates, which is essentially an inflation adjusted modification to account for rising inflation trends. For 2019, income brackets increased by roughly 2% across all income levels.
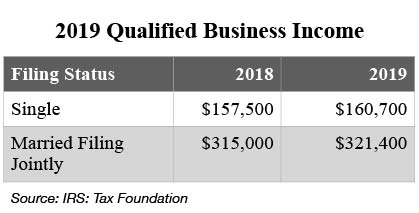
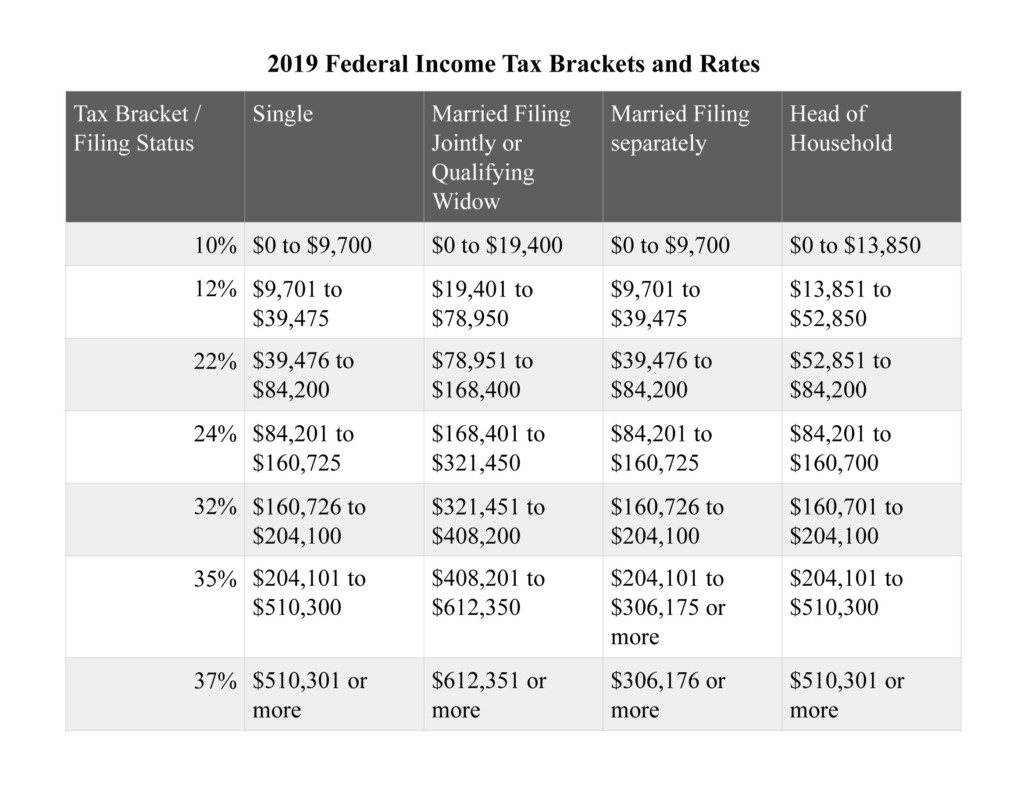
Income brackets for capital gains have also increased slightly for 2019.


With personal exemptions eliminated under the new tax law, a larger single standard deduction was devised in order to streamline returns for taxpayers. Standard deduction amounts increased slightly for 2019.
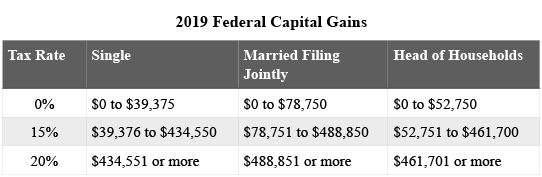
For both employees and self-employed individuals, IRA and Qualified Plan contributions have increased as well for 2019.
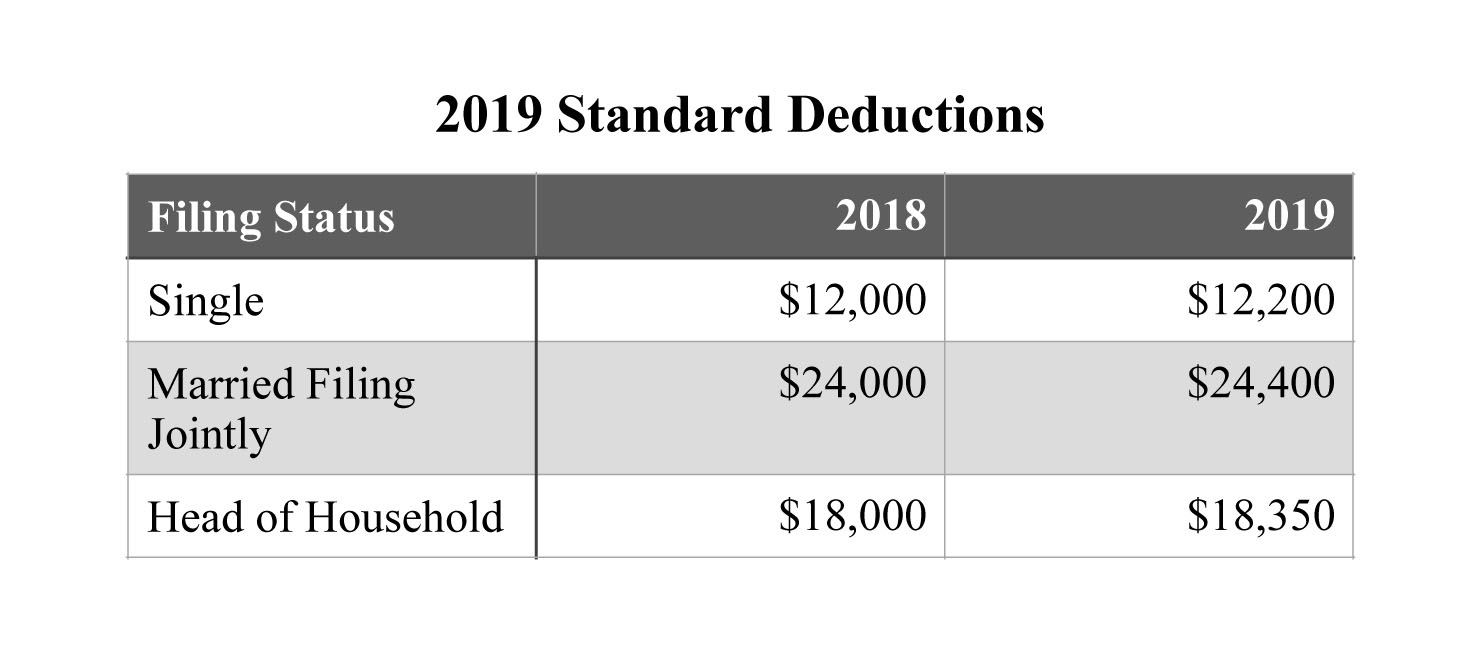
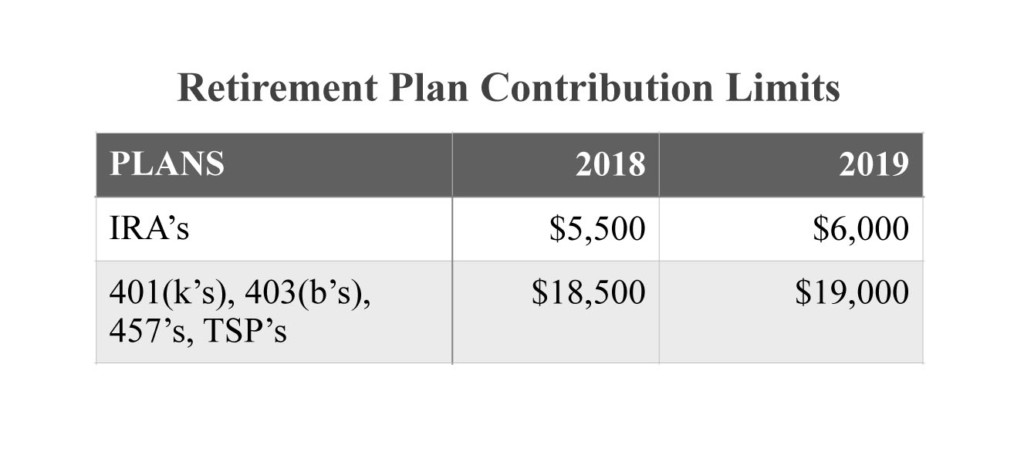
Other significant changes occurring for 2019 include:

-Estate Tax Exemption increases from $11.18 million to $11.40 million in 2019. -Elimination of the ACA penalty for not having health insurance becomes effective -Unreimbursed medical expenses must exceed 10% of AGI in order to deduct -Alimony is no longer deductible for the payor and no longer taxable for the recipient for divorce decrees issued after December 31, 2018.

Sources: https://taxfoundation.org, IRS.gov


Credit Score Calculations Will Change In 2019 – Financial Planning

In response to pressure from regulators and the banking industry, credit reporting firms will offer modified credit scores starting in 2019. The modifications include the calculation of utility and cellphone bills that millions of Americans pay every month.

Banks have argued that a large group of consumers nationwide just don’t have sufficient credit history to generate a viable credit score for a bank loan. However, the inclusion of utility and cellphone payments will help identify credit worthy consumers for bank loans.

The challenge lies with consumers that hold little if any loan balances, thus not generating a track record of payments. The modification is expected to increase loan issuance by banks as millions of consumers become qualified for loans. An overall drop in credit scores following the financial crisis of 2008-2009 made it difficult for consumers to obtain loans.

With over 270 million cell phone users in the country, many are expected to benefit from so-called non-loan bill payments as their credit scores may positively be affected.

Sources: Fair Issac Corp., Office of the Comptroller of the Currency, Treasury Dept.

The Common Occurrence Of Government Shutdowns – Fiscal Policy

Government shutdowns have been a common occurrence over the years under most every president. The length of the shutdowns have varied from 2 days in 1981 under President Reagan to 21 days in 1996 under President Clinton. A shutdown occurs when Congress fails to pass or the President refuses to sign legislation funding federal government operations and agencies.

Estimated costs of the most recent government shutdown are still unknown, with lost wages, exports, and government services essential to the operation of private sector businesses being affected. How much the shutdown may have weighed on the economy may not be known until later in the year.

Government shutdowns entail partial closure of certain agencies and departments, not complete closures. Departments affected during the most recent shut down include Homeland Security, Housing & Urban Development, Commerce, FCC, Coast Guard, FEMA, Interior, Transportation, and the Executive Office of the President.

Federal employees deemed as “essential” among the various departments are required to work without pay until a funding bill is passed by Congress. The closures affect numerous private businesses that rely and adhere to regulatory rules imposed by the Federal government, such as mortgage loans and Housing & Urban Development.

Sources: Congressional Records, https://www.congress.gov/congressional-record/2018/12/22