Ocean Park Capital Management

2503 Main Street

Santa Monica, CA 90405

Main: 310.392.7300

Daily Performance Line:  310.281.8577

December 2019
Market Update
(all values as of 09.30.2024)

Stock Indices:

Dow Jones 42,330
S&P 500 5,762
Nasdaq 18,189

Bond Sector Yields:

2 Yr Treasury 3.66%
10 Yr Treasury 3.81%
10 Yr Municipal 2.63%
High Yield 6.66%

YTD Market Returns:

Dow Jones 12.31%
S&P 500 20.81%
Nasdaq 21.17%
MSCI-EAFE 12.90%
MSCI-Europe 12.10%
MSCI-Pacific 13.80%
MSCI-Emg Mkt 16.80%
 
US Agg Bond 4.44%
US Corp Bond 5.32%
US Gov’t Bond 4.39%

Commodity Prices:

Gold 2,657
Silver 31.48
Oil (WTI) 68.27

Currencies:

Dollar / Euro 1.11
Dollar / Pound 1.33
Yen / Dollar 142.21
Canadian /Dollar 0.73
 

Fund Overview

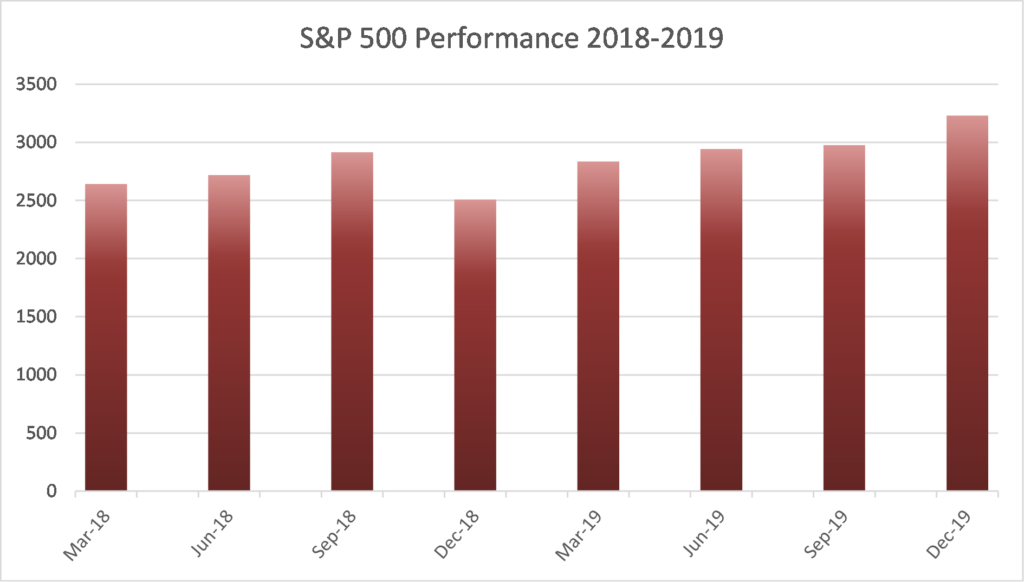
Equities produced outstanding results in 2019, as did the Ocean Park funds.* Technology stocks were particularly strong, followed by consumer discretionary and service stocks.  Within those sectors, semiconductors generated our largest gains—particularly Advanced Micro Devices, which was our best performer.  The FAANG companies except for Netflix also posted outsized gains.  While we lagged the major indices, we outperformed the HFRI Equity Hedge Total Index, which was up 13.74% for the year.

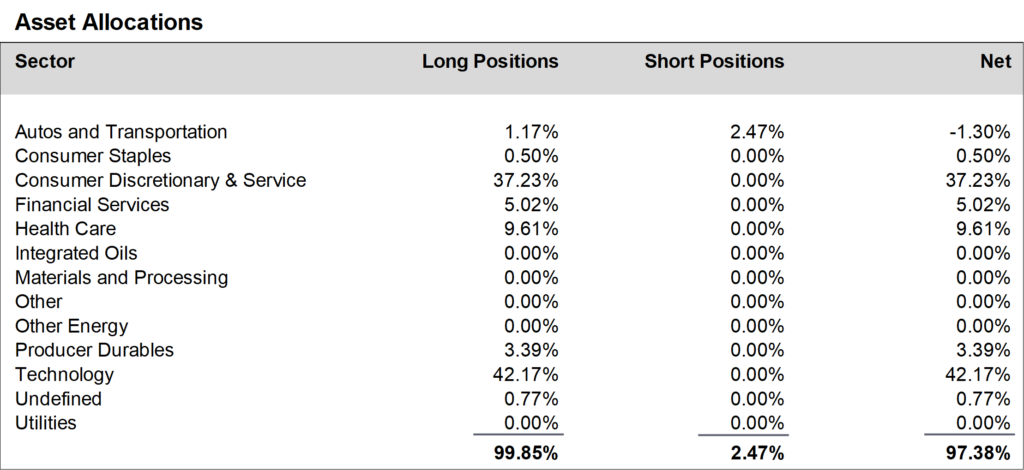
During December, we significantly reduced our position in the QQQ ETF and replaced it with positions in the consumer discretionary and service and the technology sectors.  We also reduced positions in the consumer staples and the autos and transportation sectors.  We ended the month at about 98% net long, unchanged from November.

We once again thank you for your investment in the Fund, as we strive to build upon our long-term performance and earn your continued confidence.

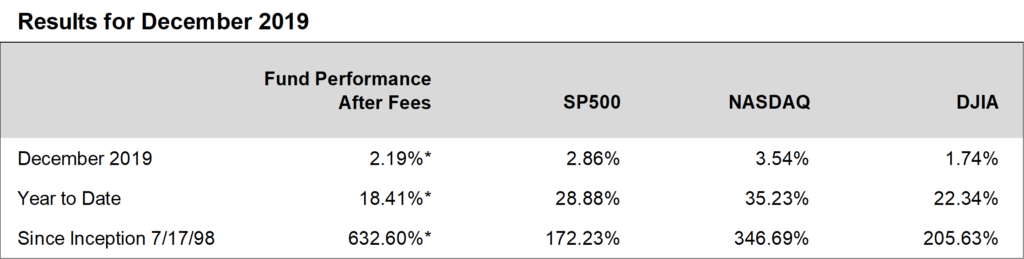
*Our “pro forma” results, reported below, reflect a deduction for performance fees which is only charged when the fund is above its high water mark. As this was not the case in 2019, actual results for our investors were close to 23%.

Daily updates on our activity are available on our Results Line, at 310-281-8577, and current information is also maintained on our website at www.oceanparkcapital.com. To gain access to the site enter password opcap. Past performance does not guarantee future results.

 
Equity Overview - December 2019

Equity Overview

Stocks had a remarkable year in 2019, rebounding from a disappointing 2018.  All the major indices rose by more than 20%.  The S&P 500 posted its best performance since 2013 and its second best performance since 1999.

Many global markets also rose sharply, with European stocks up 23%, China up 22%, and Japan up 18%.

Notwithstanding the strong stock price gains, aggregate earnings for the S&P 500 did not keep pace, rising less than 1% in 2019.  The forward price/earnings ratio for the S&P 500 was 18.2x at year’s end, above the 5-year average of 16.7x and suggesting a market which may be overheated.  However, analyst consensus estimates project a 10% gain in corporate earnings in 2020 which, if accurate, would ease some of that concern.


Macro Overview - December 2019

Macro Overview

The markets climbed the proverbial “wall of worry” in 2019, rising dramatically in spite of a series of significant challenges.  The year started with widespread fear that a recession might be imminent, a fear that was reinforced at mid-year when the yield curve inverted (a usually reliable predictor of a coming recession).  However, the yield curve returned to normal and the economy continued to grow, albeit modestly.  In the end, there was no recession.  In fact there was no recession at any point in the 2010s, the first decade with no recession since record keeping began in the 1850s.

The trade war between the U.S. and China also posed serious headwinds, as both countries imposed tariffs and counter tariffs on hundreds of billions of dollars of imports.  Numerous sectors of the economy were affected, with agriculture sustaining the greatest impact.  But by year’s end the parties reached a so-called Phase 1 agreement which provided psychological relief to the markets (although its actual significance is the subject of debate).

Other international events also threatened markets—including instability across the Middle East, confrontation with Iran, continued nuclearization in North Korea, Brexit in Great Britain—but none had a lasting impact on stock performance.

The impeachment of the president by the House of Representatives might have been a meaningful event in another era.  However, perhaps because conviction by the Republican-controlled Senate appears impossible, there has been no measurable market impact.

And two important factors helped markets retain momentum in 2019.

The first was the Federal Reserve, which had raised interest rates in 2018 but reversed direction and lowered rates three times in 2019 at key moments when it appeared that the economy might falter.

The second was the economy itself, which showed surprising resilience.  Manufacturing was generally weak and got weaker as the year progressed.  But job growth was steady and the unemployment rate dropped to a near 50-year low of 3.5%.  This contributed to heightened consumer confidence and to strong consumer spending, which represents about 65% of GDP.


Source:  Factset Research Systems

 
Additional Disclosures

Additional Disclosures

Performance data for OPI reflect the reinvestment of dividends and other earnings on the fund’s assets.  Performance data for the major indices reflect only changes in the value of those indices, and would be higher if dividends were included. However, the index data do not reflect fees that would be paid to index fund managers and transaction costs that would be incurred when their component stocks are bought or sold, while OPI’s data do reflect quarterly fees and expenses incurred by the fund.  The information provided is believed to be reliable, but its accuracy or completeness is not warranted. This material is not intended as an offer or solicitation for the purchase or sale of any stock, bond, mutual fund, or any other financial instrument. The views and strategies discussed herein may not be appropriate and/or suitable for all investors. This material is meant solely for informational purposes, and is not intended to suffice as any type of accounting, legal, tax, or estate planning advice. Any and all forecasts mentioned are for illustrative purposes only and should not be interpreted as investment recommendations.