Ocean Park Capital Management
2503 Main Street
Santa Monica, CA 90405
Main: 310.392.7300
Daily Performance Line: 310.281.8577
Dow Jones | 42,330 |
S&P 500 | 5,762 |
Nasdaq | 18,189 |
2 Yr Treasury | 3.66% |
10 Yr Treasury | 3.81% |
10 Yr Municipal | 2.63% |
High Yield | 6.66% |
Dow Jones | 12.31% |
S&P 500 | 20.81% |
Nasdaq | 21.17% |
MSCI-EAFE | 12.90% |
MSCI-Europe | 12.10% |
MSCI-Pacific | 13.80% |
MSCI-Emg Mkt | 16.80% |
US Agg Bond | 4.44% |
US Corp Bond | 5.32% |
US Gov’t Bond | 4.39% |
Gold | 2,657 |
Silver | 31.48 |
Oil (WTI) | 68.27 |
Dollar / Euro | 1.11 |
Dollar / Pound | 1.33 |
Yen / Dollar | 142.21 |
Canadian /Dollar | 0.73 |
Ocean Park Investors Fund gained 16.25%* in 2021, on the heels of a 31.38%* gain in 2020. The S&P 500 gained 26.89%, the NASDAQ Composite gained 21.39%, and the HFRI Equity Hedge Index gained 11.81%.
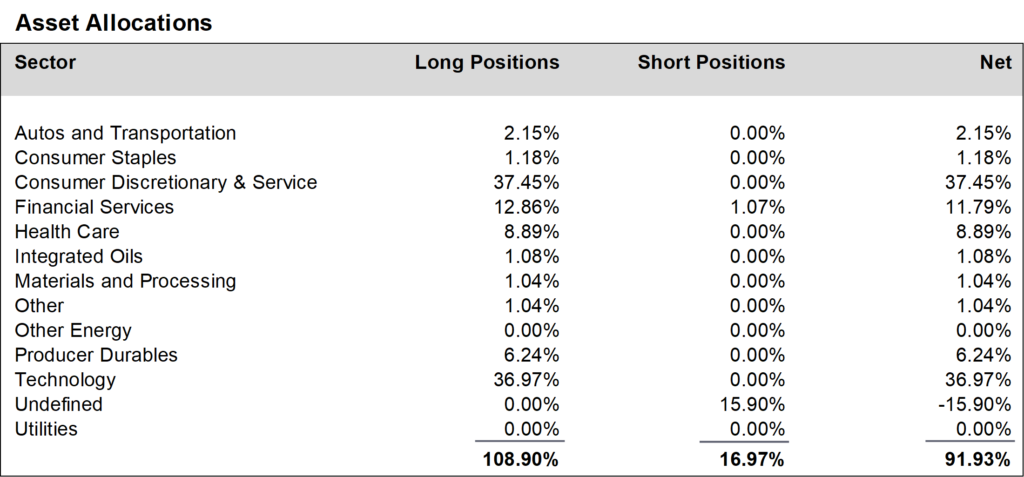
During December, we increased positions in the financial services sector and the health care sector, and reduced positions in the producer durables sector. We finished the month at about 92% net long, unchanged from November.
We once again thank you for your investment in the Fund, as we strive to build upon our long-term performance and earn your continued confidence.
Daily updates on our activity are available on our Results Line, at 310-281-8577, and current information is also maintained on our website at www.oceanparkcapital.com. To gain access to the site enter password opcap.
*These results are pro forma. Actual results for most investors will vary. See additional disclosures on page 4. Past performance does not guarantee future results.
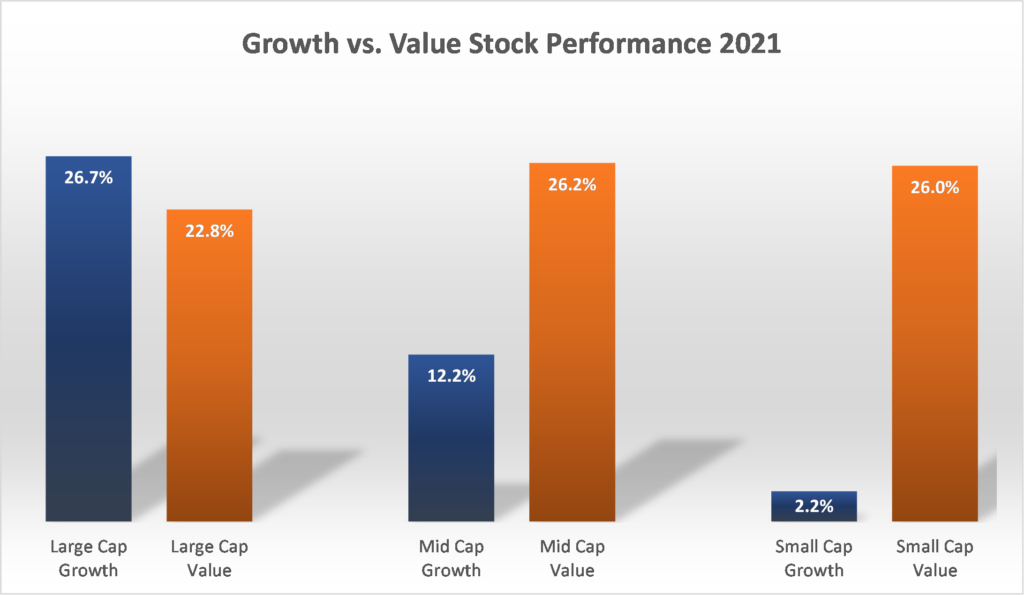
All sectors rose in December except consumer stocks, which were flat. Value stocks outperformed growth stocks at all capitalization levels. Markets were volatile, as the S&P 500 moved by 1% or more on 10 of 23 trading days.
For the full year 2021, an underlying theme in equities was a dramatic reversal in the performance of growth stocks versus value stocks. In 2020, growth stocks outperformed value stocks by 30% to 2%. But in 2021 mid-cap growth stocks gained only 12% while mid-cap value stocks gained 26%. And small-cap growth stocks gained a mere 2% while small-cap value stocks gained 26%.
2021 was a year of recovery. The U.S. economy enjoyed an impressive rebound as GDP grew at annualized rates of 6.4% in the first quarter, 6.7% in the second quarter, and 2.3% in the third quarter. Unemployment dropped from 6.3% in January to 4.2% in November. Initial jobless claims dropped to a 50-year low in December. Employers added jobs in every month, highlighted by a 1.1-million increase in July alone. Consumer spending rose throughout the year, particularly in the first half when it was boosted by government stimulus checks. Consumer confidence fluctuated but finished the year at 115.8, up from 87.1 in January.
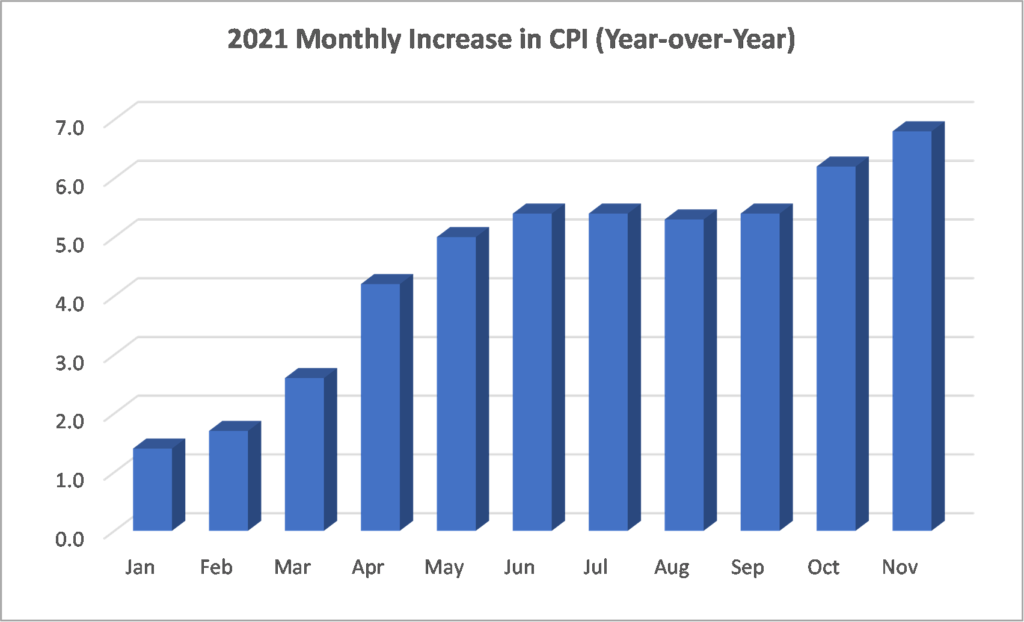
The unwelcome guest at the party was inflation. Increases in the Consumer Price Index gained steam throughout the year, culminating in November with a year-over year gain of 6.8%–the highest rate since 1982. For most of the year the Federal Reserve described this phenomenon as “transitory” and kept its supportive monetary policy intact, maintaining interest rates near zero and continuing its quantitative easing. But by November, the Fed acknowledged that inflation was a longer-term problem. It reversed course, and in December made clear that its accommodative policy was finished. Now it appears that quantitative easing will end by April and there will be at least three interest rate increases in 2022.
Less clear is the course of the COVID pandemic. Hopes that it might be subsiding were dashed with the arrival of the Omicron variant in November. The variant remains active throughout the U.S., but with uneven impact. Some areas have experienced an unprecedented volume of cases and hospitalizations, while other areas have seen declining numbers. Current projections, based in part on the timeline in other countries, look for Omicron to peak in late February or early March. Should that occur, perhaps we can look forward to a “Return to Normalcy” like the one a century ago, after the pandemic of 1918-20.
Performance data for OPI reflect the reinvestment of dividends and other earnings on the fund’s assets. Performance data for the major indices reflect only changes in the value of those indices, and would be higher if dividends were included. However, the index data do not reflect fees that would be paid to index fund managers and transaction costs that would be incurred when their component stocks are bought or sold, while OPI’s data do reflect quarterly fees and expenses incurred by the fund. The information provided is believed to be reliable, but its accuracy or completeness is not warranted. This material is not intended as an offer or solicitation for the purchase or sale of any stock, bond, mutual fund, or any other financial instrument. The views and strategies discussed herein may not be appropriate and/or suitable for all investors. This material is meant solely for informational purposes, and is not intended to suffice as any type of accounting, legal, tax, or estate planning advice. Any and all forecasts mentioned are for illustrative purposes only and should not be interpreted as investment recommendations.