W.P. "Bill" Atkinson, III

Certified Financial Planner TM / Attorney

Access Financial Resources, Inc.

3621 NW 63rd Street, Suite A1

Oklahoma City, OK  73116

(405) 848-9826

www.afradvice.com / bill@apaplans.com

January 2023
Market Update
(all values as of 04.30.2024)

Stock Indices:

Dow Jones 37,815
S&P 500 5,035
Nasdaq 15,657

Bond Sector Yields:

2 Yr Treasury 5.04%
10 Yr Treasury 4.69%
10 Yr Municipal 2.80%
High Yield 7.99%

YTD Market Returns:

Dow Jones 0.34%
S&P 500 5.57%
Nasdaq 4.31%
MSCI-EAFE 1.98%
MSCI-Europe 2.05%
MSCI-Pacific 1.82%
MSCI-Emg Mkt 2.17%
 
US Agg Bond 0.50%
US Corp Bond 0.56%
US Gov’t Bond 0.48%

Commodity Prices:

Gold 2,297
Silver 26.58
Oil (WTI) 81.13

Currencies:

Dollar / Euro 1.07
Dollar / Pound 1.25
Yen / Dollar 156.66
Canadian /Dollar 0.79
 

Macro Overview

Global equity and fixed-income markets navigated through a volatile environment as 2022 unfolded to be a challenging year. The Russian invasion of Ukraine, rising interest rates, inflationary pressures, and a slowing economy all weighed on financial markets. The S&P 500 closed the 2022 year at 3,839.50, down 19.4%. This makes 2022 the worst year for the S&P since 2008 and the fourth-worst year since the index’s launch 1957. (Source: Yahoo Finance)

2022 was the worst year on record for bonds – mainly because the Federal Reserve raising interest rates aggressively. The 30-year US Treasury bond, at its low, sunk to its worst return, -35%, in a century. The Bloomberg Barclays U.S. Aggregate Bond Index (which represents the U.S. investment-grade bond market) was down approximately -15%. (Source: CNBC, Glenmede)

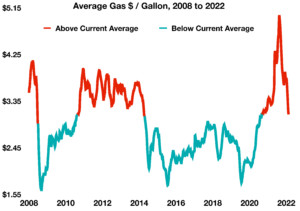
Inflation hindered both consumers and businesses in 2022, as rising prices for food and fuel shifted spending away from non-essential items. Higher labor costs along with elevated operating expenses reduced company margins and profit projections.

The labor market still has 11 million positions were open heading into 2023. Many companies that over-hired since the start of the pandemic began to reduce jobs and trim staff as economic headwinds have become more prominent.

Stubborn supply constraints experienced over the past two years have easied, resulting in better inventories and, in some instances, lower prices. Some economists and analysts expect a gradual slowing in inflationary pressures, leading to lower prices and easing consumer worries.

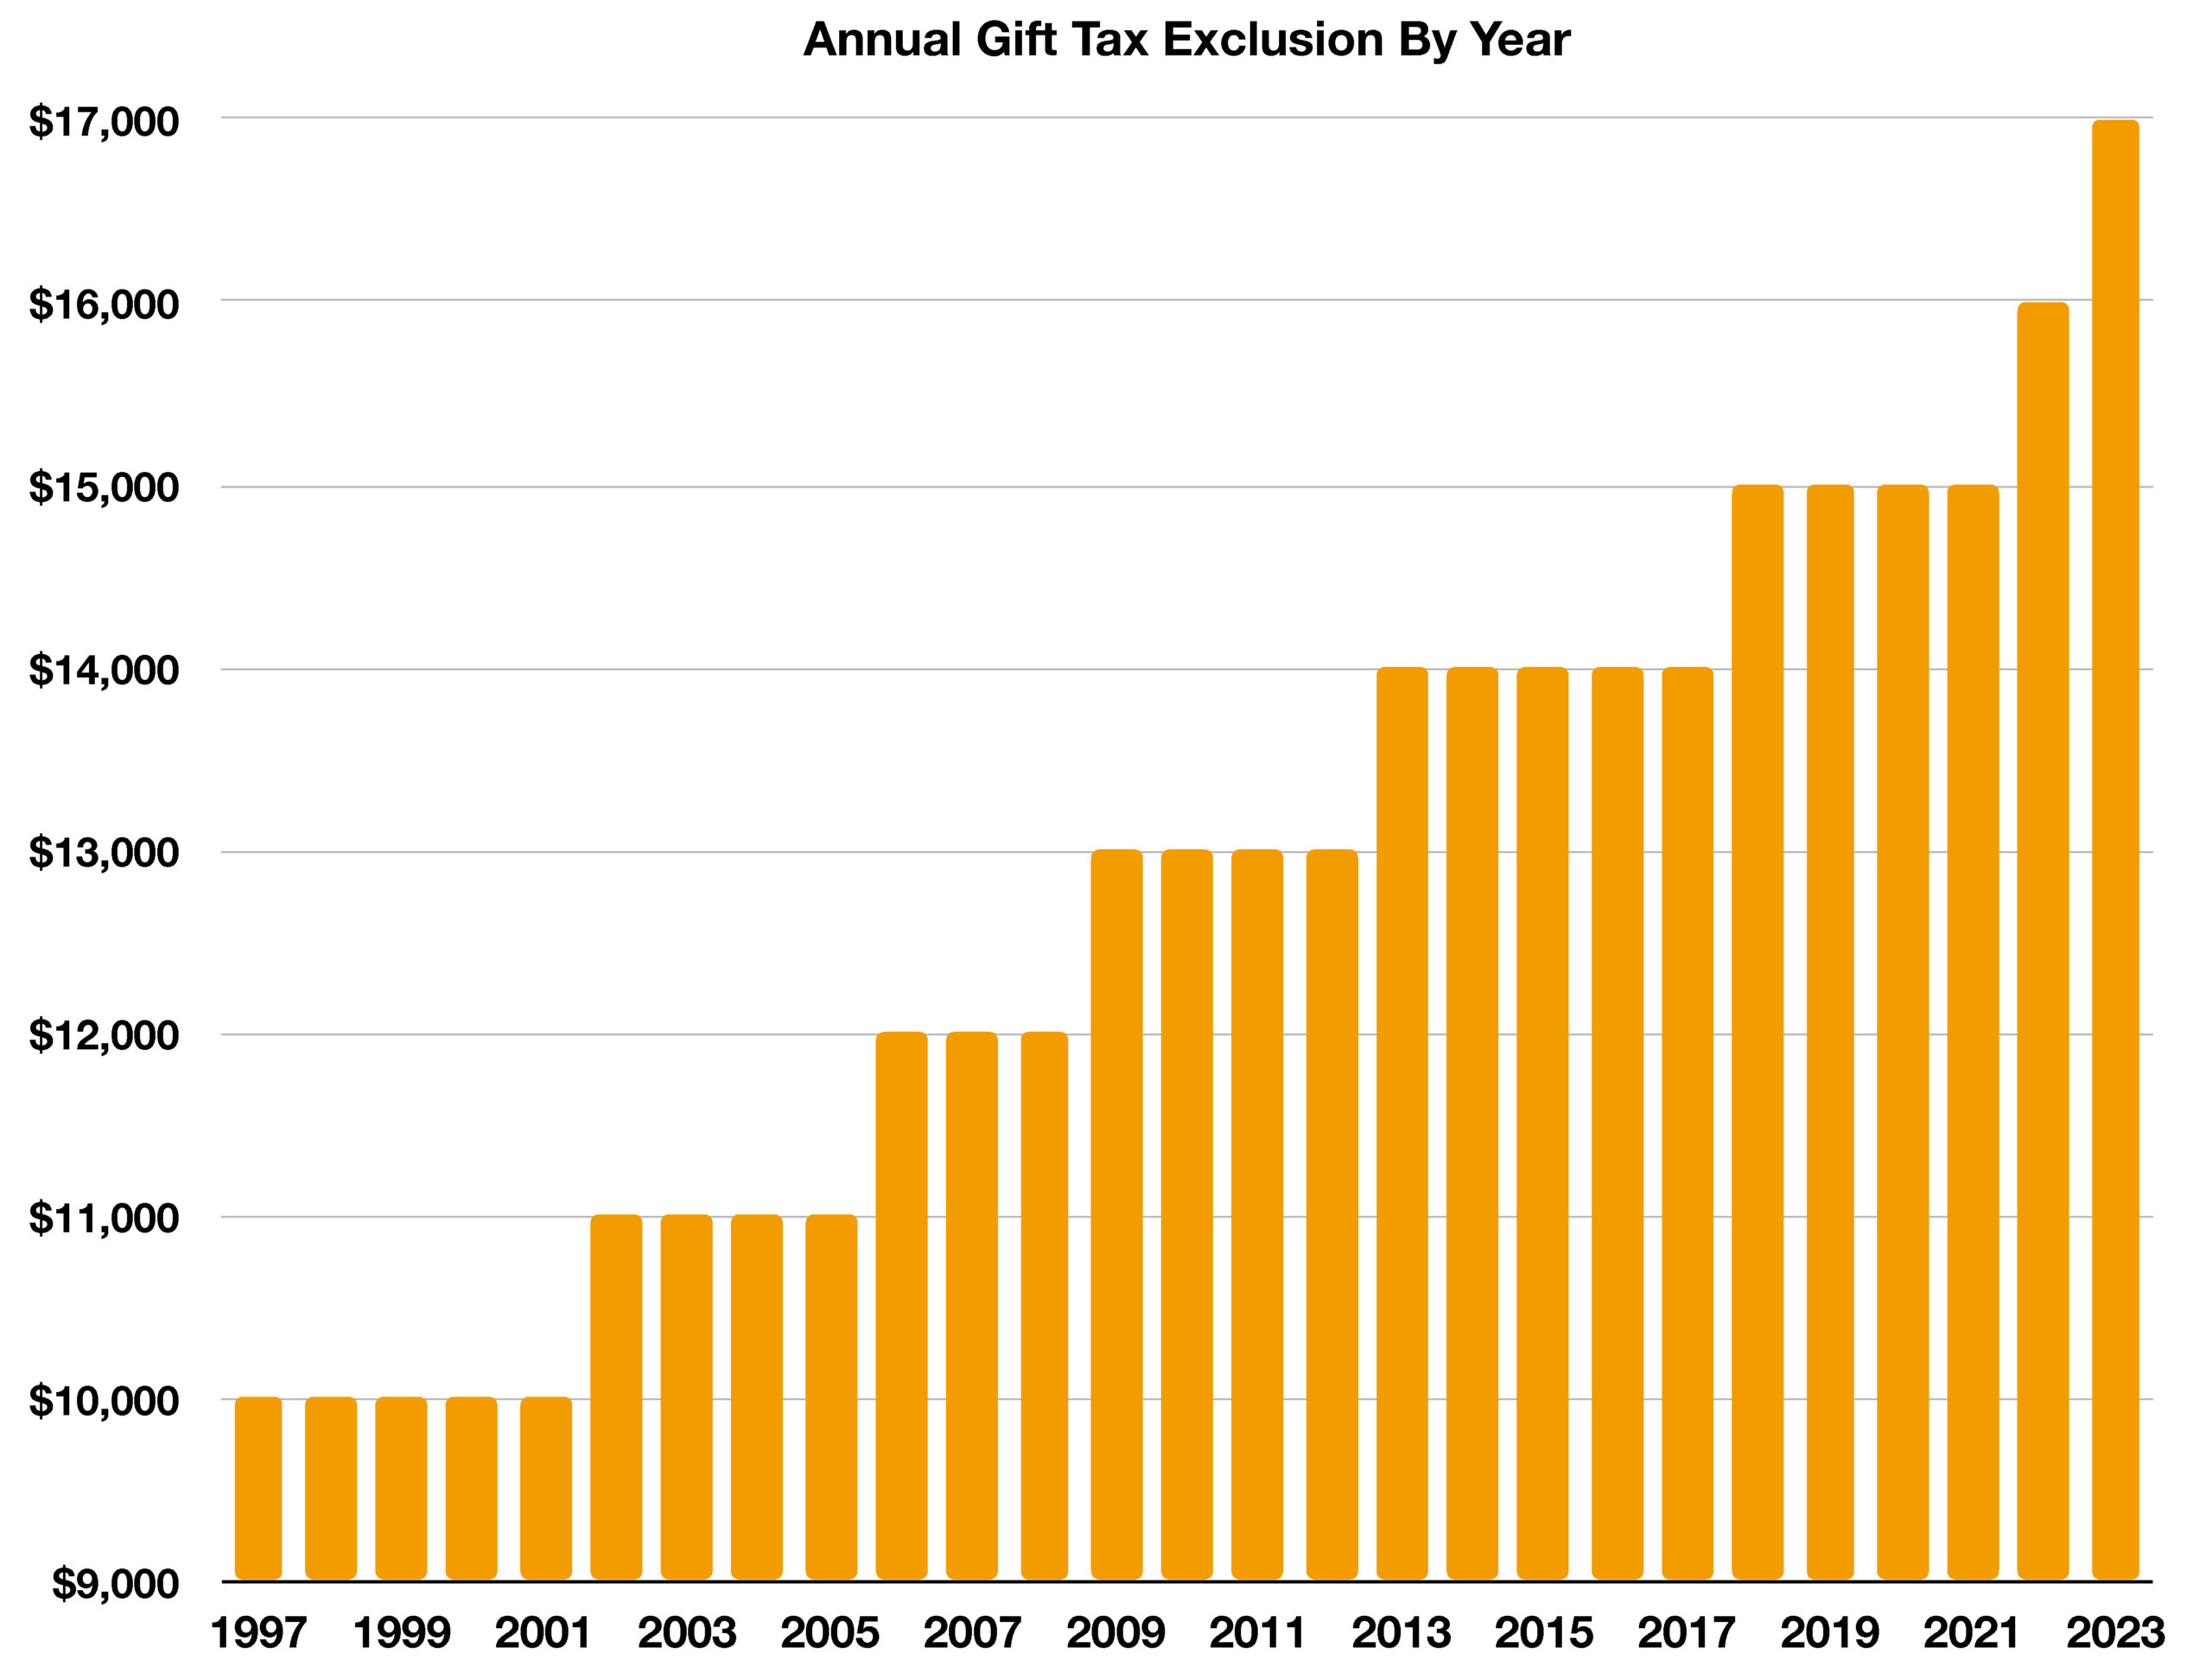
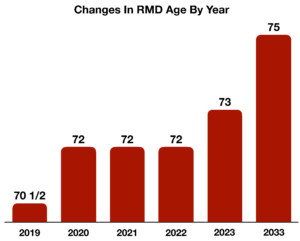
Congress passed the SECURE Act 2.0 in late December, carving the path for revised retirement provisions intended to help Americans save more intelligently for retirement. Among the changes is an increased RMD age of 73 for IRAs, and the ability to convert 529 college savings funds into Roth IRAs.

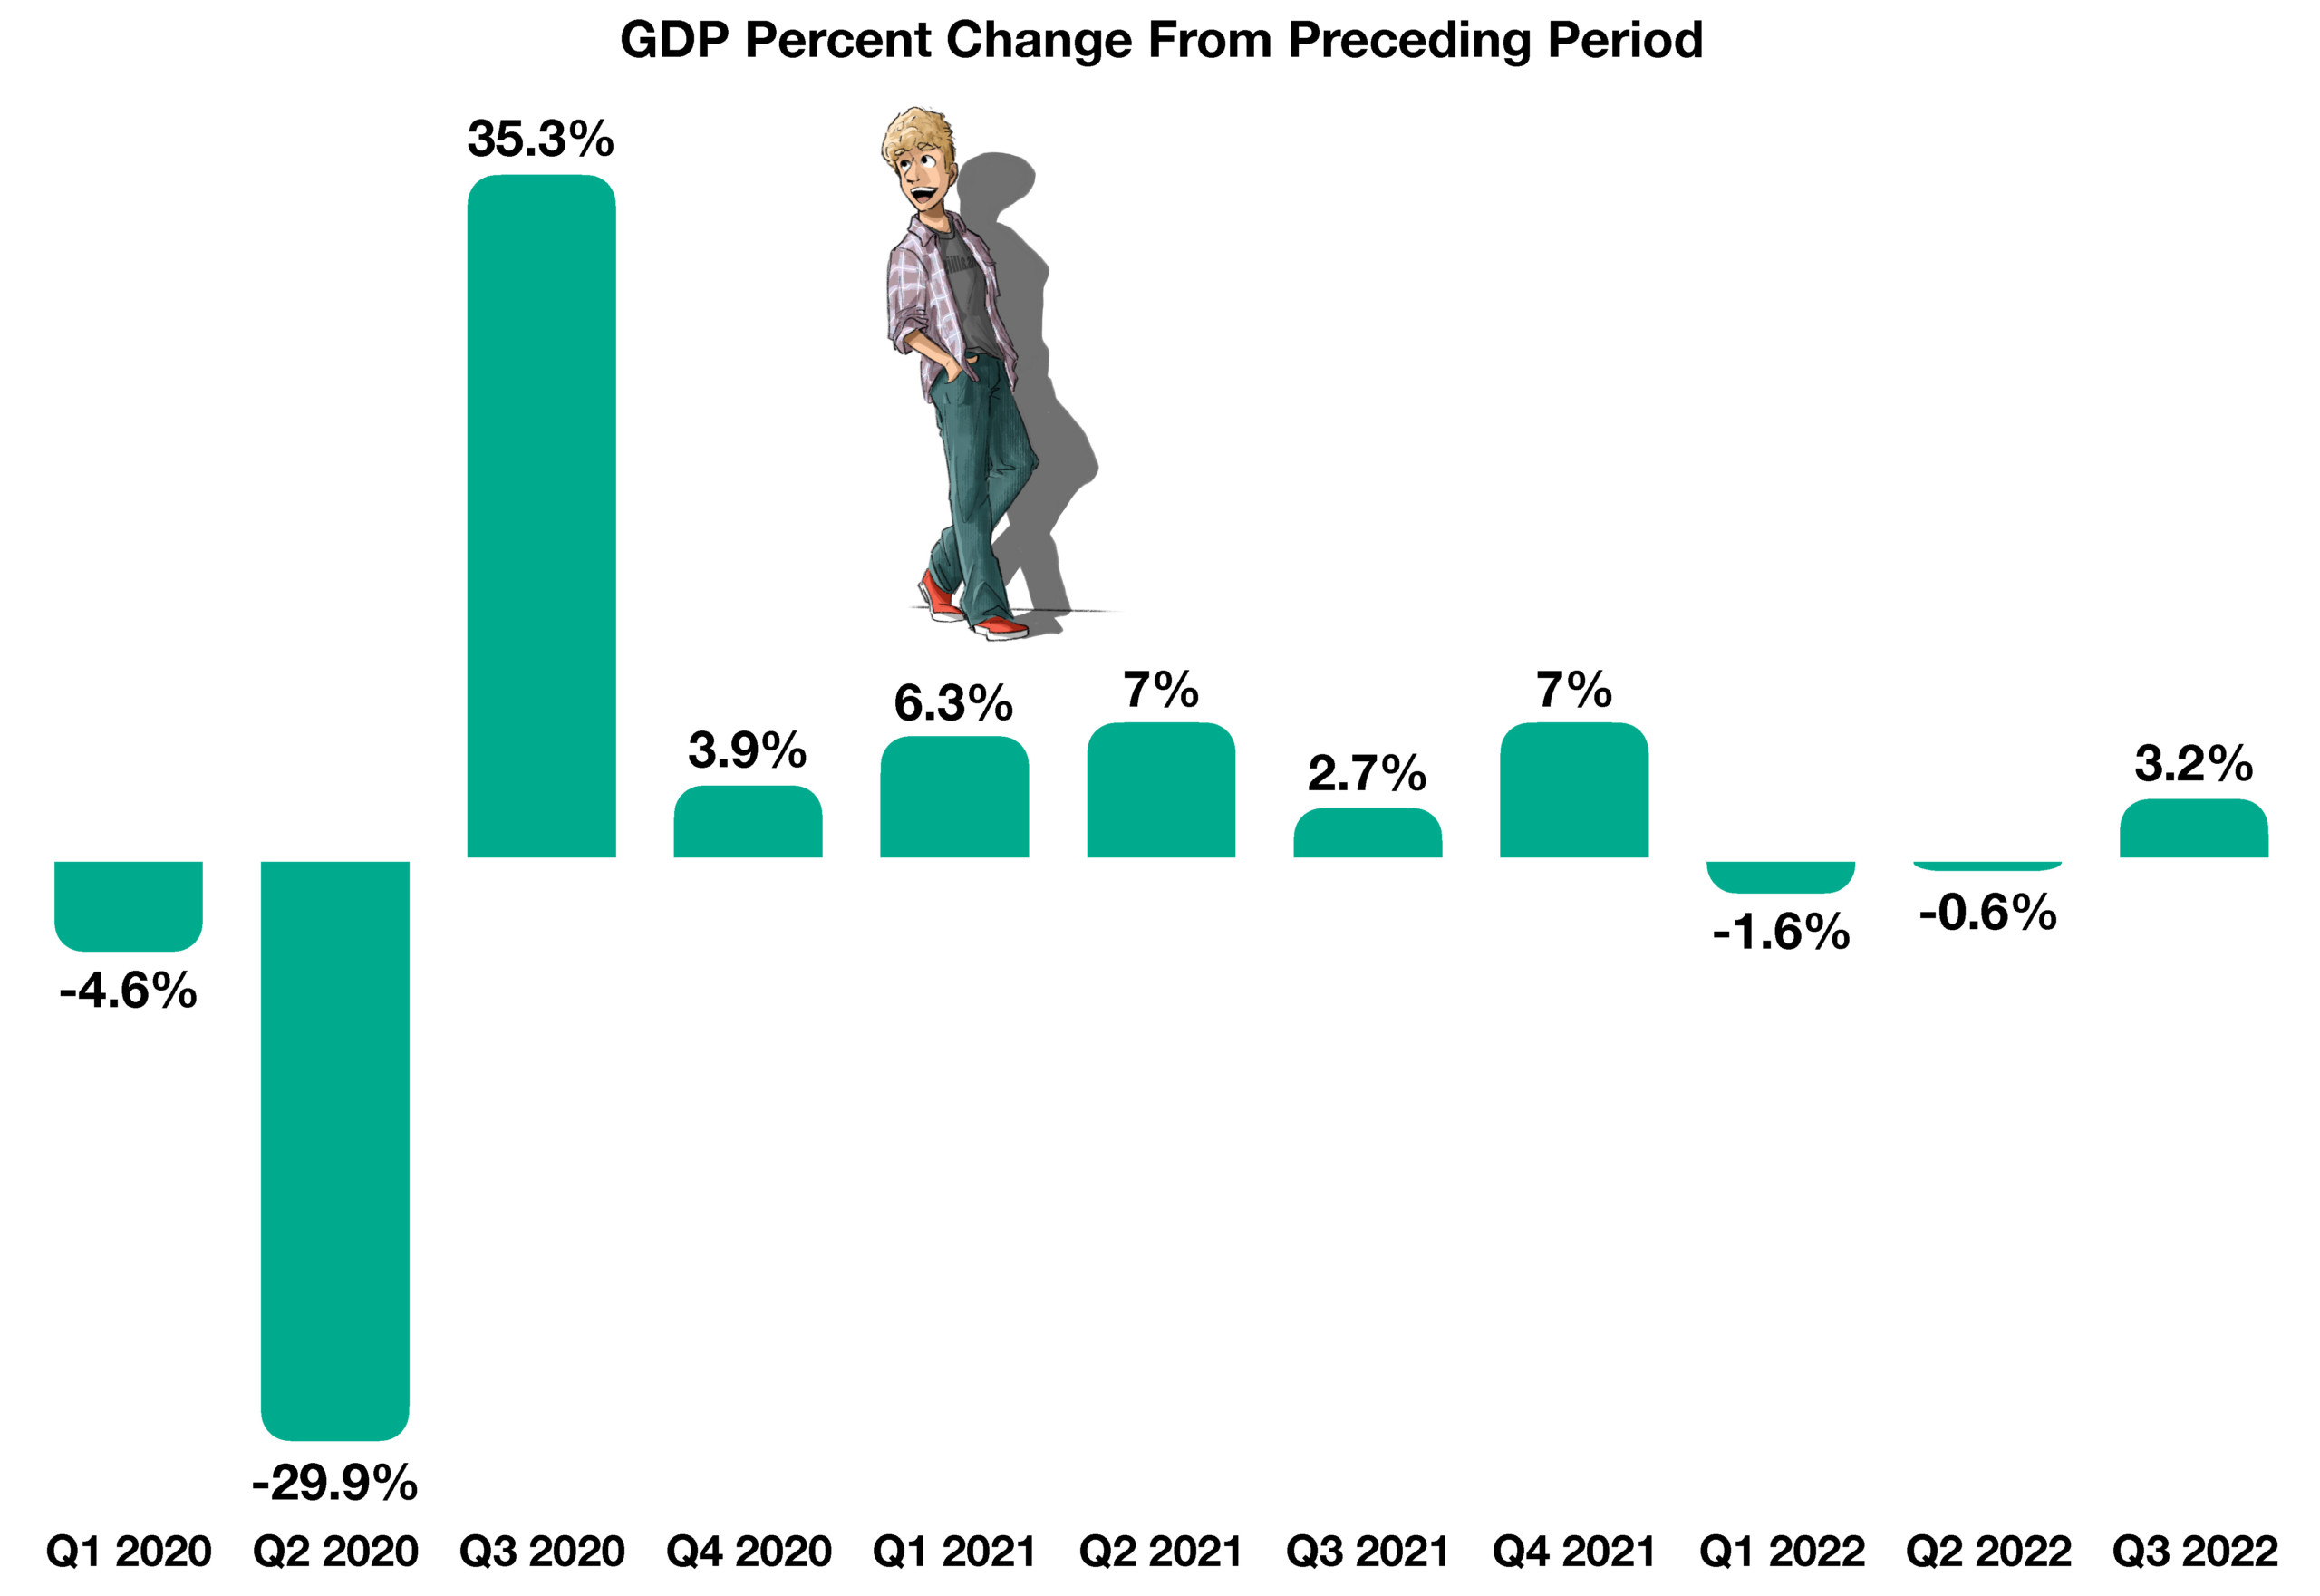
Economic expansion, as measured by Gross Domestic Product (GDP), staged a mild recovery in the third quarter of 2022, up from two consecutive quarters of negative GDP growth. Some analysts believe that the bounce may be short-lived, as ongoing challenges are expected in 2023. A lingering recessionary environment is still a concern for the markets and consumers, instilling a more cautious approach to investing and spending. (Sources: BEA, BLS, U.S. Center for Disease Control and Prevention, U.S. Congress, Federal Reserve)


Standard deductions have increased to $27,700 for married couples in 2023

Interest Rates – Short Term Rates Remain Higher Than Long Term Rates 

40-year highs in inflation and Federal Reserve rate hikes played havoc on bonds throughout 2022, sending short and long terms rates to levels not seen in years. Short-term rates remained higher than long-term rates at the end of 2022, indicating a continued inverted yield curve. The 10-year Treasury note yield started 2022 at 1.52%, peaked at 4.25% on October 24th, and closed the year at 3.88%. The three-month Treasury bill rate, thanks to the Fed’s continuous increase of short-term interest rates to alleviate inflationary pressures, started the year at 0.06% and closed the year at 4.42%. (Sources: Federal Reserve, U.S. Department of the Treasury)

Tax Changes For 2023 – Tax Planning

In 2022, inflation eclipsed 9% and reached 40-year highs as food and gasoline prices exhibited continuous spikes. Many consumers reported consistently feeling that their paychecks did not go as far as they used to, to which the Internal Revenue Service (IRS) has responded by implementing key changes for the tax year 2023. In 2023, inflation adjustments look to match the burdens created by inflation and the decrease in real wages exhibited in 2022. For marginal income taxes, all rates remain the same but now higher income amounts are taxed at lower levels. For example, while the top tax rate is still 37%, it applies to any individual income greater than $578,125 rather than the previous threshold of $539,900.

Standard deductions have increased to $27,700 for married couples in 2023, up $1,800 from 2022. The annual gift tax exclusion is up to $17,000, with 2023 being the first year the exclusion will rise only one year after it was previously increased since the exclusions inception in 1997. Itemized deductions continue to have no limitation since 2018, and the estate tax exclusion amount for 2023 will be $12,920,000, nearly $900,000 greater than in 2022. Taxes reflecting these changes will be filed in early 2024, yet will apply for the tax year 2023. (Source: Internal Revenue Service)

 
The Secure Act 2.0 raises RMDs to 73 in 2023 and to 75 in 2033

Highlights From The SECURE Act 2.0 – Retirement Planning

In response to an aging American population, a bipartisan retirement measure passing through Congress looks to assist Americans nearing retirement in the next decade. The measure, titled Secure Act 2.0, builds upon previous changes to retirement policies in 2019 and makes saving for retirement easier. A major highlight of the Secure Act 2.0 is to increase the age at which required minimum distributions (RMDs) begin, allowing workers and retirees to leave funds in retirement accounts for longer, thus pushing off additional tax liability.

In 2019, the RMD age was raised from 70½ years of age to 72. Now, the Secure Act 2.0 raises it to 73 beginning in 2023 and to 75 in 2033. These gradual changes are expected to accommodate and assist an incoming wave of baby boomers nearing retirement. With a few extra years before RMDs kick in, older workers have greater incentives to continue saving for retirement. Company-sponsored retirement plans will require automatic enrollments into 401(k) and 403(b) plans, whereas it is currently only optional for employers to do so. In these plans, employers must also set up a contribution rate between 3% and 10%, plus an automatic contribution increase of 1% annually until a range of 10% to 15% is met. This provision will go into effect beginning December 31, 2024.

Another key change introduced by the Secure Act 2.0 will be allowing employer contributions for student loan payments. This would allow employers to match contributions to employee retirement plans based on student loan payments, easing the journey of saving for retirement. In the case of an emergency, Secure Act 2.0 also allows for a penalty-free withdrawal of up to $1,000 a year versus a previous 10% early-withdrawal penalty for withdrawals made under the age of 59½. Secure Act 2.0 also raises the ceilings on catch-up payments made past the age of 50, with an emphasis on payments made between the ages of 60 and 63. (Sources: U.S. Congress; Internal Revenue Service)

Gas Prices Fall to an 18-Month Low – Oil Industry Update

Average gasoline prices have officially reached an 18-month low after extraordinary prices in 2022. The average price per gallon of regular gasoline across the U.S. stood at $3.09 at the end of 2022, which was last seen over 18 months ago in June of 2021. In 2022, several international factors including supply limitations due to the war in Ukraine led to abnormally high fuel costs for consumers. The average price per gallon across the nation eclipsed $4 for 22 weeks in a row and surpassed $5 in June of 2022. Gasoline became a financial burden for many consumers throughout 2022, compounding already higher prices for other essential items. (Sources: U.S. Energy Information Administration, Federal Reserve Bank of St. Louis)

 
Healthcare Spending & Life Expectancy, By Country

Healthcare Spending & Life Expectancy, By Country

The most recent data from the World Bank include both the average life expectancy and healthcare spending per capita for 178 different nations. Perhaps not unexpectedly, the analysis discovered that nations with higher healthcare expenditures tended to have longer average life expectancies up to and including the age of 80. However, United States has the largest spending ($10,921) and an average life expectancy of 77 years vs. other countries such as Japan ($4,360/84.6y), Singapore ($2,633/83.7y), and Chili ($1,376/80.3y) have some of the highest life expectancies on the list despite their relatively low spending per capita (Source: Zerohedge)