Ocean Park Capital Management

2503 Main Street

Santa Monica, CA 90405

Main: 310.392.7300

Daily Performance Line:  310.281.8577

Year End 2022
Market Update
(all values as of 04.30.2024)

Stock Indices:

Dow Jones 37,815
S&P 500 5,035
Nasdaq 15,657

Bond Sector Yields:

2 Yr Treasury 5.04%
10 Yr Treasury 4.69%
10 Yr Municipal 2.80%
High Yield 7.99%

YTD Market Returns:

Dow Jones 0.34%
S&P 500 5.57%
Nasdaq 4.31%
MSCI-EAFE 1.98%
MSCI-Europe 2.05%
MSCI-Pacific 1.82%
MSCI-Emg Mkt 2.17%
 
US Agg Bond 0.50%
US Corp Bond 0.56%
US Gov’t Bond 0.48%

Commodity Prices:

Gold 2,297
Silver 26.58
Oil (WTI) 81.13

Currencies:

Dollar / Euro 1.07
Dollar / Pound 1.25
Yen / Dollar 156.66
Canadian /Dollar 0.79
 

Portfolio Overview

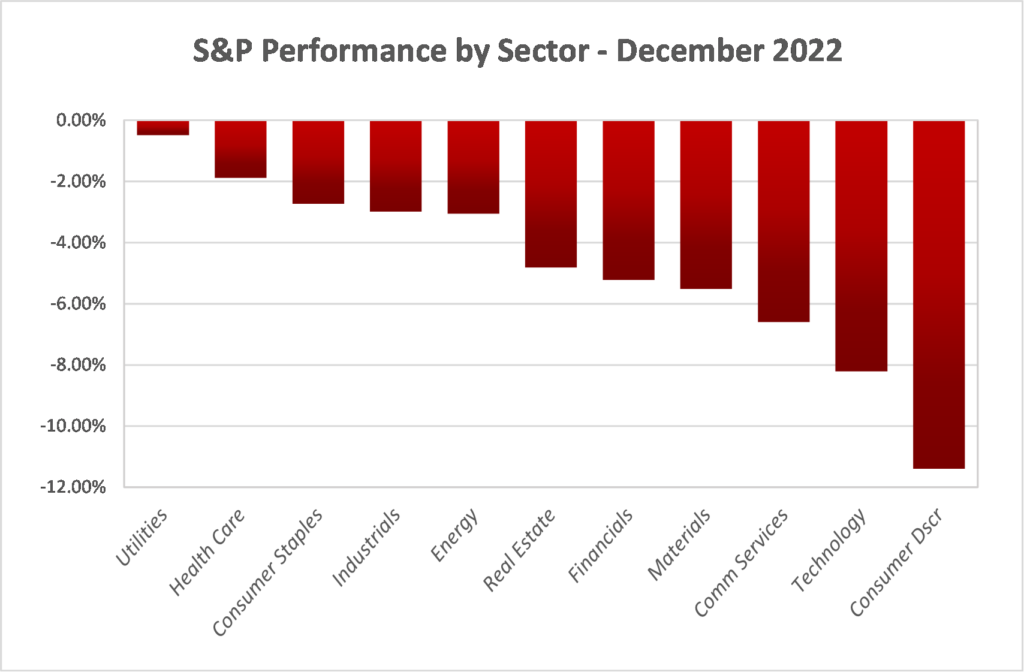
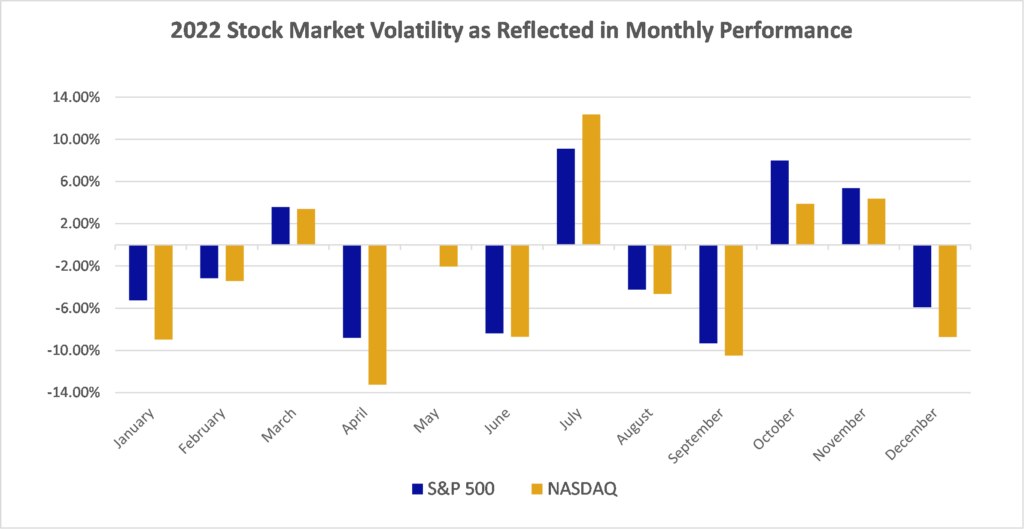
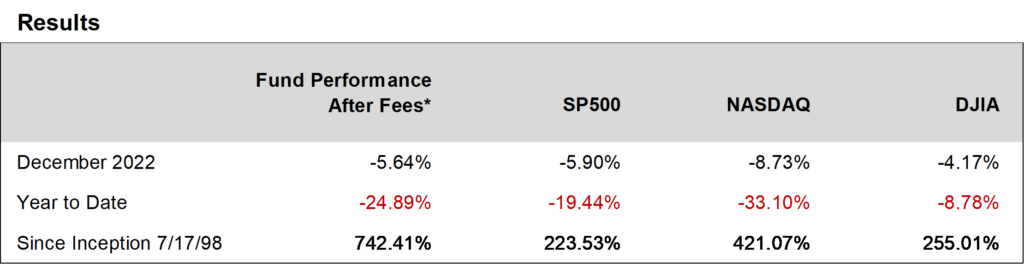
Ocean Park Investors Fund fell 5.64%* in December.  The S&P 500 fell 5.90% and the NASDAQ Composite fell 8.73%.  Consumer and technology stocks, which comprise most of the portfolio, were weak.  For the year, the fund lost 24.89%*, the S&P 500 lost 19.44%, and the NASDAQ Composite lost 33.10%.

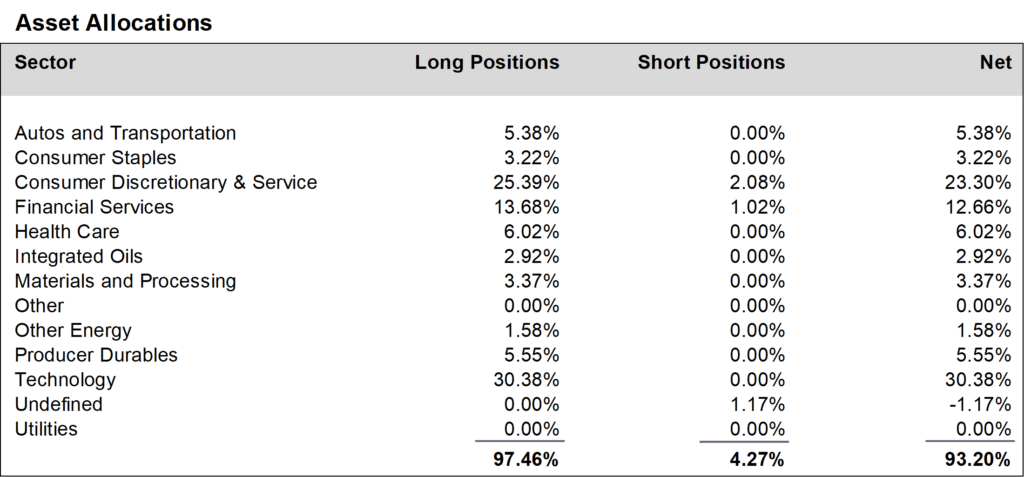
During December, we increased positions in the consumer discretionary and service sector and reduced positions in the financial services sector.  We finished the month at about 93% net long, down from about 94% in November.

We once again thank you for your investment in the Fund, as we strive to build upon our long-term performance and earn your continued confidence.


Daily updates on our activity are available on our Results Line, at 310-281-8577, and current information is also maintained on our website at www.oceanparkcapital.com. To gain access to the site enter password opcap.

*These results are pro forma. Actual results for most investors will vary. See additional disclosures on page 4. Past performance does not guarantee future results.

 
Equity Overview

Equity Overview

All sectors lost ground in December, with consumer stocks hurt the most and utilities the least.  Value stocks again outperformed growth stocks for the month.  For the full year, the shift in market leadership from growth to value stocks was unmistakable as value outperformed growth by 20%–its second-best performance in more than 40 years.

Markets continued volatile.  For the month, the S&P 500 moved by 1% or more on 9 of 22 trading days.  For the year, the S&P 500 moved by 5% or more in 8 of 12 months– and the NASDAQ Composite moved by 8% or more in 6 of 12 months.


Macro Overview

Macro Overview

2022 was a challenging year for stocks.  Inflation spiked and in response the Fed abandoned its accommodative monetary policy and raised interest rates dramatically.  To get a sense of just how dramatically, at the start of 2022 expectations were that the Fed would raise rates by 0.75% over the year.  The actual increase for 2022 was 4.25%.  Predictably, domestic economic growth suffered.  At the same time, the Russian invasion of Ukraine upended the global economy.

The Fed efforts began to show results by year’s end, as inflation cooled from its peak of 9.1% to 6.5%.  But high interest rates generally inhibit corporate profits–particularly for technology stocks.  And lower profits translate to lower stock prices.  The silver lining is that a lot of air has come out of the market and prices are now more reasonable.  The forward 12-month price/earnings ratio for the S&P 500 at year’s end was 17.3, well below the 5-year average of 18.5.

Where do we go from here?  The worry is that high interest rates will kill growth and drive the economy into recession in 2023.  But the Fed projects a marginally positive GDP gain of 0.5% in 2023 which would mean significantly lower growth but not a recession.  Goldman Sachs, among others, finds that plausible, suggesting that “a long enough period of slower but still positive GDP growth may gradually help balance labor demand and supply and get control over prices.”  Other factors supporting growth include:   $550-billion injected into the economy through the Infrastructure Investment and Jobs Act; the decline of gas prices to pre-spike levels; significant improvements in the supply chain problems that have dogged the economy; and the apparent mitigation of Covid impacts, through vaccination and post-infection drug treatments.

In short, we agree with the sentiment Warren Buffet expressed several years ago: that the American economy has always rebounded from adversity and is likely to do so again.


Additional Disclosures

Additional Disclosures

Performance data for OPI reflect the reinvestment of dividends and other earnings on the fund’s assets.  Performance data for the major indices reflect only changes in the value of those indices, and would be higher if dividends were included. However, the index data do not reflect fees that would be paid to index fund managers and transaction costs that would be incurred when their component stocks are bought or sold, while OPI’s data do reflect quarterly fees and expenses incurred by the fund.  The information provided is believed to be reliable, but its accuracy or completeness is not warranted. This material is not intended as an offer or solicitation for the purchase or sale of any stock, bond, mutual fund, or any other financial instrument. The views and strategies discussed herein may not be appropriate and/or suitable for all investors. This material is meant solely for informational purposes, and is not intended to suffice as any type of accounting, legal, tax, or estate planning advice. Any and all forecasts mentioned are for illustrative purposes only and should not be interpreted as investment recommendations.