Jason Napoli, ChFC, AAMS, MBA

President and Chief Investment Officer

High Country Capital Management

970.249.3499

www.hccm.com

July 2016
Market Update
(all values as of 04.30.2024)

Stock Indices:

Dow Jones 37,815
S&P 500 5,035
Nasdaq 15,657

Bond Sector Yields:

2 Yr Treasury 5.04%
10 Yr Treasury 4.69%
10 Yr Municipal 2.80%
High Yield 7.99%

YTD Market Returns:

Dow Jones 0.34%
S&P 500 5.57%
Nasdaq 4.31%
MSCI-EAFE 1.98%
MSCI-Europe 2.05%
MSCI-Pacific 1.82%
MSCI-Emg Mkt 2.17%
 
US Agg Bond 0.50%
US Corp Bond 0.56%
US Gov’t Bond 0.48%

Commodity Prices:

Gold 2,297
Silver 26.58
Oil (WTI) 81.13

Currencies:

Dollar / Euro 1.07
Dollar / Pound 1.25
Yen / Dollar 156.66
Canadian /Dollar 0.79
 

Macro Economic Overview

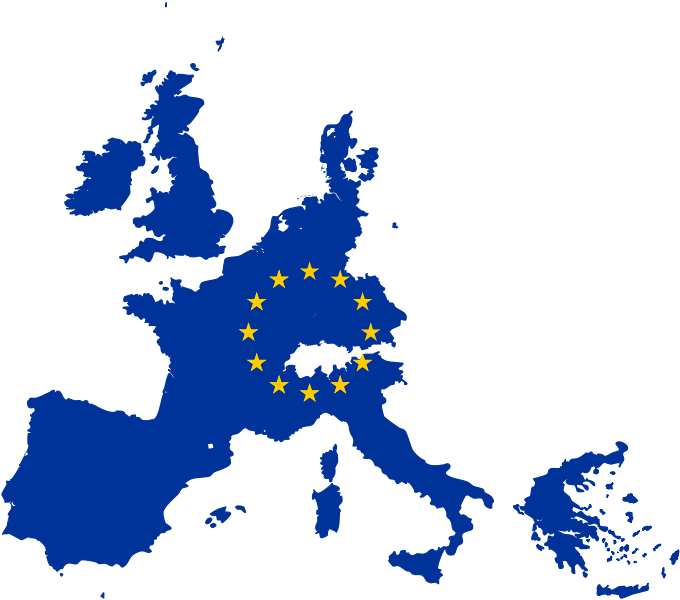
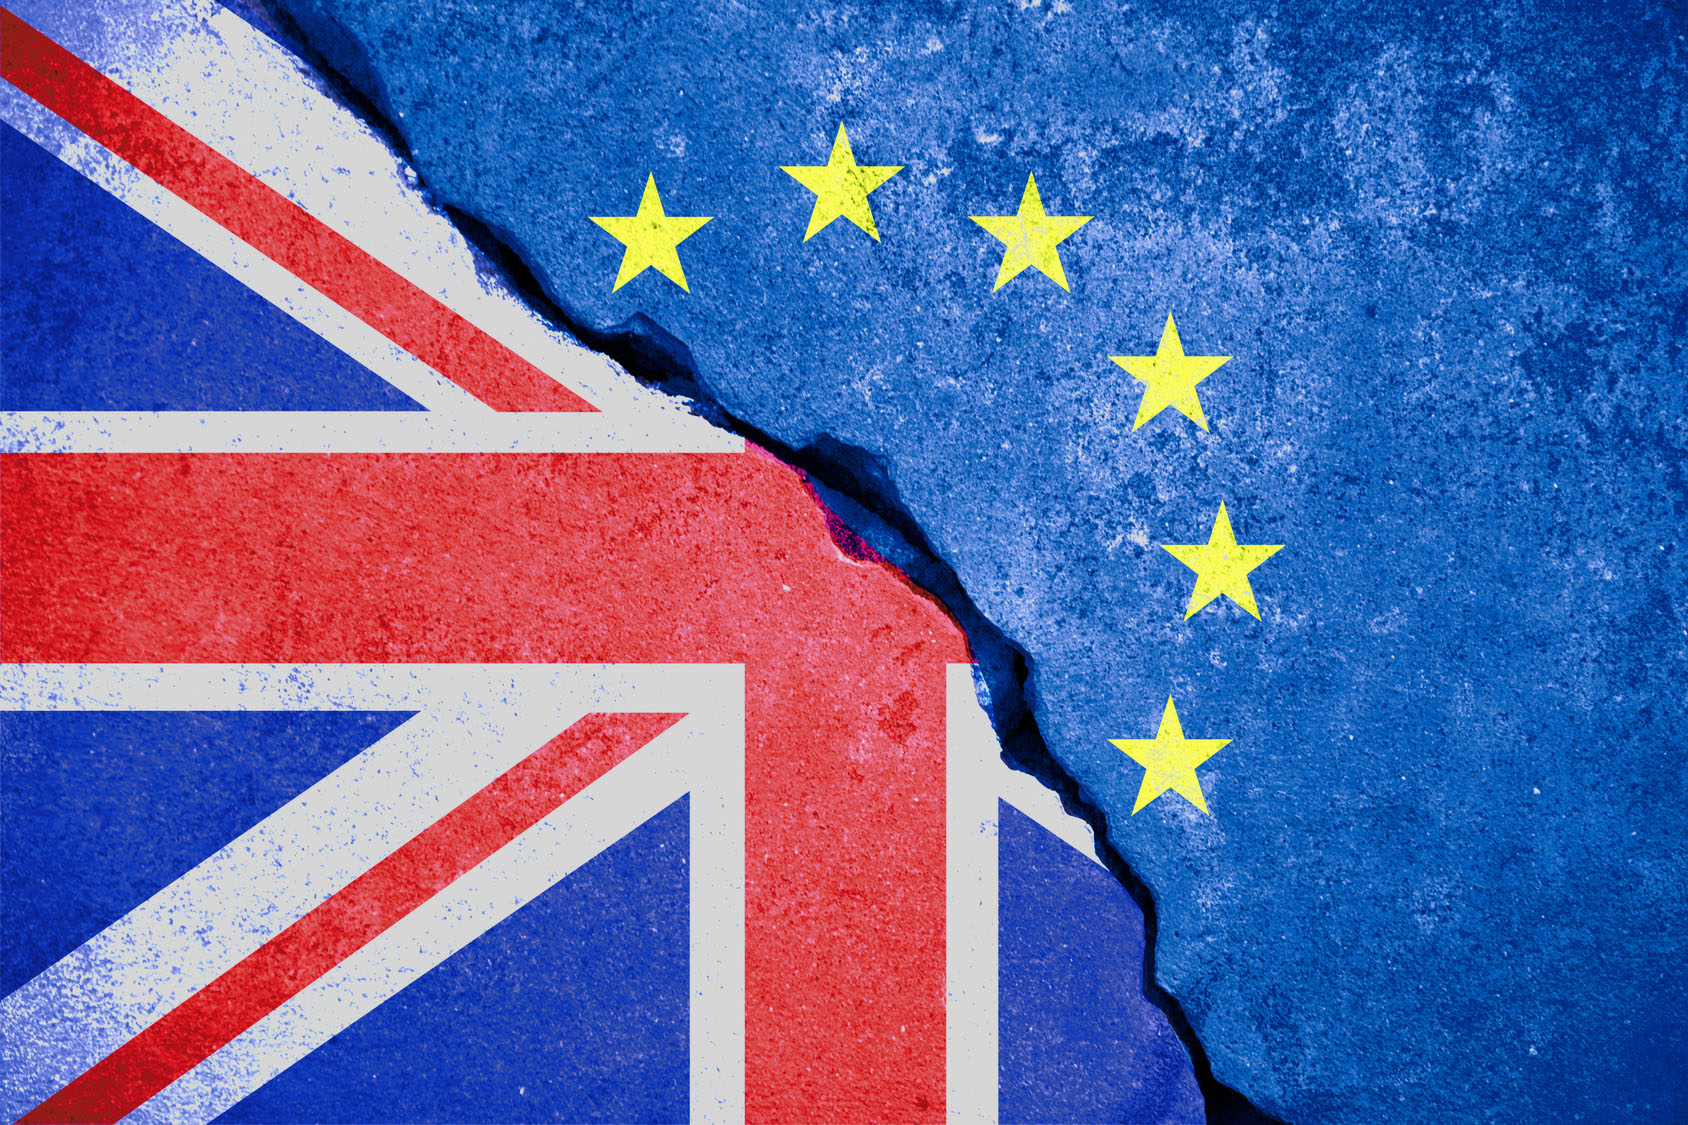
The British vote to exit the EU was essentially a validation that a disintegration process of the EU is possibly underway, causing destabilization for countries throughout the EU. Britain’s vote may lead to other similar referendums, particularly with the Netherlands and France where populist sentiment is growing.

The British pound fell to a 30-year low versus the U.S. dollar following the outcome of the referendum. Conversely, the fall in value for the British pound can be beneficial for the country as Britain’s exports become cheaper worldwide and tourism increases as stronger foreign currencies come into the country.

The unraveling of Britain from the EU is not expected to be automatic or immediate and may take years for it to finalize. Britain would need to execute a divorce clause titled Article 50 of the EU agreement in order to move forward with the separation from the EU. Several member EU countries, including the IMF, are eager to have Britain expedite the exit in order to minimize uncertainty.

brexit blue european union EU flag on broken wall and half great britain flag, vote for united kingdom exit concept

In the wake of the referendum’s outcome, international equity markets tumbled as uncertainty led the course. U.S. financial markets were incredibly resilient following the days after the British EU vote, with U.S. equity and bond prices all propelling to higher levels.

The Fed’s plan to further increase rates this year took a different course as the repercussions from Britain’s EU vote are expected to lead to slowing economic growth and a sustained low interest rate environment. Some Fed watchers even believe that the Fed may ramp up its stimulus efforts again with lowering rates should the EU and Europe’s economy falter.

Overshadowed by the Brexit news, the U.S. Census Bureau reported data that may help solidify the Fed’s wait to raise rates. Durable goods orders fell 2.2% in May, worse than anticipated. Such data is an indicator of whether inflationary pressures are present and if inconsistent expansion exists in the economy due to less capital spending.

In the midst of the Brexit turmoil, the Federal Reserve announced that 33 selected U.S. banks passed an imposed stress test to see how well they’d perform under severe circumstances, such as high unemployment, recession, and falling asset prices. The stress test revealed that the 33 banks tested had nearly twice the amount of required capital needed, up significantly from the last stress test conducted.

(Sources: Eurostat, Bloomberg, Federal Reserve, U.S. Census Bureau)

 
Britain’s Net Migration Stood at 333,000 in 2015, The Second Highest Figure on Record

Britain’s Relationship With The EU & The Effects Of Brexit – EU Overview

Now that the decision to exit the EU has been made, the next step is to start the actual process. When the EU was initially established after WWII, a clause was inserted into the EU agreement to address any countries that should want to terminate and exit the agreement in the future. The clause is known as Article 50 and the article establishes the balance of power for divorce talks. It also lays down the voting rules for deciding how to part ways and sets a two-year deadline on talks that can only be extended by a unanimous decision of the other 27 EU countries.

While starting the formal break-up process is in the hands of Britain’s Prime Minister, a decision on how and when to end it would not be. Britain’s departing Prime Minister, David Cameron, did not trigger Article 50 and is leaving it to his successor, to the annoyance of those in the EU who want a fast and efficient break. Only the British government can decide when to invoke Article 50 as it is not designed to oust a country from the EU.

Immigration has been at the root of contention, as Britain’s net migration stood at 333,000 in 2015, the second highest figure on record for the country. Net immigration from EU countries, particularly central and eastern European member countries, rose rapidly after their accession to the EU in 2004 and offered migrants the ability to work and settle in the UK. Only by leaving the EU can the government reduce the number of EU migrants.EU Mapflag

With a population of over 500 million throughout the 28 EU countries, the United Kingdom represents 12.7% of the EU’s total population, one of the larger components making up the EU. The union was developed as an integral single market through a standardized system of laws that apply to all 28 member countries, thus allowing for the free movement of people, goods, services and capital.

On a global scale, the EU covers over 7% of the world population, made up of distinctive cultures and languages, all sharing the same financial and trade laws. The British approval to exit the EU is the catalyst for the end of European cohesion and symbolic of a rejection of status quo throughout Europe. International companies and multinationals may now be less eager to expand or hire in the UK as the uncertainty of the EU detachment unfolds. (Sources: Eurostat, europa.eu)

Equity Update – Domestic & Global Stock Markets

U.S. stocks fared better than international stocks following Britain’s announcement on leaving the EU. U.S. equity markets were resilient once the surprise of Brexit unfolded, with the S&P 500 Index and the Dow Jones Industrial Index both positive for the year. Domestic equities are more insulated from global developments and any other major equity markets since American companies generate 70% of the revenues from the United States. Japanese companies generate 50% from within their economy only and European companies generating a mere 49% from Europe only. U.S. equities are considered attractive relative to negative yielding government bonds in Asia and parts of Europe, even as the U.S. 10-year note finished below 1.5% in June. The S&P 500 index currently carries 60% of its stocks with a dividend yield higher than the 10-year treasury bond yield.

The primary British equity index, the FTSE 100, tumbled in June following the Brexit vote. Companies within the index generate about 75% of their revenues outside the U.K., with many maintaining contracts and arrangements with other companies based in other EU countries. Since the actual extraction of Britain from the EU may take years, decisions for capital spending and expansion by European companies may be hindered. (Sources: Department of Labor, S&P, Bloomberg)


The U.S. Treasury 10-year Bond Yielded 1.49% At June End, A Level Not Seen In A Very Long Time

Bonds Worldwide React To Brexit – Global Fixed Income Update

As government bond yields turned negative throughout Europe, rates overseas in the U.S. and in Asia also dropped to new lows. The U.S. Treasury 10-year bond yield stood at 1.49% at the end of the June, a level not seen in a very long time. The concern with ultra-low yields as well as negative yields is when rates eventually do increase, the affect would have adverse consequences for bond prices. The surreal phenomenon of negative yielding government bonds is becoming more of a norm among global fixed income markets.

The U.K. was stripped of its AAA credit rating by Standard & Poor’s, lowering the rating to AA. Such a change may make it more difficult for the British government to issue inexpensive debt. S&P cited the downgrade due to increased risk because of a less predictable, stable, and effective policy framework in the U.K. S&P also noted that the U.K. has the highest financing needs among all of the 131 countries it follows and rates. The U.K. now has a worse rating from S&P than the U.S., whose rating was famously lowered by the credit-reporting firm in 2011, even after the downgrade was adamantly contested by the U.S. Treasury and government.

With the decline in yields around the developed markets, the flight to quality and safety of the U.S. Treasury market seems to be attracting global buyers even at lower yield levels. U.S. fixed income markets solidly outperformed U.S. equity markets as of the end of the second quarter, with corporate, municipal, and government fixed income sectors all advancing. An oddity as it is, bonds kept pace with rising commodity prices from gold to oil, whereas bonds tend to lose value as commodity values increase. (Sources: Moody’s, S&P, US Treasury, Federal Reserve)

Less Men Are Working – Labor Demographics

The Council of Economic Advisors, an agency within the Executive Office of the President, released a report in June identifying the fact that less working age men are working.

The participation rate for men between the ages of 25 and 54 fell more steeply than in all but one country in the Organization for Economic Co-operation and Development (OECD) from 1990-2014, the report found. The U.S. rate is now the third lowest among 34 OECD nations. The participation rate is a measure of how many employable men are willing and able to work, thus participating in the labor force.

The male labor force participation rate peaked at 98% in 1954, and has fallen to 62.6% in May. It is of particular concern since workers at this age are at their most productive age.

Gender Participation Rates 7-5

Part of the reason behind the fall in demand for lower-skilled labor is the drop in manufacturing jobs, resulting in technological change.

The World Bank also tracks the participation rate for men and women worldwide. Its data is similar to that of the administration’s, yet does reveal that women throughout the world are working more. Interestingly enough, the participation rate for women has been steadily increasing versus declining for men worldwide. (Sources: The World Bank, OECD, Council of Economic Advisors)

 
The Median Rent For A New Apartment Was $1,381 In 2015

11 Million Spend Half Of Income On Rent – Housing Update

 As banks and financial institutions have been mandated to increase their loan qualifications for home mortgages due to government regulations, more and more families are being forced to rent rather than own. As the demand for rentals has been increasing, the level of home ownership has been falling. Some attribute this dynamic to a low inventory of homes on the market, while others blame excessive government requirements imposed on mortgage lenders.

A lack of available rentals along with the increased demand for rentals has propelled rental costs upward. The number of individuals dedicating at least half of their income towards rent hit a record high of 11 million people in 2014, according to the annual State of the Nation’s Housing Report from the Joint Center for Housing Studies.

As rental prices have been rising faster than wages, losing such a large portion of a paycheck to cover housing means cutting back on essentials such as food, clothing and health care. This can be draining on young families trying to save for a down payment on a home purchase and then not knowing if they’d be able to get approved or not.

Last year saw the biggest surge in new renters in history, according to the report, bringing the number of people living in rental units to around 110 million people, accounting for about 36% of households. Middle-aged renters made up a substantial portion of the new demand, with 40% of renters aged 30-49.

More affluent renters are staying in the rental market longer and driving up the demand for housing. Traditionally, the wealthy move on to become homeowners, but tight inventory in the housing market is keeping them in rentals longer.


Homeownership Rates Chart


The median rent on a new apartment was $1,381 in 2015, according to the report, which means that a renter would have to make at least $55,000 a year before taxes in order to be able to afford the rent. (Sources: Joint Center For Housing Studies)