Americans Are Working More & Sleeping Less – Demographics
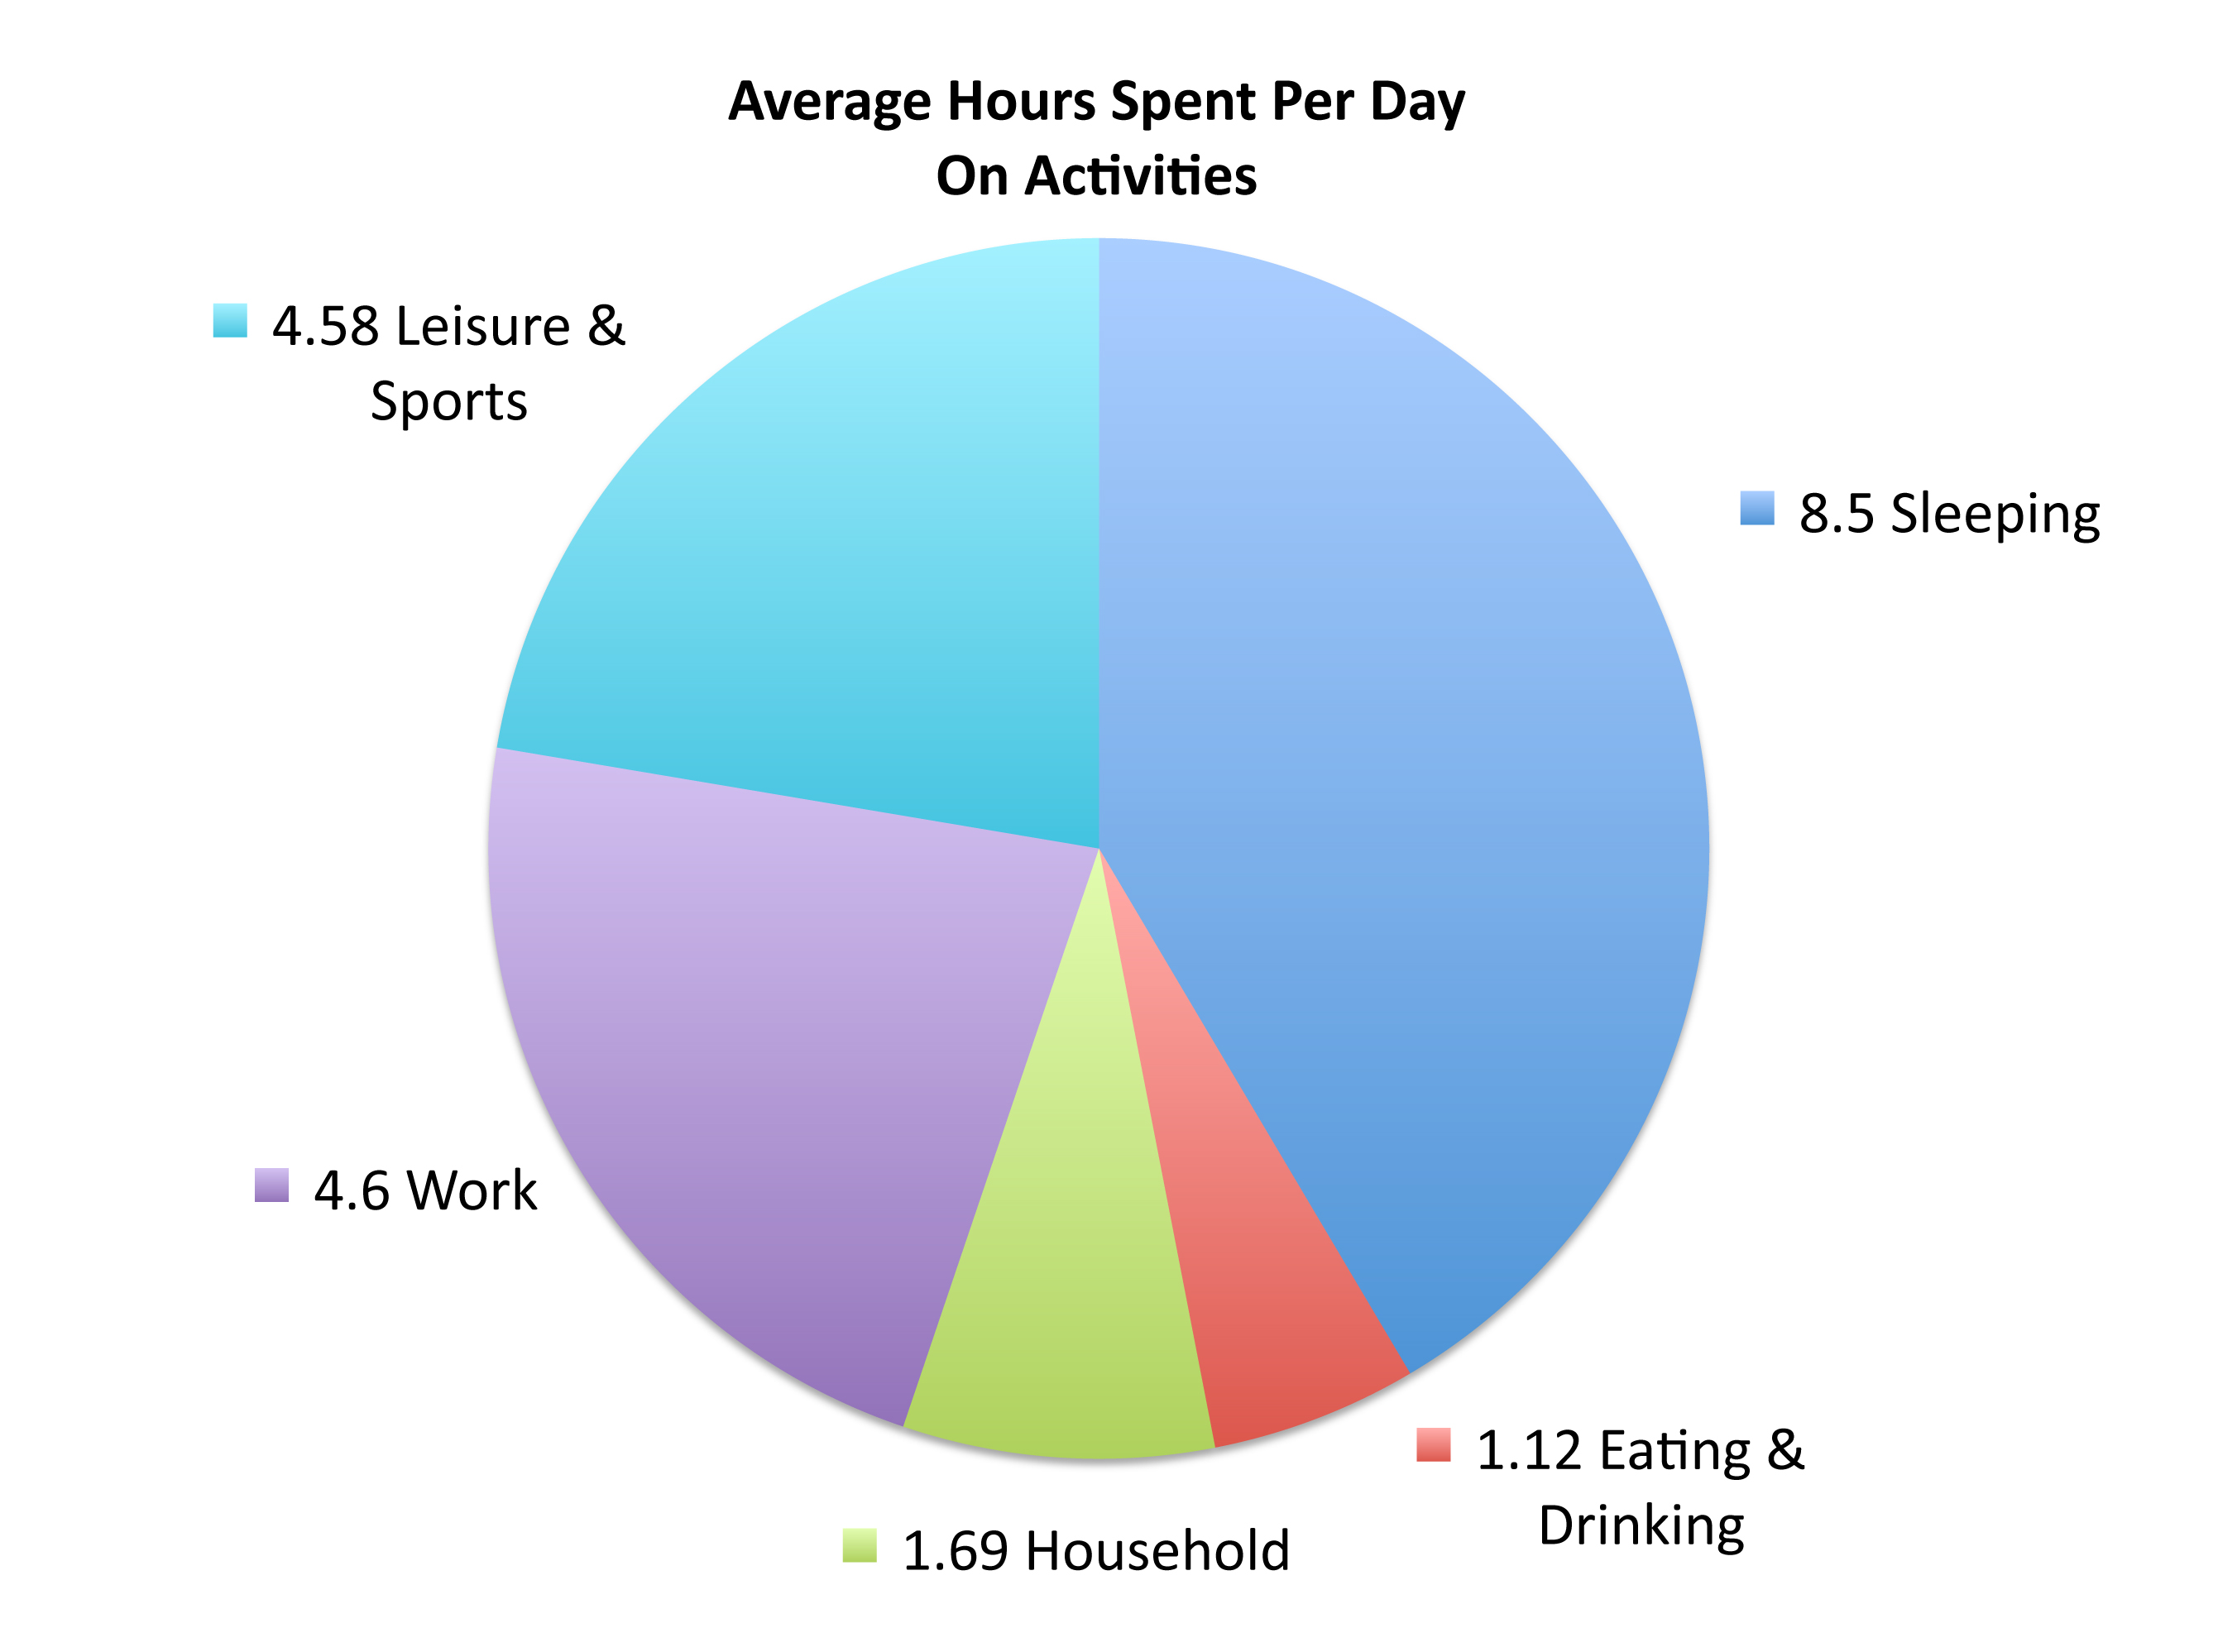
The Department of Labor in June released a survey, called the American Time Use Survey, on how much time Americans spend working, sleeping, and a host of other activities. Nearly 10,500 people were surveyed by the Labor Department nationwide for this latest report.
The survey found that Americans spent just over 4.5 hours each weekday working in 2016, an increase of 8 minutes from the previous year. Meanwhile, the average amount spent sleeping fell by 5 minutes from the year before, to 8.5 hours per day. The survey results may not necessarily be representative of everyone, but for a basic government report, it does give employers and economists a rough idea of how we spend our day. (Source: Department of Labor; American Time Use Survey June 2017)
CD Rate History – Historical Note
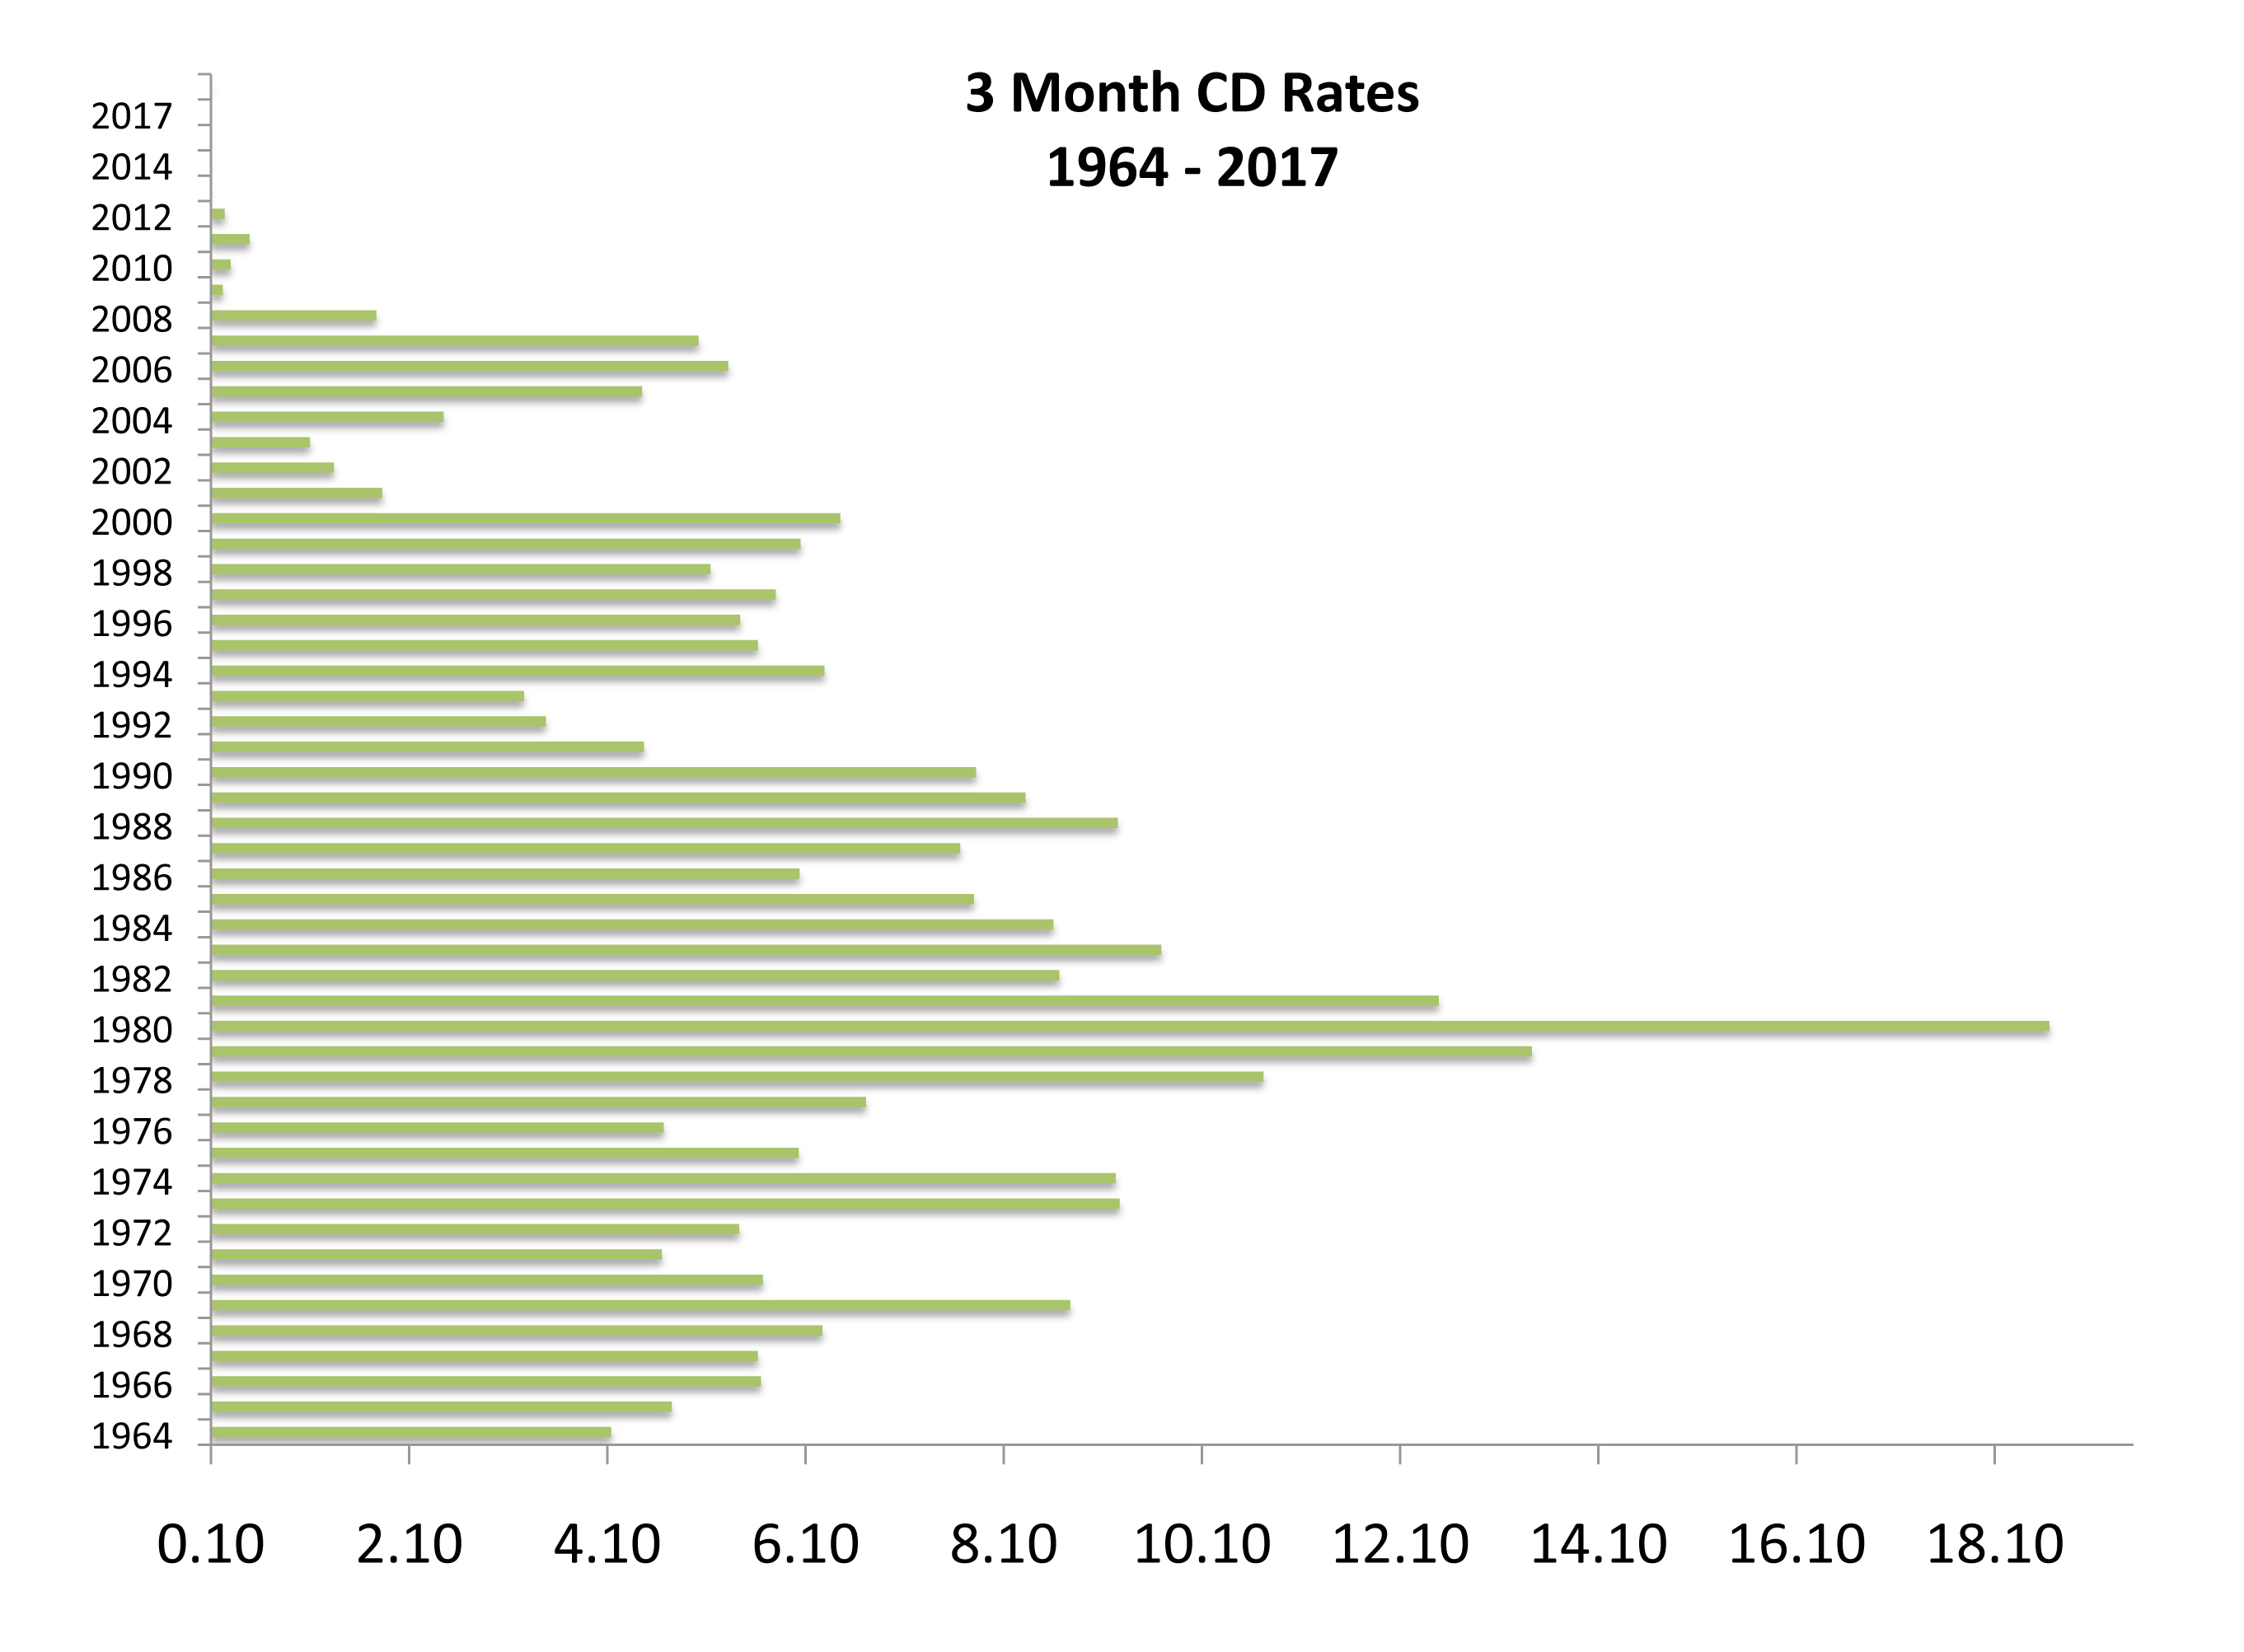
Not since the days of inflation and high interest rates have Certificates of Deposits (CDs) been perceived as a viable source of income for retirees and conservative savings for working individuals.
Contrary to what most people think, a CD isn’t as liquid as many believe. Banks restrict access to the funds until the maturity date of the investment and impose penalties for early withdrawals. Data compiled by both the FDIC and the Federal Reserve over the decades has carefully tracked CD rates offered by banks nationwide. The average 3-month CD as of this past month has a rate of 0.91%, roughly 1/10th of a comparable 3-month CD in 1983. The primary drawback of using CDs as an investment is that a fixed rate over a short period of time doesn’t produce the growth that stocks may produce over a long period of time. So when a 3-month CD paid 13.78% in 1979, the inflation rate of 13.3% that same year translated into earning a meager half percentage difference in real terms net of inflation. The challenge today, even with low inflation of below 2%, is that the average 3, 6, and 12-month CD rate is still below the current rate of inflation. (Source: Federal Reserve Bank of St. Louis)
The Fed Sets Short Term Rates While The Market Dictates Long Term Rates
Equity Overview – Global Equity Overview
The equity markets started to experience what stock analysts call a sector rotation, when one or several sectors fall out of favor leading to funds flowing to other sectors. This past month technology stocks fell as markets perceived that the sector may have become overvalued. As this occurred, banking and financial sector stocks rose, as favorable regulatory related news lifted the overall sector.
The S&P 500 index posted its strongest first half of the year since 2013. The Dow Jones industrial average index rose 8% in the first half of 2017, its best performance since 2013, while the S&P 500 was up 8.2% the first half of 2017. The NASDAQ’s strong performance for the first six months of 2017 was predominantly led by the technology sector, its best first half since 2009.
Global equity markets had the best first annual half since 2009. Overall improving sentiment in the euro zone as well as increasing international growth prospects helped propel global markets the first half of 2017.
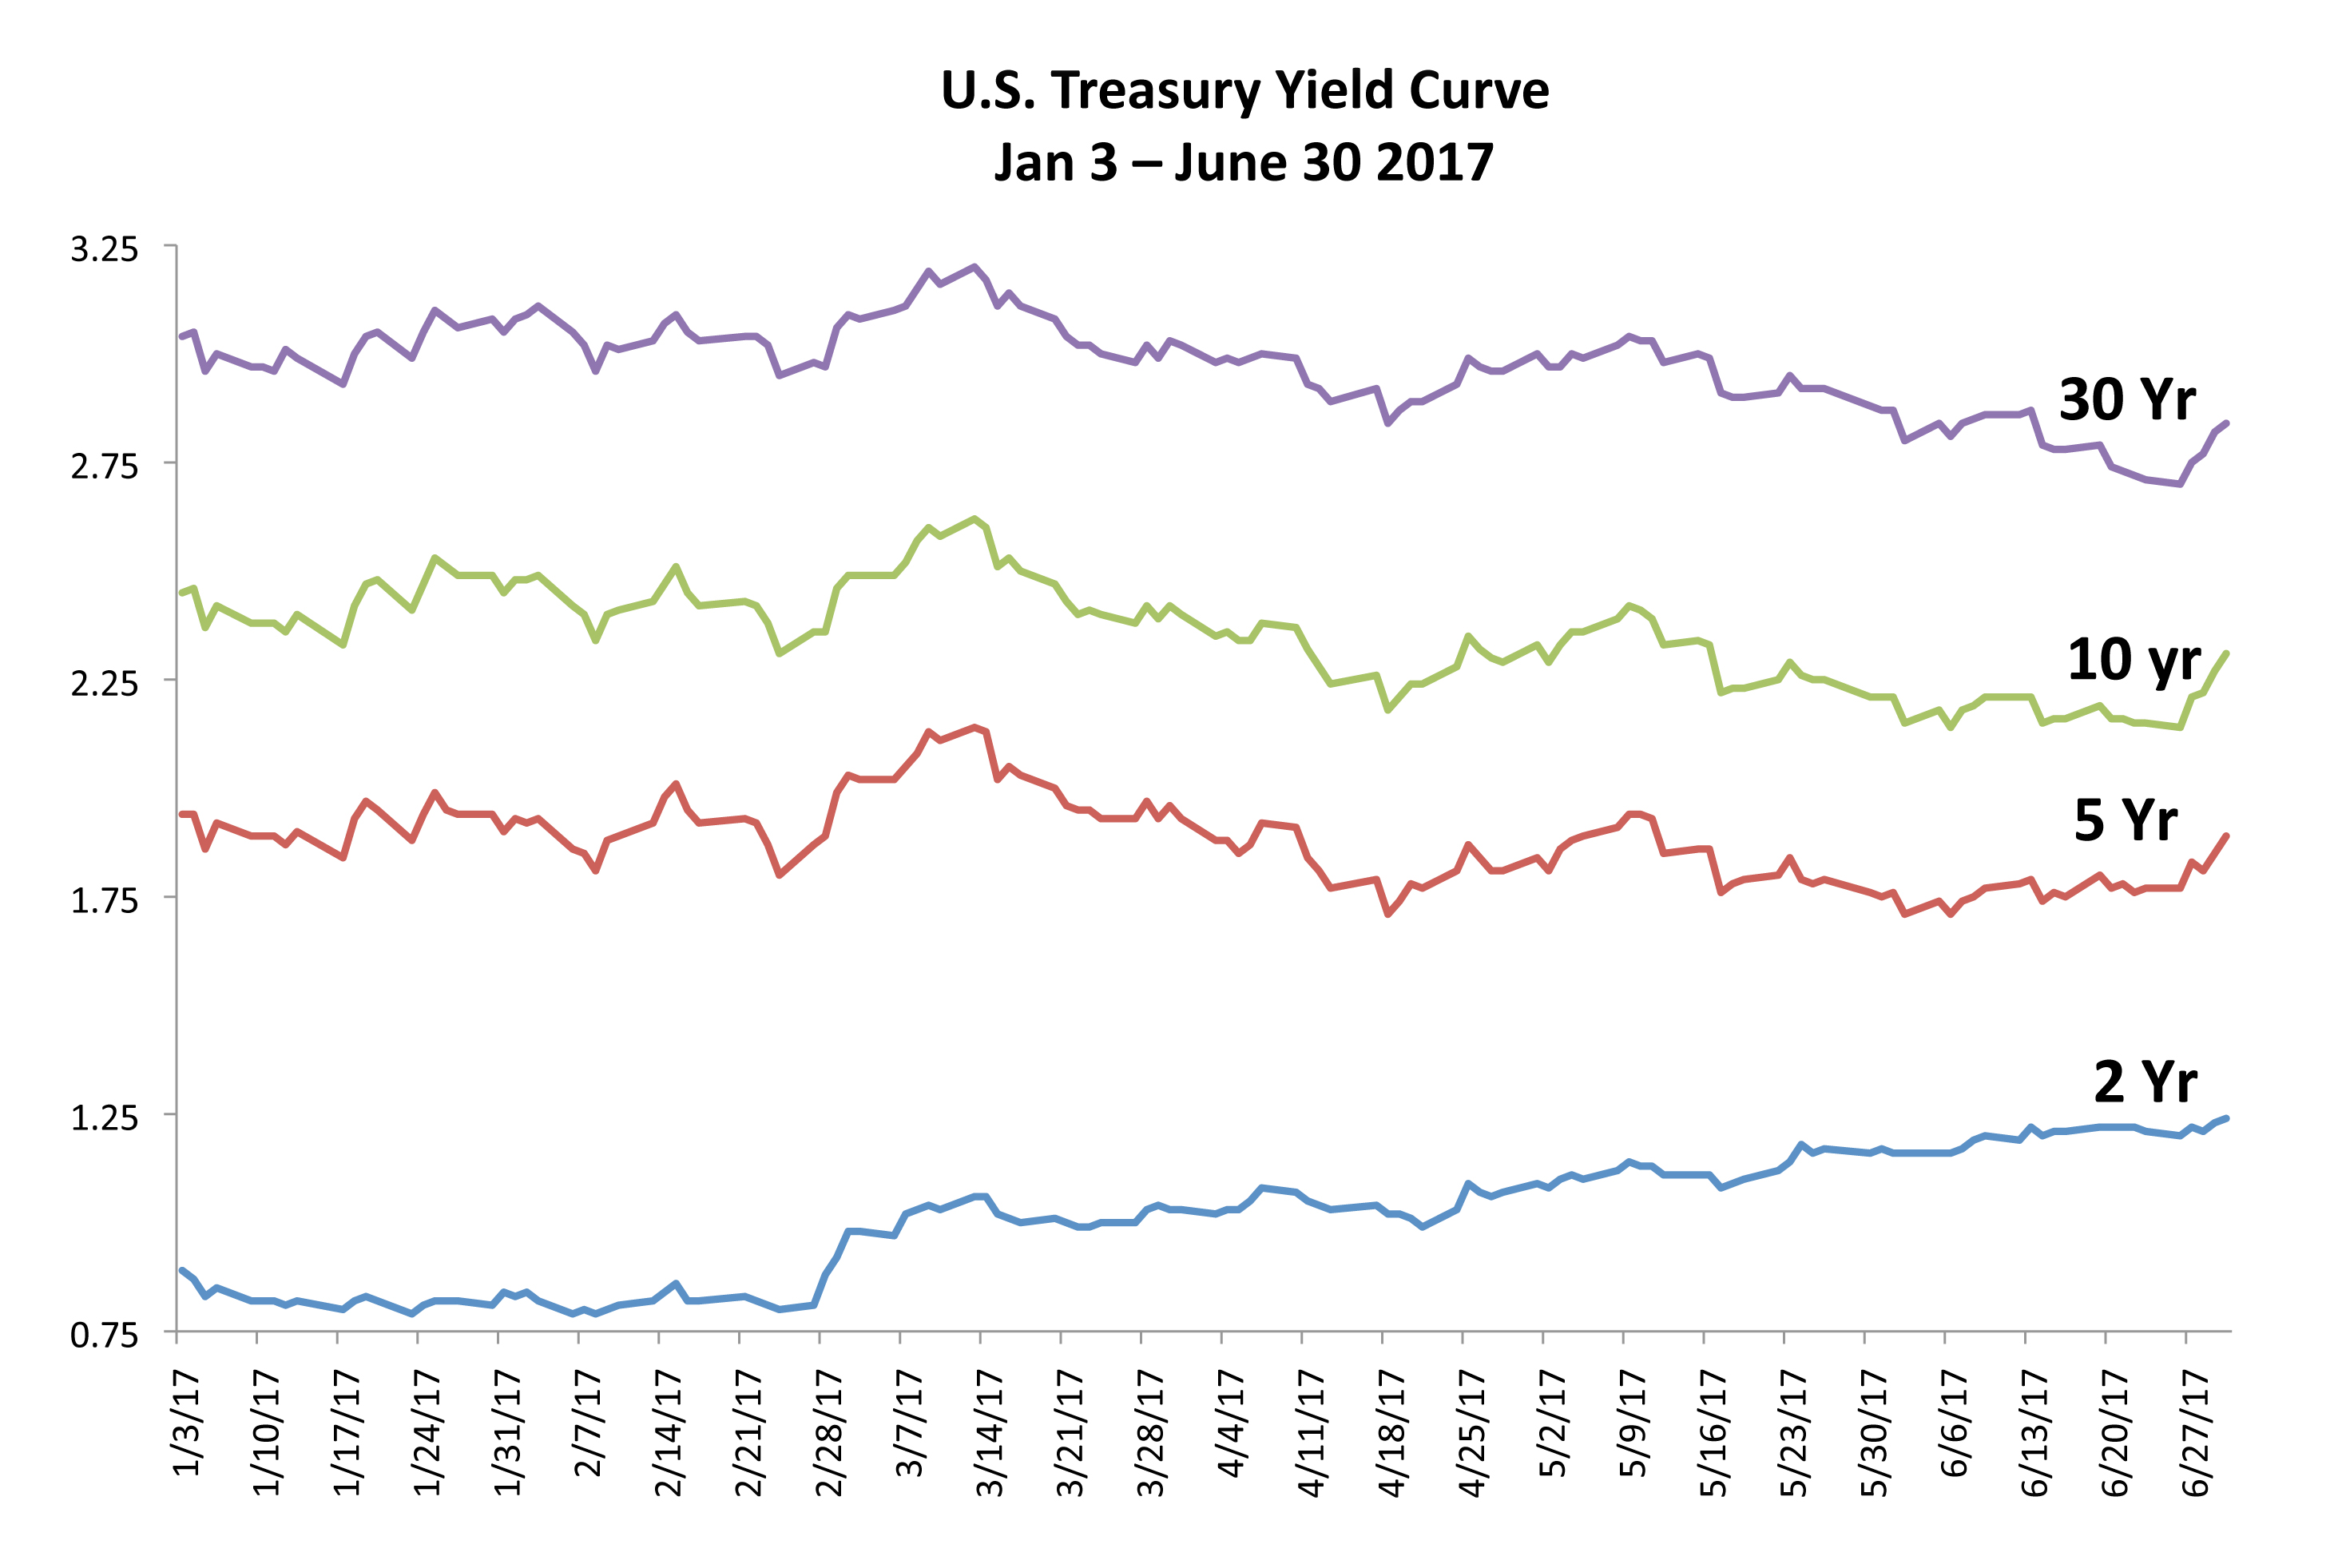
The slope of the yield curve has been flattening in recent weeks, with short-term rates rising faster than longer bond yields. This typically occurs when monetary policy is tightening. The difference between five-year Treasury notes and 30-year Treasury bonds flattened to 96 basis points in June, the narrowest since December 2007. Five-year note yields, which are highly sensitive to rate policy, rose to a four-week high of 1.80%. Thirty-year bond yields, which are largely driven by future expectations of growth and inflation, meanwhile dropped to 2.72% in mid-June, the lowest since Nov. 9. A key market dynamic are long-term bond prices that are set by the markets, while short-term rates are dictated by the Fed in the form of the Federal Funds rate.
Global government bonds sold off in late June as language from various central banks alluded to the end of monetary stimulus and a start to rate increases. In reaction, government bonds in Europe, the U.S., and Asia fell in price in anticipation of rising yields.