June 2017 Market Update

Macro Overview

International markets reacted in June as central banks throughout Europe and Asia signaled that monetary stimulus efforts were slowly being dispatched. The news propped up European currencies including the euro, pound, and Swiss franc as anticipated higher rates tend to bode well for currencies.

Central banks from around the world are slowly curtailing stimulus efforts and starting the process of normalizing global interest rates in a gradual fashion. The central banks of Canada, England, and Japan all indicated that less accommodation would be the objective going forward.

The combination of rising asset prices along with central bank tightening can be very unpredictable. Many suggest that ultra low and negative interest rates have elevated asset prices such as stocks, bonds, real estate, art and classic automobiles to unsustainable levels. As rates gradually begin to rise, it is expected to produce a gradual return to normalized asset prices worldwide.

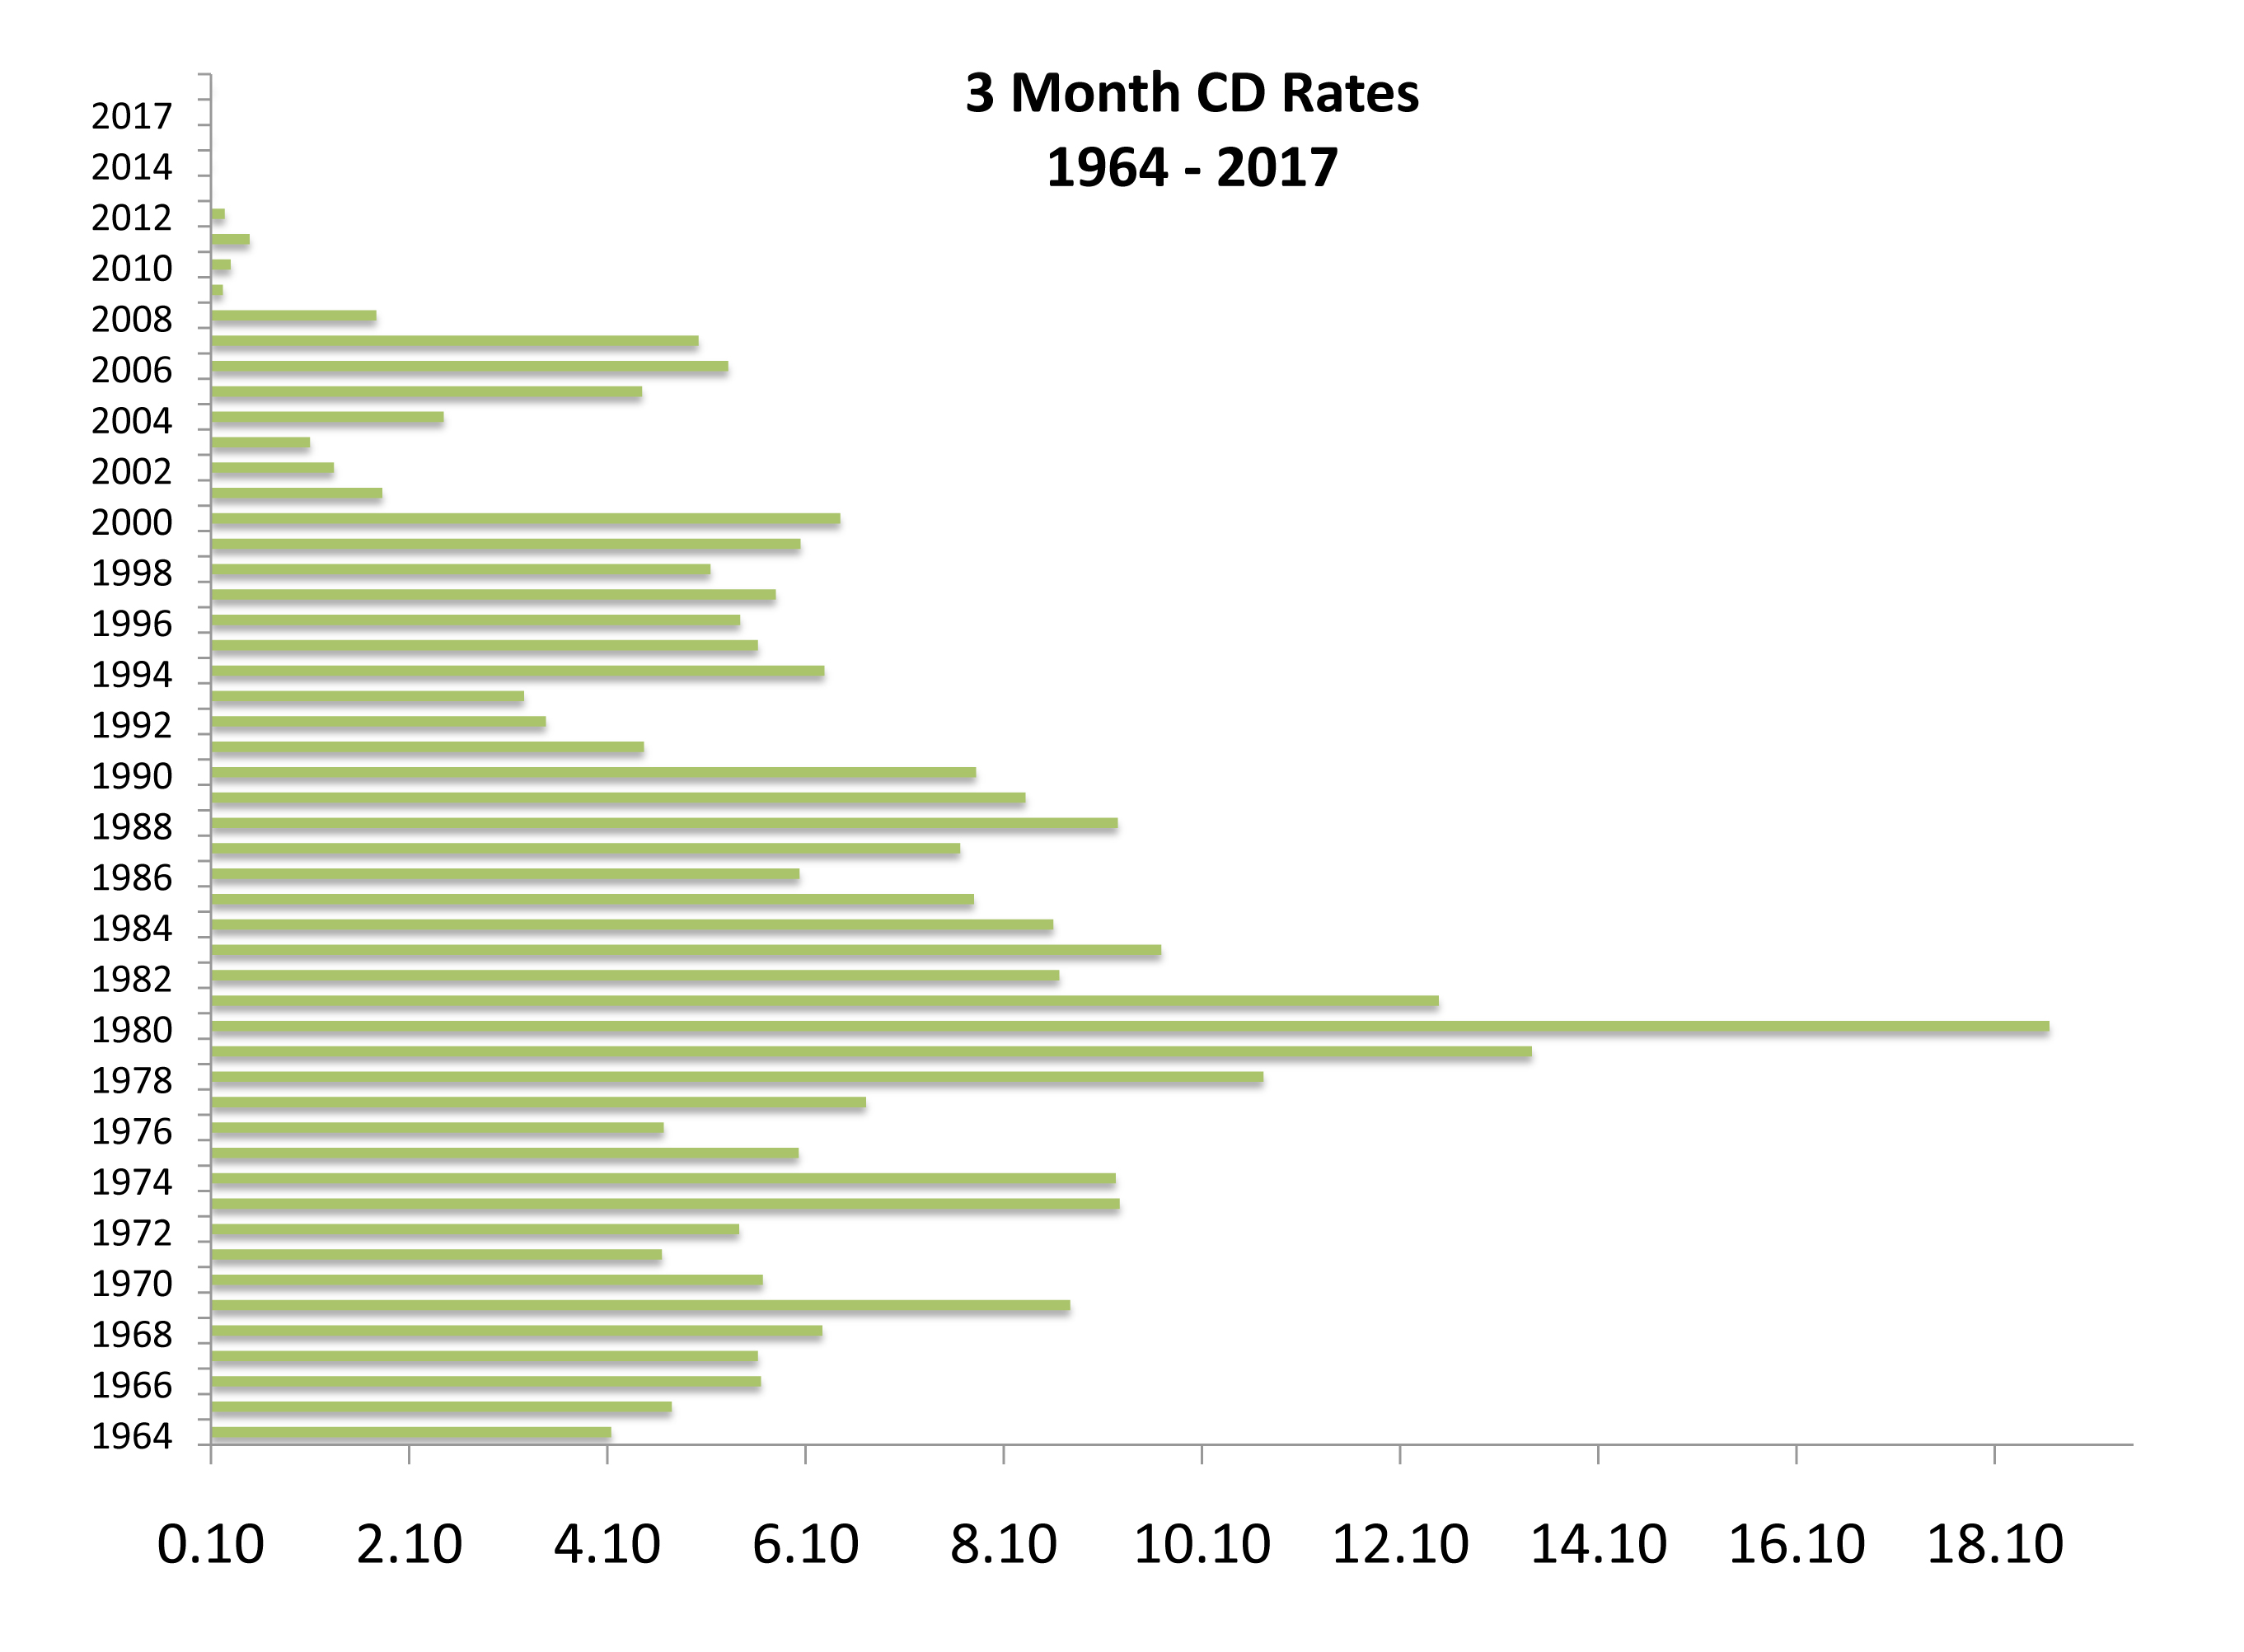
The Fed raised its key short-term rate (Fed Funds Rate) to 1.25% in June, up from 1.0%, executing its second increase this year. The Fed also mentioned that it was still on course to start unwinding its $4.5 trillion balance sheet towards the end of the year, composed of U.S. Treasuries and mortgages.

The Fed is viewed at odds with inflation expectations as it executes on gradual rate hikes with the anticipation of rising inflation. The concern is that inflation estimates by analysts as well as the Department of Commerce are muted, with expectations of minimal inflation. The longer inflation stays low, the less consumers expect rising inflation. The concern among market watchers is that the Fed continues on a rate rise venture, but with inflation proving to be less than expected. This may lead markets to react adversely as rates increase during a dismal growth environment.

The Federal Reserve released favorable results for a stress test on banks, helping propel banking and financial related stocks. The stress tests were initially created during the financial crisis of 2008/2009 in order to minimize risk to banks’ exposure to bad loans and a dire economy. For the first time ever, all banks tested passed the stress tests successfully, building confidence in the sector and future earnings prospects.

It was ten years ago this June that the beginnings of the financial crisis of 2008/2009 started, when two hedge funds managed by the defunct Bear Sterns speculated in credit derivatives and backed by sub-prime mortgage loans and then collapsed.

Sources: Fed, IMF, BLS, Dept. of Commerce

 
The Fed Sets Short Term Rates While The Market Dictates Long Term Rates

Equity Overview – Global Equity Overview

The equity markets started to experience what stock analysts call a sector rotation, when one or several sectors fall out of favor leading to funds flowing to other sectors. This past month technology stocks fell as markets perceived that the sector may have become overvalued. As this occurred, banking and financial sector stocks rose, as favorable regulatory related news lifted the overall sector.

The S&P 500 index posted its strongest first half of the year since 2013. The Dow Jones industrial average index rose 8% in the first half of 2017, its best performance since 2013, while the S&P 500 was up 8.2% the first half of 2017. The NASDAQ’s strong performance for the first six months of 2017 was predominantly led by the technology sector, its best first half since 2009.

Global equity markets had the best first annual half since 2009. Overall improving sentiment in the euro zone as well as increasing international growth prospects helped propel global markets the first half of 2017. (Sources: S&P, Reuters, Bloomberg, Dow Jones, Nasdaq)

Flat Yield Curve- Fixed Income Overview

The slope of the yield curve has been flattening in recent weeks, with short-term rates rising faster than longer-bond yields. This typically occurs when monetary policy is tightening. The difference between five-year Treasury notes and 30-year Treasury bonds flattened to 96 basis points in June, the narrowest since December 2007. Five-year note yields, which are highly sensitive to rate policy, rose to a four-week high of 1.80%. Thirty-year bond yields, which are largely driven by future expectations of growth and inflation, meanwhile dropped to 2.72% in mid-June, the lowest since Nov. 9. A key market dynamic are long-term bond prices that are set by the markets, while short-term rates are dictated by the Fed in the form of the Federal Funds rate.

Global government bonds sold off in late June as language from various central banks alluded to the end of monetary stimulus and a start to rate increases. In reaction, government bonds in Europe, the U.S., and Asia fell in price in anticipation of rising yields. (Source: U.S. Treasury, Fed, Bloomberg)

 
The Average American Sleeps 8.5 Hours Per Day

Americans Are Working More & Sleeping Less – Demographics

The Department of Labor in June released a survey, called the American Time Use Survey, on how much time Americans spend working, sleeping, and a host of other activities. Nearly 10,500 people were surveyed by the Labor Department nationwide for this latest report.

The survey found that Americans spent just over 4.5 hours each weekday working in 2016, an increase of 8 minutes from the previous year. Meanwhile, the average amount spent sleeping fell by 5 minutes from the year before, to 8.5 hours per day.

The survey results may not necessarily be representative of everyone, but for a basic government report, it does give employers and economists a rough idea of how we spend our day.

Such data may reveal that too much leisure time could be indicative of an increasing level of unemployment or even excess reserves for spending. While an increase in hours worked may be an indicator of an increasing demand for workers. (Source: Labor Department; American Time Use Survey June 2017)

Chinese Stocks Get Inducted – International Update

The European Central Bank (ECB) hinted that it might start curtailing its stimulus program as accelerating growth takes hold throughout Europe. The news drove European bond prices lower and yields higher, simultaneously lifting the euro.

China was inducted into the MSCI Emerging Markets Index, a long awaited move by Chinese companies and international investors. MSCI, a U.S. company providing key indices as benchmarks for the global markets, opted to initially include 222 Chinese companies to the index, representing 0.73% of the MSCI Emerging Markets Index. The inclusion will give large institutional investors exposure to Chinese stocks while also elevating China’s status on the global equity markets. The MSCI did refuse to add Chinese stocks to its index compilation on three prior attempts.

The results of elections in France dismissed concerns of an immediate French exit from the Euro, thus alleviating tensions in the currency markets. Concurrently, escalating tensions between foreign leaders and the U.S. have shifted some assets to less susceptible positions. (Sources: Eurostat, ECB, MSCI, Reuters)

 
Emerging Markets: Commodity Oddities

Why falling commodity prices may not be a bad sign for Emerging Markets

Falling commodity prices are a natural red flag for emerging market investors. But there are good reasons to believe the current confluence of lower commodity prices, declining inflation expectations and a softer dollar will reinforce rather than undermine the rally in EM local fixed income markets.  Without doubt, lower commodity prices are a negative terms-of-trade shock to large parts of the EM complex, representing a hit to both current and fiscal accounts. From their first-quarter peaks, iron ore and Brent crude prices are down 37% and 16%, respectively. The impact of lower commodity prices must be viewed in a broader context – notably, their effect on developed economy growth and central bank policies, the dollar, and the extent of any pre-existing EM imbalances.

According to PIMCO this has not been a typical commodity price decline and does not change their constructive view on EM local markets for several reasons:

These arguments are not to suggest that weaker commodity prices are immaterial, but simply that the current episode represents a positive supply shock to the global economy, which should serve to reinforce the extremely favorable financing climate for emerging markets. In the absence of significant external imbalances, EM currencies should continue to appreciate, reinforcing a convergence of real interest rates toward those of the developed economies.

What would change PIMCO’s positive view on EM?  Weaker growth in the U.S., Europe, Japan and China.   (Source: PIMCO’s Gene Frieda)


CD Rate History – Historical Note

Not since the days of inflation and high interest rates have Certificates of Deposits (CDs) been perceived as a viable source of income for retirees and conservative savings for working individuals.

For years, banks used CDs as primary marketing products to attract new customers and help build deposit bases. As rates fell substantially, CDs became less attractive, incentivizing banks to find other products to sell. The historically low rates of today have created CD yield wars with rates from .25% to 1.00%, rates not seen since 2002.

Contrary to what most people think, a CD isn’t as liquid as many believe. Banks restrict access to the funds until the maturity date of the investment and impose penalties for early withdrawals.

Data compiled by both the FDIC and the Federal Reserve over the decades has carefully tracked CD rates offered by banks nationwide. The average 3-month CD as of this past month has a rate of 0.91%, roughly 1/10th of a comparable 3-month CD in 1983.

The primary drawback of using CDs as an investment is that a fixed rate over a short period of time doesn’t produce the growth that stocks may produce over a long period of time. So when a 3-month CD paid 13.78% in 1979, the inflation rate of 13.3% that same year translated into earning a meager half percentage difference in real terms net of inflation. The challenge today, even with low inflation of below 2%, is that the average 3, 6, and 12-month CD rate is still below the current rate of inflation. (Source: Federal Reserve Bank of St. Louis)