Dow Jones | 34,098 |
S&P 500 | 4,169 |
Nasdaq | 12,226 |
2 Yr Treasury | 4.04% |
10 Yr Treasury | 3.44% |
10 Yr Municipal | 2.36% |
High Yield | 8.19% |
Dow Jones | 2.87% |
S&P 500 | 8.59% |
Nasdaq | 16.82% |
MSCI-EAFE | 10.28% |
MSCI-Europe | 13.87% |
MSCI-Pacific | 3.86% |
MSCI-Emg Mkt | 2.16% |
US Agg Bond | 3.59% |
US Corp Bond | 4.29% |
US Gov’t Bond | 3.82% |
Gold | 1,999 |
Silver | 25.33 |
Oil (WTI) | 76.63 |
Dollar / Euro | 1.10 |
Dollar / Pound | 1.24 |
Yen / Dollar | 133.79 |
Canadian /Dollar | 0.73 |
Macro Overview
International markets reacted in June as central banks throughout Europe and Asia signaled that monetary stimulus efforts were slowly being dispatched. The news propped up European currencies including the euro, pound, and Swiss franc as anticipated higher rates tend to bode well for currencies.
Central banks from around the world are slowly curtailing stimulus efforts and starting the process of normalizing global interest rates in a gradual fashion. The central banks of Canada, England, and Japan all indicated that less accommodation would be the objective going forward.
The combination of rising asset prices along with central bank tightening can be very unpredictable. Many suggest that ultra low and negative interest rates have elevated asset prices such as stocks, bonds, real estate, art and classic automobiles to unsustainable levels. As rates gradually begin to rise, it is expected to produce a gradual return to normalized asset prices worldwide.
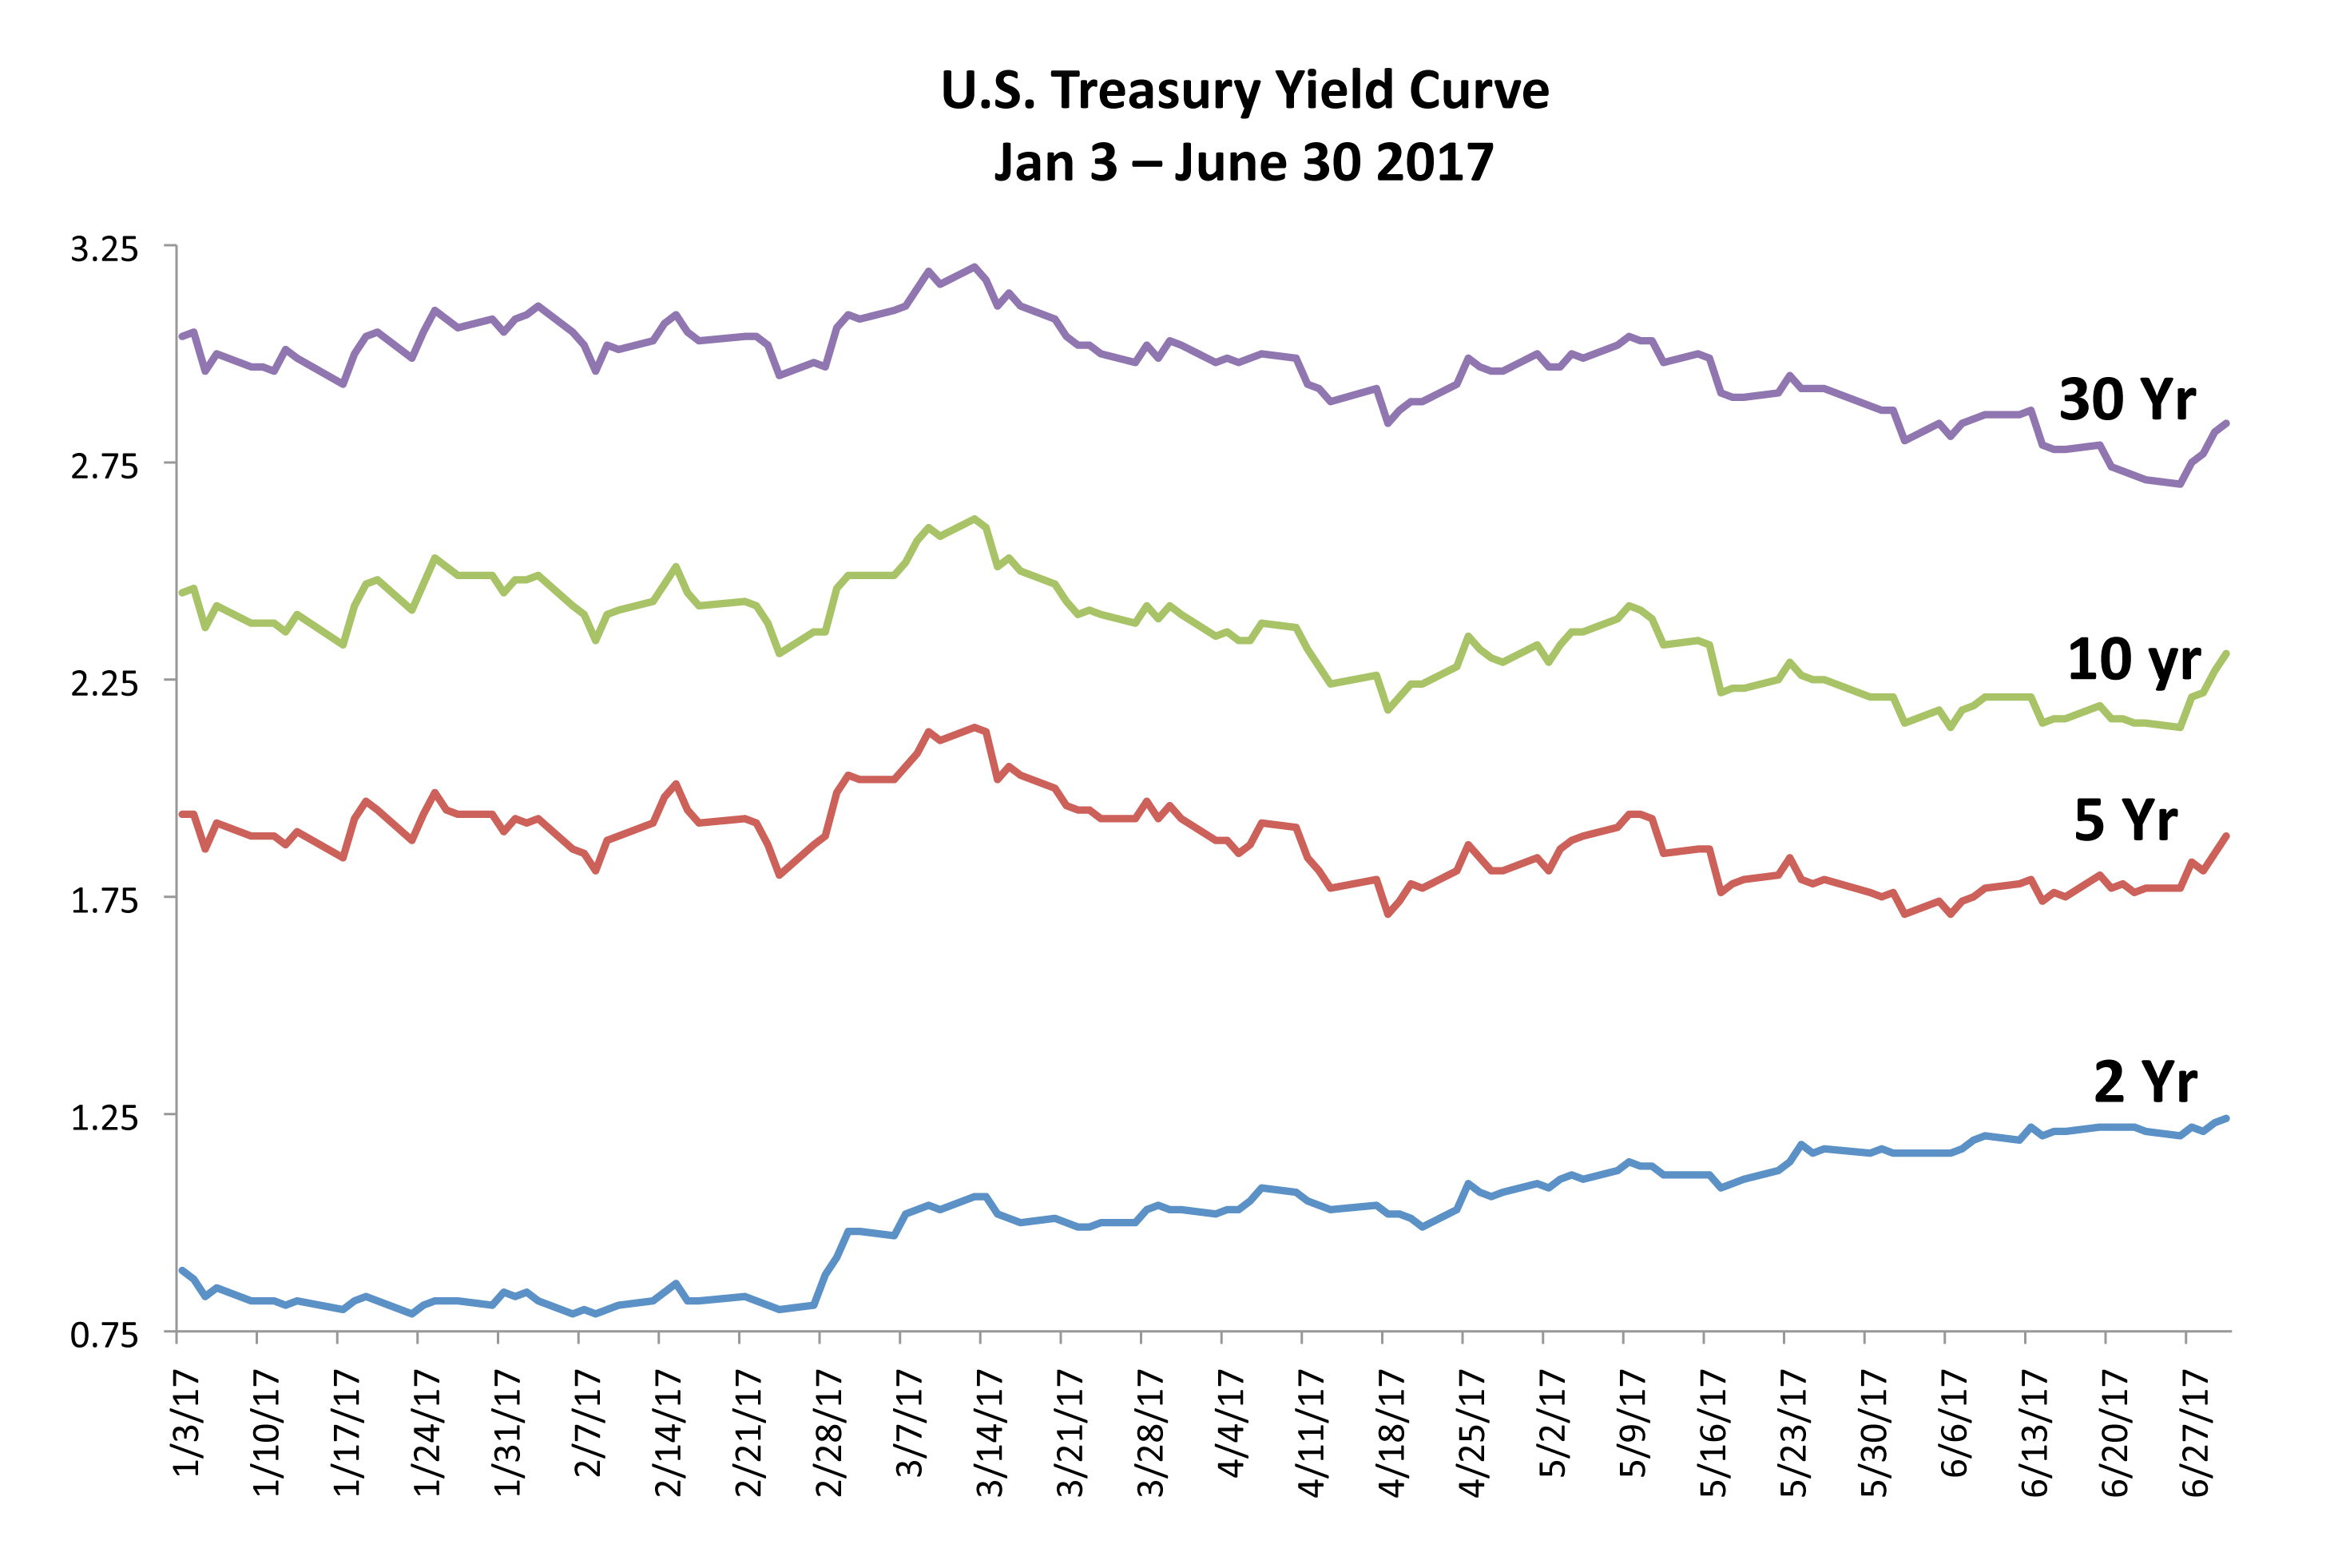
The Fed raised its key short-term rate (Fed Funds Rate) to 1.25% in June, up from 1.0%, executing its second increase this year. The Fed also mentioned that it was still on course to start unwinding its $4.5 trillion balance sheet towards the end of the year, composed of U.S. Treasuries and mortgages.
The Fed is viewed at odds with inflation expectations as it executes on gradual rate hikes with the anticipation of rising inflation. The concern is that inflation estimates by analysts as well as the Department of Commerce are muted, with expectations of minimal inflation. The longer inflation stays low, the less consumers expect rising inflation. The concern among market watchers is that the Fed continues on a rate rise venture, but with inflation proving to be less than expected. This may lead markets to react adversely as rates increase during a dismal growth environment.
The Federal Reserve released favorable results for a stress test on banks, helping propel banking and financial related stocks. The stress tests were initially created during the financial crisis of 2008/2009 in order to minimize risk to banks’ exposure to bad loans and a dire economy. For the first time ever, all banks tested passed the stress tests successfully, building confidence in the sector and future earnings prospects.
It was ten years ago this June that the beginnings of the financial crisis of 2008/2009 started, when two hedge funds managed by the defunct Bear Sterns speculated in credit derivatives and backed by sub-prime mortgage loans and then collapsed.
Sources: Fed, IMF, BLS, Dept. of Commerce
Equity Overview – Global Equity Overview
The equity markets started to experience what stock analysts call a sector rotation, when one or several sectors fall out of favor leading to funds flowing to other sectors. This past month technology stocks fell as markets perceived that the sector may have become overvalued. As this occurred, banking and financial sector stocks rose, as favorable regulatory related news lifted the overall sector.
The S&P 500 index posted its strongest first half of the year since 2013. The Dow Jones industrial average index rose 8% in the first half of 2017, it’s best performance since 2013, while the S&P 500 was up 8.2% the first half of 2017. The NASDAQ’s strong performance for the first six months of 2017 was predominantly led by the technology sector, its best first half since 2009.
Global equity markets had the best first annual half since 2009. Overall improving sentiment in the euro zone as well as increasing international growth prospects helped propel global markets the first half of 2017. (Sources: S&P, Reuters, Bloomberg, Dow Jones, Nasdaq)
Flat Yield Curve- Fixed Income Overview
The slope of the yield curve has been flattening in recent weeks, with short-term rates rising faster than longer-bond yields. This typically occurs when monetary policy is tightening. The difference between five-year Treasury notes and 30-year Treasury bonds flattened to 96 basis points in June, the narrowest since December 2007. Five-year note yields, which are highly sensitive to rate policy, rose to a four-week high of 1.80%. Thirty-year bond yields, which are largely driven by future expectations of growth and inflation, meanwhile dropped to 2.72% in mid-June, the lowest since Nov. 9. A key market dynamic are long-term bond prices that are set by the markets, while short-term rates are dictated by the Fed in the form of the Federal Funds rate.
Global government bonds sold off in late June as language from various central banks alluded to the end of monetary stimulus and a start to rate increases. In reaction, government bonds in Europe, the U.S., and Asia fell in price in anticipation of rising yields. (Source: U.S. Treasury, Fed, Bloomberg)
Americans Are Working More & Sleeping Less – Demographics
The Department of Labor in June released a survey, called the American Time Use Survey, on how much time Americans spend working, sleeping, and a host of other activities. Nearly 10,500 people were surveyed by the Labor Department nationwide for this latest report.
The survey found that Americans spent just over 4.5 hours each weekday working in 2016, an increase of 8 minutes from the previous year. Meanwhile, the average amount spent sleeping fell by 5 minutes from the year before, to 8.5 hours per day.
The survey results may not necessarily be representative of everyone, but for a basic government report, it does give employers and economists a rough idea of how we spend our day.
Such data may reveal that too much leisure time could be indicative of an increasing level of unemployment or even excess reserves for spending. While an increase in hours worked may be an indicator of an increasing demand for workers. (Source: Labor Department; American Time Use Survey June 2017)
Chinese Stocks Get Inducted – International Update
The European Central Bank (ECB) hinted that it might start curtailing its stimulus program as accelerating growth takes hold throughout Europe. The news drove European bond prices lower and yields higher, simultaneously lifting the euro.
China was inducted into the MSCI Emerging Markets Index, a long awaited move by Chinese companies and international investors. MSCI, a U.S. company providing key indices as benchmarks for the global markets, opted to initially include 222 Chinese companies to the index, representing 0.73% of the MSCI Emerging Markets Index. The inclusion will give large institutional investors exposure to Chinese stocks while also elevating China’s status on the global equity markets. The MSCI did refuse to add Chinese stocks to its index compilation on three prior attempts.
The results of elections in France dismissed concerns of an immediate French exit from the Euro, thus alleviating tensions in the currency markets. Concurrently, escalating tensions between foreign leaders and the U.S. have shifted some assets to less susceptible positions. (Sources: Eurostat, ECB, MSCI, Reuters)
CD Rate History – Historical Note
Not since the days of inflation and high interest rates have Certificates of Deposits (CDs) been perceived as a viable source of income for retirees and conservative savings for working individuals.
For years, banks used CDs as primary marketing products to attract new customers and help build deposit bases. As rates fell substantially, CDs became less attractive, incentivizing banks to find other products to sell. The historically low rates of today have created CD yield wars with rates from .25% to 1.00%, rates not seen since 2002.
Contrary to what most people think, a CD isn’t as liquid as many believe. Banks restrict access to the funds until the maturity date of the investment and impose penalties for early withdrawals.
Data compiled by both the FDIC and the Federal Reserve over the decades has carefully tracked CD rates offered by banks nationwide. The average 3-month CD as of this past month has a rate of 0.91%, roughly 1/10th of a comparable 3-month CD in 1983.
The primary drawback of using CDs as an investment is that a fixed rate over a short period of time doesn’t produce the growth that stocks may produce over a long period of time. So when a 3-month CD paid 13.78% in 1979, the inflation rate of 13.3% that same year translated into earning a meager half percentage difference in real terms net of inflation. The challenge today, even with low inflation of below 2%, is that the average 3, 6, and 12-month CD rate is still below the current rate of inflation. (Source: Federal Reserve Bank of St. Louis)
How Dodd Frank Rules Affect Consumers – Regulatory Reform
The highly contested regulations imposed by the Dodd–Frank Wall Street Reform and Consumer Protection Act, commonly referred to as Dodd Frank, came under additional scrutiny when House lawmakers passed a bill to start unwinding portions of the act. The passage of the Financial Choice Act on June 8th, aims to eliminate various rules that many believe have been constraining lending and financial progress in the banking and financial sector. Known as regulations to curtail certain Wall Street activities, Dodd Frank is perceived to have hindered lending and mortgage loans since its inception following the financial crisis of 2008/2009. Another component of the original act, the Consumer Financial Protection Bureau has been greatly criticized since its enactment. Opponents to the bureau argue that it has an unaccountable process that limits the choice consumers have rather than expanding their options.(Source: Congress.gov; H.R.10 – Financial CHOICE Act of 2017)
Have you ever wondered what stock market professionals and equity analysts talk about in their spare time? Recently, the Bloomberg website featured a debate about something that is getting a lot of attention recently: the historically high, and still-rising U.S. stock market valuations. People have been willing to pay more, and more, and more for a dollar of corporate earnings. What does that mean about future returns?
Let’s look over the shoulders and see how two professionals approach the question of how to look at today’s markets.
Bloomberg Gadfly columnist Nir Kaissar starts by noting that the Standard & Poor’s 500 Index has beaten both the MSCI EAFE Index — a collection of developed market stocks outside the U.S. — and the MSCI Emerging Markets Index by 6 percentage points a year since March 2009, when the market hit bottom, through May, including dividends. Whether you measure market prices by price-to-earnings ratio, price-to-book or price-to-cash flow, U.S. stocks are now more expensive than their foreign counterparts.
To Kaissar, that suggests that investors should consider moving at least some of their money out of American companies and into companies domiciled elsewhere.
Bloomberg View columnist Barry Ritholtz countered that valuation is largely driven by psychology. We are experiencing a bull market in American stocks, which can be defined (in psychological terms) as a period when investors become willing to pay more and more for a dollar of earnings. Eventually this will turn around, and the regional performance gap between the U.S. and Europe will reverse.
But for Ritholtz, the important issue is timing. You could have used Kaissar’s argument four or five years ago, gotten out of U.S. equities, and you would have missed a nice runup while foreign stocks were going nowhere. Is it possible that the same will be true over the next few years? (Hint: it is definitely possible.)
Kaissar responded with a definition of risk vs. valuations—the idea that investors are generally willing to pay more for less risky stocks. So can we make an argument that the S&P 500—with a price-to-book ratio about twice as high as the EAFE basket of stocks—is half as risky as stocks trading in the rest of the world? He doesn’t think so, and the conclusion is that American stocks are mispriced.
Ritholtz says that rather than trying to time which part of the world is going to do better or worse, it’s better to own it all. Instead of U.S. stocks vs. world stocks, own a portfolio that includes all of them in proportion.
Aha! says Kaissar. U.S. investors commonly allocate 70 percent to 80 percent of their stocks to the U.S., even though U.S. stocks represent only 50 percent of global market capitalization. He says that if you believe in true diversification, it would make more sense to create portfolios with a U.S. stock allocation that’s closer to 45 percent, tilting slightly toward the global stocks that are currently trading on sale.
Ritholtz makes a final argument, saying that sometimes cheap stocks get cheaper and continue to fall; other times expensive stocks get more expensive and keep going up. He doesn’t want to abandon U.S. equities, but he finds common ground with Kaissar when he recommends that people with U.S.-heavy portfolios consider diversifying into MSCI EAFE and MSCI EM indexes—not for timing purposes, but because it’s prudent diversification. You can see exactly how boring the cocktail conversations of stock analysts can be by viewing the entire discussion here: https://www.bloomberg.com/view/articles/2017-06-26/how-to-know-when-stocks-are-properly-valued-a-debate#596235f3a911d
If you’re like most people, you carefully put off doing something fun—like taking a trip or treating yourself—until you finished your work. Of course, for most people, the work never ends, and the fun gets put off over and over and over again.
The hidden assumption behind putting off fun is that you won’t enjoy it if you have uncompleted work on your desk. But what if research showed that when you put fun ahead of work on your priority list, it is at least as much fun as it would have been in the unlikely case of your finally getting everything cleared off your desk? Is it possible that you’ve been deferring gratitude for no reason?
Several experiments suggest that this might actually be the case. In one, working adults were given two assignments: a strenuous battery of cognitive tests and a fun iPad game that involved creating and listening to music. Some were assigned the cognitive tests first, others started with the iPad game, and they were asked beforehand how much fun they expected to have.
The beforehand responses suggested exactly what you would think: people in the “play first” category predicted lower enjoyment ratings than participants in the “play after” group. But when asked the same question after they had completed both activities, the participants reported equally high enjoyment, regardless of the order. Play first participants enjoyed themselves just fine.
Beach, cruise, clothing
In a followup study, some University of Chicago students were given massages before their midterm exams, and some once their exams were finished. Both groups were asked to rate their expectations before and their actual experience after. Nearly all students thought they’d be too stressed to enjoy the massages if they received them before the exams, but afterwards there was no difference between those who received the massages before and after the demanding tests. While the students assumed they would be highly distracted if they received a massage before midterms (they predicted exams would dominate nearly 40% of their attention at the spa), this didn’t actually happen. In reality, the students thought about midterms less than 20% of the time. They mostly just enjoyed themselves.
American workers work longer hours and take fewer vacations than anyone in the industrialized world. Most of them are unhappy with work-life balance, leave paid vacation days on the table, and wish they could find more time for fun. But these studies, and others, suggest that leisure improves our work. People often work better and are more satisfied with their jobs after returning from restful breaks. We may keep postponing doing something fun for “the right time,” only to realize that it never seems to come.
Having fun may seem like hard work. It’s not. You could wait for a “right time” to enjoy something or just enjoy it now. The point is, you’ll enjoy it either way.
Chances are, the market barometer you most often hear about is the Dow Jones Industrial Average. Every evening, the Dow’s ups or downs are soberly reported as if they reflect something important.
They don’t.
A recent online article noted that the 137-year-old index only reflects the performance of 30 U.S. multinational companies, and it doesn’t even reflect their average performance. The companies with higher share prices count more in the performance numbers, so that when a company’s stock enjoys a price surge, it makes up a bigger part of the index.
This can make for some interesting differences between actual market performance and underlying valuation. The Goldman Sachs brokerage firm recently reported a $224.41 share price, which accounted for 1,537 of the Dow’s total points. By comparison, General Electric, which has a $146 billion larger market cap, only accounted for 185 Dow points with its $27.02 share price.
With only 30 stocks, the Dow doesn’t come close to representing the U.S. business market. Based on its closing price on June 29, the total market capitalization of the companies in the index was about $6.37 trillion, compared with $21.8 trillion for the stocks that make up the S&P 500. The Dow has no representation in the utilities and real estate sectors. The Dow doesn’t include Alphabet (parent company of Google) or Amazon.com, Facebook, Berkshire Hathaway or Alibaba Group. With the S&P 500 you get a more realistic look at what’s happening across the entire spectrum of the U.S. marketplace.
In terms of how it reflects the market, the Dow was an extremely important index in the days of the rotary phone. In today’s digital age, it has become a historic novelty. It’s time to proclaim the S&P 500 as the market barometer for larger American companies.
Source:http://www.businessinsider.com/its-time-for-wall-street-to-dump-the-dow-2017-7