Third Quarter 2019
Market Update
(all values as of 04.30.2024)

Stock Indices:

Dow Jones 37,815
S&P 500 5,035
Nasdaq 15,657

Bond Sector Yields:

2 Yr Treasury 5.04%
10 Yr Treasury 4.69%
10 Yr Municipal 2.80%
High Yield 7.99%

YTD Market Returns:

Dow Jones 0.34%
S&P 500 5.57%
Nasdaq 4.31%
MSCI-EAFE 1.98%
MSCI-Europe 2.05%
MSCI-Pacific 1.82%
MSCI-Emg Mkt 2.17%
 
US Agg Bond 0.50%
US Corp Bond 0.56%
US Gov’t Bond 0.48%

Commodity Prices:

Gold 2,297
Silver 26.58
Oil (WTI) 81.13

Currencies:

Dollar / Euro 1.07
Dollar / Pound 1.25
Yen / Dollar 156.66
Canadian /Dollar 0.79
 

Macro Overview

Stocks and bonds rose in unison in June as lower rates drove equities higher while also buoying bond prices. Recent indications by the Fed and the bond market that there may be a rate cut as soon as the end of July helped sustain stock prices near all-time highs.

On the forefront of global concerns was the June 28-29 G20 summit in Japan where trade tensions between the U.S. and China were discussed between President Trump and Chinese President Xi Jinping. Fortunately, the U.S. and China reached a temporary ceasefire for additional tariffs and agreed to re-start negotiations that had fallen apart and roiled the markets in May, and stocks rallied into the end of the first half of 2019.

The 10-year U.S. Treasury bond yield finished June at 2.00%, down from 2.68% to start the year. Yields dropped lower in Europe with Austria notably issuing 100-year government bonds with a yield of 1.17%. Highly rated, positive yielding government bonds are in enormous demand globally as investors seek reliable income and relative safety, so several bond analysts expect the 10-year U.S. Treasury it to fall below the psychological 2.00% level.

Mortgage rates continued to fall in June and ended the month at 3.73% on a 30-year fixed conforming loan, helping to spur mortgage applications. Despite lower rates, home price growth as measured by the latest S&P Case-Shiller Home Price 20-city composite index slowed to 2.5% in April and is the flattest growth since August 2012.

Commodity prices including oil, gold, and iron ore all rose in the first half of 2019, with much of the gains occurring in June. Cold and wet weather across the Midwest also pushed grain prices higher as many American farmers have been unable to plant their corn, soy, and wheat crops.

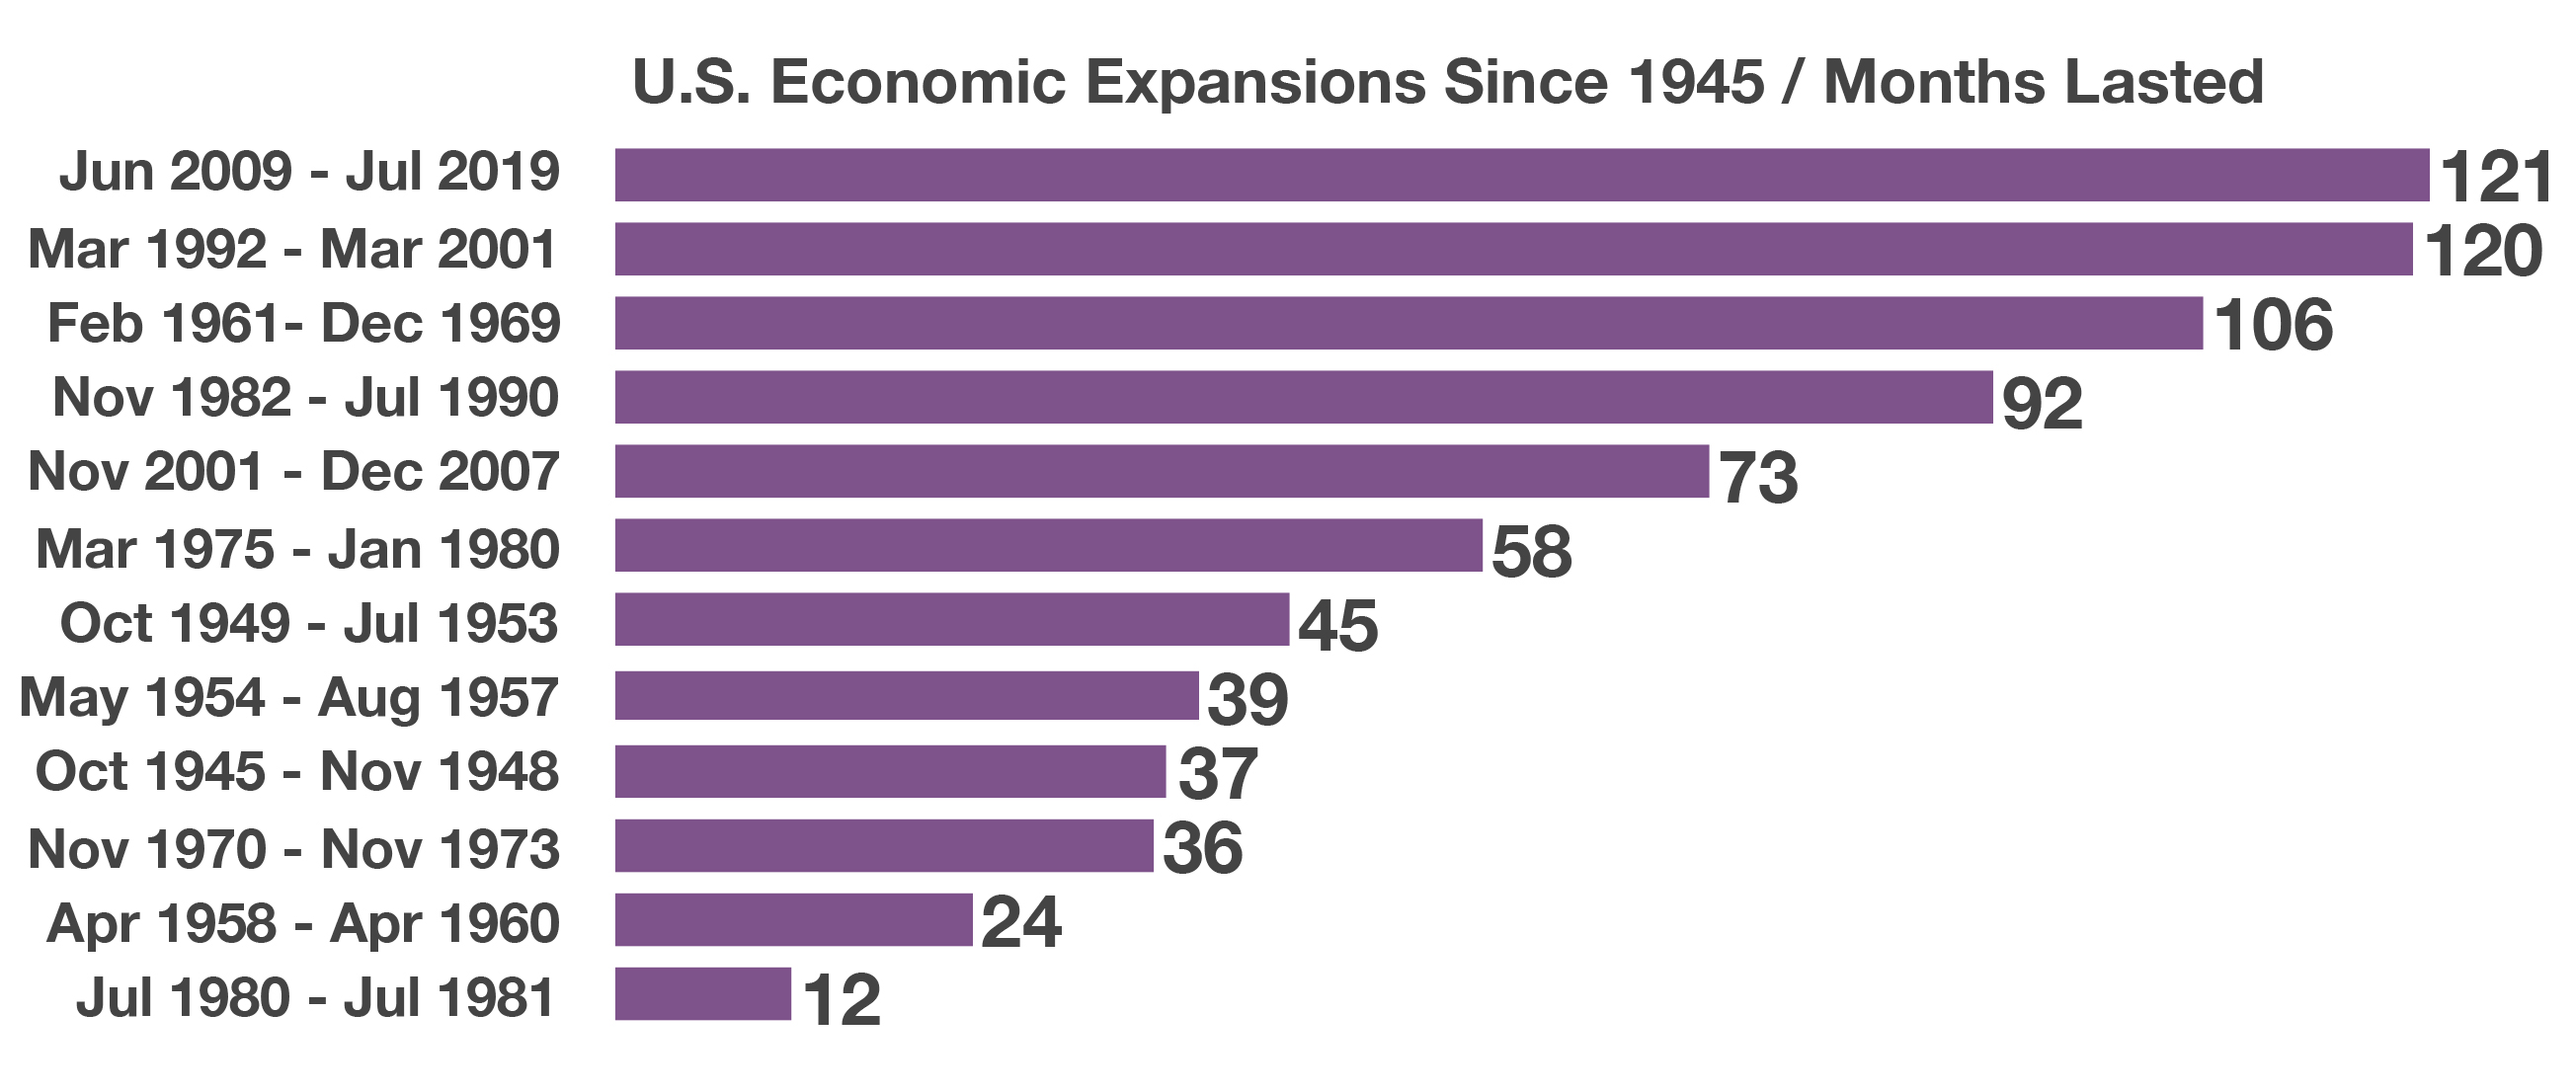
The U.S. Bureau of Economic Analysis found that the current economic expansion is now the longest on record since 1945. Since 1945 with the end of World War II, there have been 12 economic expansion periods and the general trend seems to be longer business cycles as the U.S. economy continues to structurally shift away from being more industrial and manufacturing based to more dependent on consumer spending which is now approximately two-thirds of U.S. GDP. (Sources: BEA, Freddie Mac, U.S.Treasury, g20.org, Bloomberg, Federal Reserve)

 
The 10-year Treasury bond dropped below 2% for the first time since November 2016

Stocks Rebound In June – Equity Overview

Stocks registered their best first half to a calendar year since 1997 with the Dow Jones Industrial Index, S&P 500 Index, and the Nasdaq all at or near all-time highs. The gains were led by the technology and consumer discretionary sectors, while health care and energy were the biggest laggards.

After the S&P 500 fell approximately 6.5% in May, equities rebounded in June due to a respite in U.S.-Chinese trade tensions coupled with surging expectations that the Fed will eventually cut interest rates as soon as July 31. Historically, a low-rate environment is very favorable for equities, as interest bearing alternatives become less attractive.

In addition to interest rate expectations, the Federal Reserve also gave many U.S. banks the approval to repurchase their own shares and lift dividends, part of the Comprehensive Capital Analysis and Review (CCAR) process set in place by the Fed. Large money center banks as well as smaller regional banks were restricted from buying back their own shares as well as increasing dividends in order to fortify bank balance sheets following the financial crisis. (Sources: Federal Reserve, Dow Jones, S&P, Bloomberg, Reuters)

What Expenses Seniors Have After Retirement – Consumer Demographics

Demographics play a significant role in how much we spend and where.  Spending is significantly dictated by age because different needs and life essentials evolve as consumers grow older. The challenge for many retirees now is the fact that we are all living longer, with U.S. life expectancy of 78.7 years as of 2018. As more Americans reach their 80s and 90s, medical and assisted living expenses become a much larger component of overall consumer spending. Housing, transportation and food are the three largest expenses incurred by all age groups. As consumers move from their late 20s into their 30s, we earn more money and families start to grow. Expenditures on transportation, health care and entertainment become more prevalent as households grow with children. Education is also another significant expense for many younger families, where the average cost of higher education has steadily increased over the years.

As we earn more, we also tend to save more in our 30s, 40s, and 50s by contributing to 401k plans and other retirement saving vehicles. At 70.5 years of age, Required Minimum Distributions (RMDs) kick in, imposing a tax on retirement savings, which reduces as withdrawals increase and beneficiaries age. The biggest challenge most retirees have is trying to replace lost employment income with retirement savings and Social Security. A widely accepted rule of thumb is that one will need to replace anywhere from 70% to 90% of the income earned while employed, in order to maintain the same standard of living after retirement.

The Bureau of Labor Statistics has identified the largest expenses that seniors have once in retirement. The BLS expense data including housing, food, and transportation are based on what a retiree spends on average in various essential categories nationwide. Housing, transportation and health care are the three largest expenses for retirees as well as all other age groups. (Sources: Social Security Admin., U.S. Census)

 
a record 257 million Americans will travel by plane this summer

The Country’s Busiest Airports – Travel & Leisure

It is expected that a record 257 million Americans will travel by plane this summer. The summer months tend to see the heaviest demand from airline passengers across the country and as a result, the season is traditionally the most profitable for airlines as flight capacity utilization rates peak.

As business and leisure travel have been increasing both domestically and internationally, U.S. airports have seen a steady increase in passengers. Most major U.S. airports serve as international hubs with flights originating in foreign countries worldwide and landing there directly from overseas. 
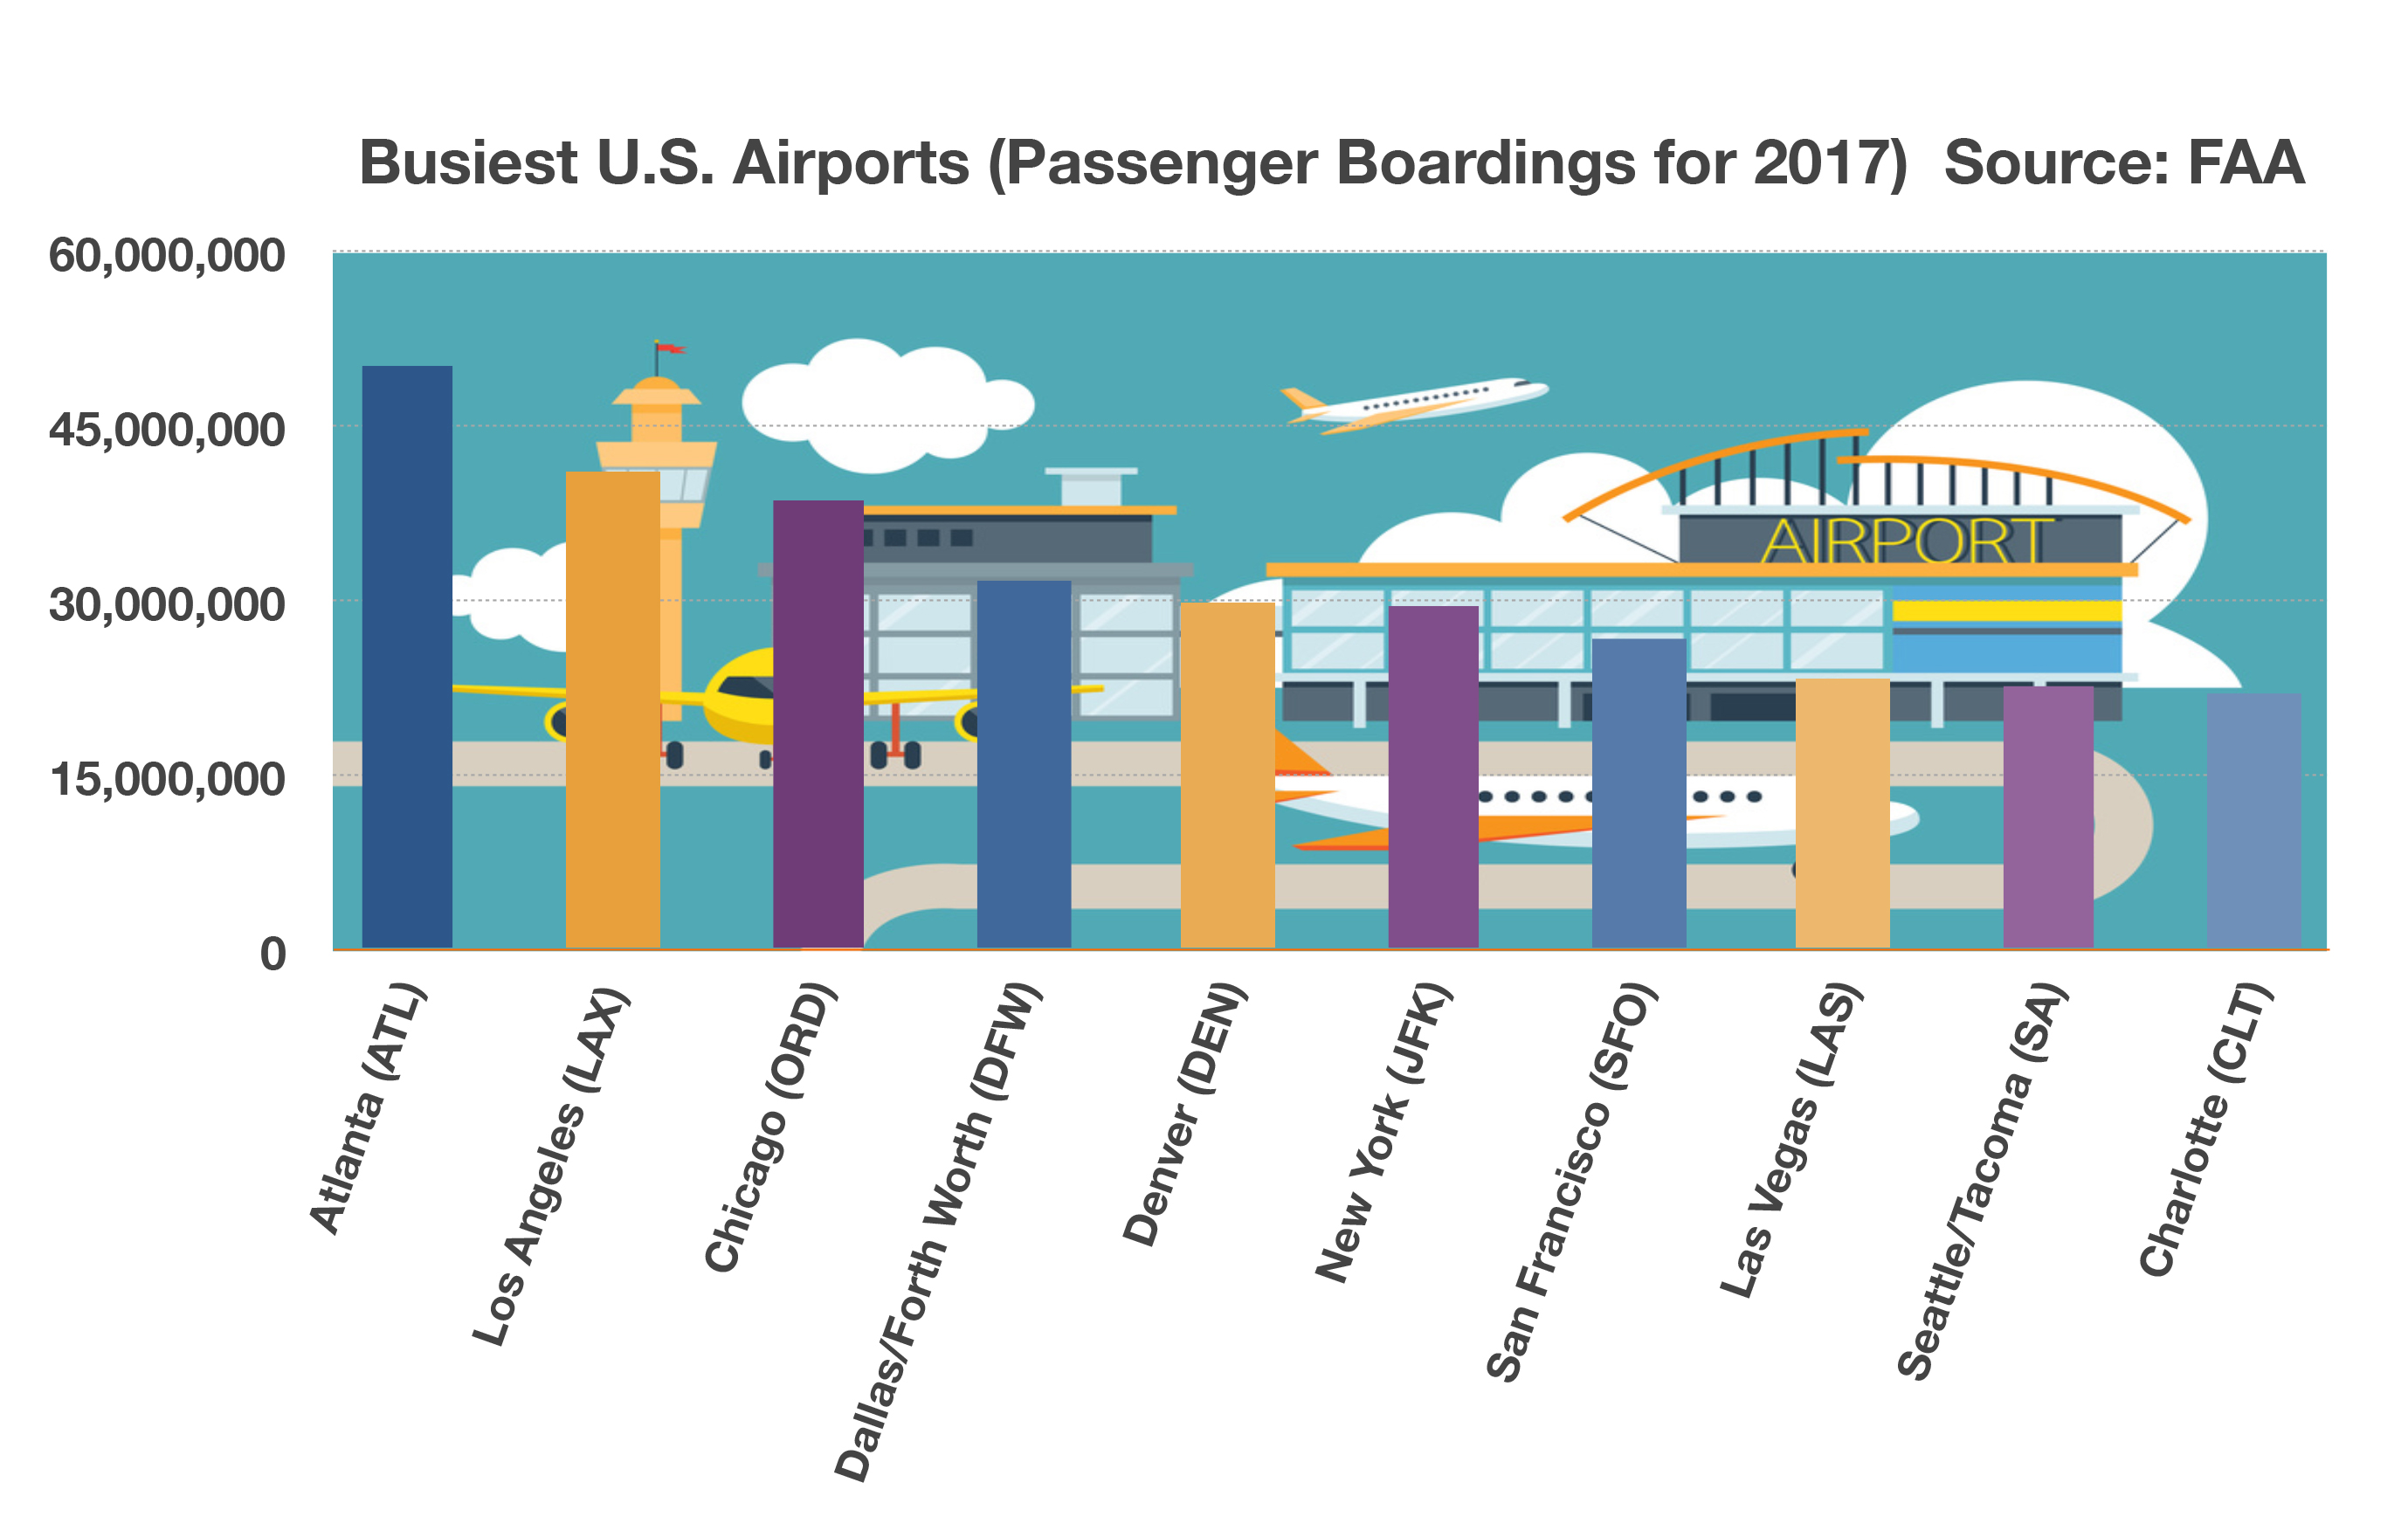
With some of the most popular travel destinations in the world, American airports cater to a host of tourists. Not only is the Atlanta International Airport the busiest airport in the country, it is also the busiest passenger airport in the world, with Beijing a close second. Atlanta is also geographically attractive, located only a two-hour flight away from 80 percent of the U.S. population.

Various factors affect the accessibility of airports and how much traffic they generate. Denver International Airport is located in an extremely rural area of Denver, allowing vast amounts of rail and road access to the airport. Chicago’s O’Hare and New York’s JKF are both situated directly within the city and accessible by millions of visitors.

As a direct result of the aforementioned increase in passenger volumes, major airports ranging from New York’s Kennedy to Los Angeles’ LAX have been inundated with traffic and have required expansion projects. A shortage of air traffic controllers and aircraft maintenance staff have also been major bottlenecks for airlines and airports this year. (Sources: Dept. of Transportation, FAA)

Yields Drop Further In June – Fixed Income Update

The 10-year U.S. Treasury bond yield dropped below 2% for the first time since November 2016. The 10-year U.S. Treasury continues to trade at a lower yield than the 3-month Treasury bill, signaling a rather unusual phenomenon known as yield inversion, which is when short-term maturity bonds yield more than longer term bonds. The Federal Reserve has consistently communicated its confidence with the labor market and rising wages for lower paid workers as positive for the U.S. economy, but has noted that inflation is still muted and below the Fed’s inflation target. The Fed has increasingly become concerned with slowing global growth dragging down U.S. growth and therefore, the Federal Reserve has begun to consider reducing rates to sustain the economic expansion. (Sources: U.S. Treasury, Federal Reserve)


In 2016 7,400 adults aged 65+ were killed from automobile accidents

IRS Scams – Consumer Awareness

Identity theft and stolen funds are becoming a growing risk as thieves have devised clever methods of masking IRS communications. Various government entities have identified some of the most prevalent scams.

Refund Scam: Fraudulent emails, appearing to come from the IRS, notify you that you are eligible for a tax refund, but need to provide sensitive bank details in order to receive the funds.

Fund Scam: Inherited Funds, Lottery Winnings, & Cash Consignment Scams. 

Email Scam: Emails claiming to come from the U.S. Department of Treasury, notify you that you will receive millions of dollars if you follow the instructions in the email. 

SS Scam: An identity thief could use your social security number to fraudulently file a tax return and claim a refund.  You could be completely unaware that your identity has been stolen until your return is rejected for e-filing or you get a notice or letter from the IRS.

Suspicious IRS Items: You receive a fraudulent notice from the IRS stating that more than one return was filed in your name for the year. You have a balance due, refund offset, or initiation of collection action for a year when you did not file. IRS records indicate that you received wages from an employer you didn’t work for.

You should respond immediately to the name and phone number printed on the IRS notice or letter.  You should also complete Form 14039, Identity Theft Affidavit. (Source: IRS.gov, consumer.ftc.gov, treasury.gov)