Ocean Park Capital Management

2503 Main Street

Santa Monica, CA 90405

Main: 310.392.7300

Daily Performance Line:  310.281.8577

June 2020
Market Update
(all values as of 02.29.2024)

Stock Indices:

Dow Jones 38,996
S&P 500 5,096
Nasdaq 16,091

Bond Sector Yields:

2 Yr Treasury 4.64%
10 Yr Treasury 4.25%
10 Yr Municipal 2.53%
High Yield 7.63%

YTD Market Returns:

Dow Jones 3.47%
S&P 500 6.84%
Nasdaq 7.20%
MSCI-EAFE 2.23%
MSCI-Europe 1.23%
MSCI-Pacific 3.98%
MSCI-Emg Mkt -0.27%
 
US Agg Bond -1.68%
US Corp Bond -1.67%
US Gov’t Bond -1.59%

Commodity Prices:

Gold 2,051
Silver 22.87
Oil (WTI) 78.25

Currencies:

Dollar / Euro 1.08
Dollar / Pound 1.26
Yen / Dollar 150.63
Canadian /Dollar 0.73
 

Portfolio Overview

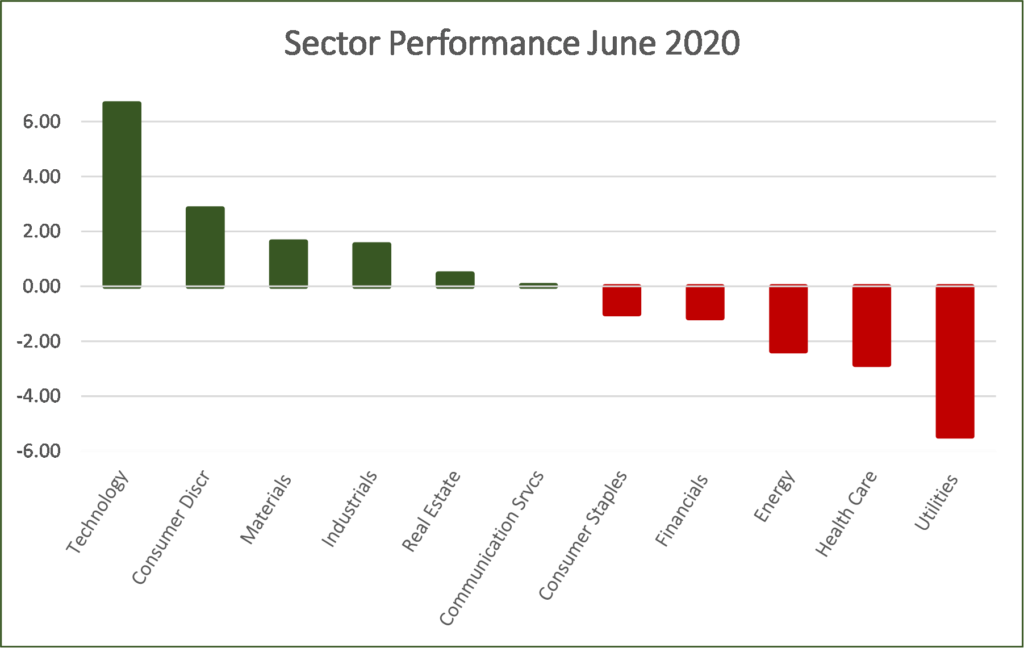
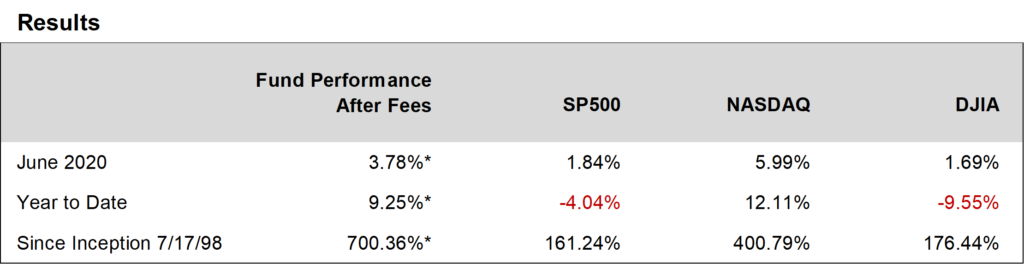
Ocean Park Investors Fund rose 3.78%* in June and outperformed most of the major indices, including the S&P 500 which gained 1.84%.  In addition, the fund outperformed the HFRI Equity Hedge Index, which rose 2.99%.  For the year to date through June, the fund was up 9.25%* while the S&P 500 was down 4.04% and the Dow was down 9.55%.  Once again, we achieved these results while maintaining the hedge which we have previously discussed.  Several portfolio stocks generated outsized gains, including Zoom Video (up over 40% for the month) and Docusign (up over 20%).

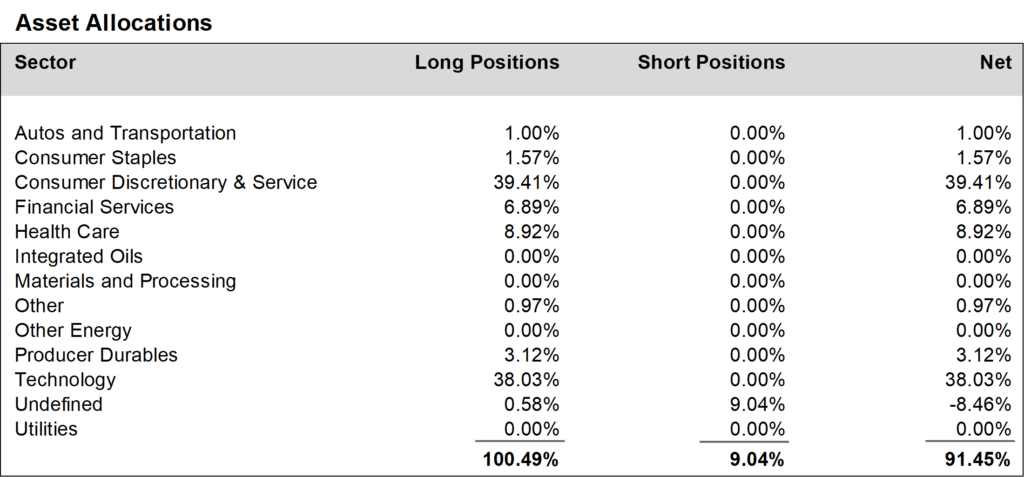
During June, we increased positions in the consumer discretionary and service sector and reduced positions in the consumer staples sector.  We finished the month at about 91% net long, unchanged from May.


Daily updates on our activity are available on our Results Line, at 310-281-8577, and current information is also maintained on our website at www.oceanparkcapital.com. To gain access to the site enter password opcap.

*These results are pro forma. Actual results for most investors will vary. See additional disclosures on page 4. Past performance does not guarantee future results.

 
Equity Overview - June 2020

Equity Overview

All the major indices showed net gains in June, but sector performance was mixed.  Technology was the standout, followed by consumer discretionary, but financials, energy, healthcare, and utilities all lost ground.

Growth stocks continued to outpace value stocks across all capitalization levels.

Volatility returned to the markets, as 11 of 23 trading days generated swings greater than 1% in the S&P 500, including a 6% downdraft on June 11 sparked by a surge in Covid-19 cases.


Macro Overview

Unsurprisingly, pandemic news continued to dominate headlines in June. Markets reacted with each report of progress toward a vaccine, or on the other hand, news of worsening Covid-19 caseloads and deaths.  This pattern looks to prevail for the foreseeable future.

Economic data reported in June showed some gains, with upticks in manufacturing, retail sales, durable goods, and housing.  There was also some hopeful news on employment, as initial jobless claims declined.  But continuing claims remained at extraordinary levels around 19,000,000.

In its continuing efforts to support the economy, the Fed indicated that it will broaden its program of corporate lending significantly.  When first announced, the program was limited to the purchase of exchange-traded funds with broad exposure to corporate bonds, which provided indirect support for the corporate bond market.  Now the Fed has announced that it will take the unprecedented step of buying debt issued by individual corporations.  Those with long memories will recall the acronym QE, or Quantitative Easing, which described the Fed’s program of buying US Treasury notes and mortgage-backed securities in response to the Great Recession of 2008.  Given the dramatic expansion of the Fed’s response in the current crisis, analysts now define QE as Quantitative Everything.


Additional Disclosures

Additional Disclosures

Performance data for OPI reflect the reinvestment of dividends and other earnings on the fund’s assets.  Performance data for the major indices reflect only changes in the value of those indices, and would be higher if dividends were included. However, the index data do not reflect fees that would be paid to index fund managers and transaction costs that would be incurred when their component stocks are bought or sold, while OPI’s data do reflect quarterly fees and expenses incurred by the fund.  The information provided is believed to be reliable, but its accuracy or completeness is not warranted. This material is not intended as an offer or solicitation for the purchase or sale of any stock, bond, mutual fund, or any other financial instrument. The views and strategies discussed herein may not be appropriate and/or suitable for all investors. This material is meant solely for informational purposes, and is not intended to suffice as any type of accounting, legal, tax, or estate planning advice. Any and all forecasts mentioned are for illustrative purposes only and should not be interpreted as investment recommendations.