Alex Gregory Garcia

AGG Asset Management, LLC

875 S. Westlake Blvd, Suite 218

Westlake Village, CA  91361

805.496.3344

www@aggassetmanagement.com

July 2021
Market Update
(all values as of 09.30.2024)

Stock Indices:

Dow Jones 42,330
S&P 500 5,762
Nasdaq 18,189

Bond Sector Yields:

2 Yr Treasury 3.66%
10 Yr Treasury 3.81%
10 Yr Municipal 2.63%
High Yield 6.66%

YTD Market Returns:

Dow Jones 12.31%
S&P 500 20.81%
Nasdaq 21.17%
MSCI-EAFE 12.90%
MSCI-Europe 12.10%
MSCI-Pacific 13.80%
MSCI-Emg Mkt 16.80%
 
US Agg Bond 4.44%
US Corp Bond 5.32%
US Gov’t Bond 4.39%

Commodity Prices:

Gold 2,657
Silver 31.48
Oil (WTI) 68.27

Currencies:

Dollar / Euro 1.11
Dollar / Pound 1.33
Yen / Dollar 142.21
Canadian /Dollar 0.73
 

Macro Overview

Financial markets are becoming more sensitive to the Delta variant mutation of Covid-19, as some countries in Europe reconsider easing restrictions on businesses and travel. Regardless, global equities finished the 2nd quarter on a positive note and rates stabilized following an upward trending environment earlier in the year.

A lack of spending and stay home orders during the pandemic has left millions of consumers with abundant cash hoards, which has been a factor in the recent economic activity occurring nationwide. Some economists and analysts question as to how long it will be until the plentiful cash positions are depleted.

Comments by St. Louis Federal Reserve Bank member James Bullard suggested that there is a “housing froth that seems to be developing” and indicated a pullback on mortgage bond purchases by the Federal Reserve could happen in 2022.

Half of existing home buyers in April that took a mortgage out put 20% down, while a quarter of buyers paid cash according to the National Association of Realtors. Cash offers as well as large down payments are pushing some less capable buyers out of the market, consequently forcing many to rent until conditions change.

There is growing concern that the more infectious Delta variant of Covid-19 may evolve into a dominant strain in the U.S. The highly transmissible variant made up 30% of positive samples sequenced in the U.S. for the two-week period ending June 19th according to the U.S. Centers for Disease Control and Prevention. The Delta mutation first emerged in India and has since been spreading worldwide, forcing some countries to reevaluate loosened restrictions on businesses, travel and public events.

An eviction moratorium for tenants set to expire on June 30th was extended to July 31st after a Supreme Court decision. The moratorium was initiated in August by the prior administration to help tenants that were experiencing financial hardships due to Covid-19. Some landlords across the country have consequently seen months of non-payment by some tenants with the inability to evict them. The U.S. Department of Agriculture also extended through July 31st a moratorium on foreclosures from properties financed by USDA Single Family Housing Direct and guaranteed federal loans.

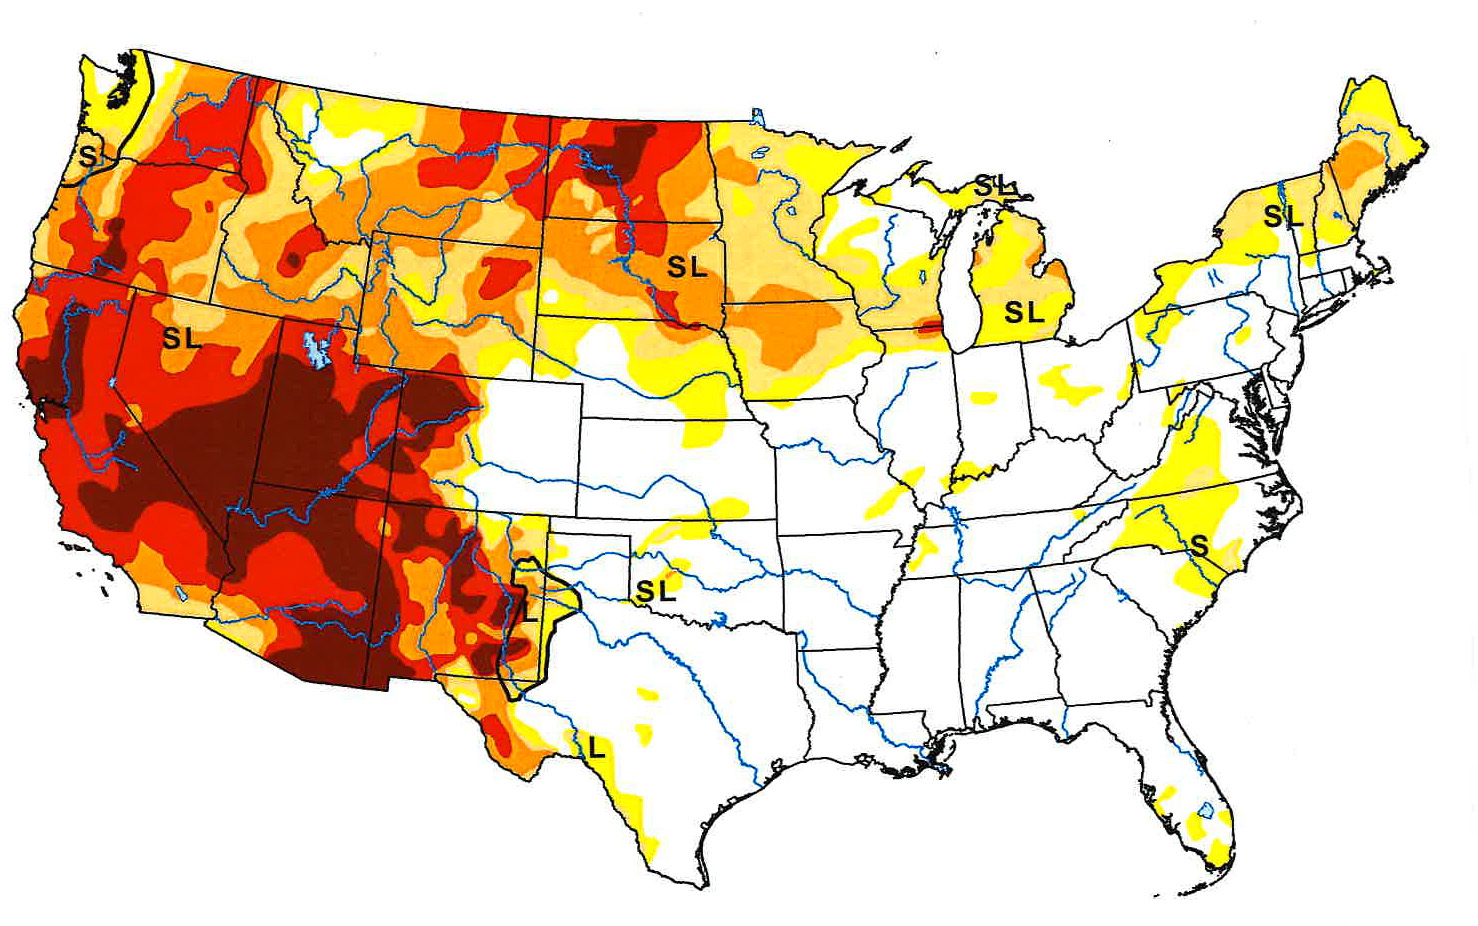
The U.S. Drought Monitor shows that nearly ten percent of the United States is experiencing exceptional drought characteristics as of June 30th. Severe drought conditions are primarily inflicting the western states even as excessive rains pound other parts of the country. Food crops such as wheat, corn and grains are expected to be affected, pushing prices higher in an already inflationary environment. (Sources: Labor Dept., U.S. Drought Monitor, NAR, USDA, Fed, CDC)
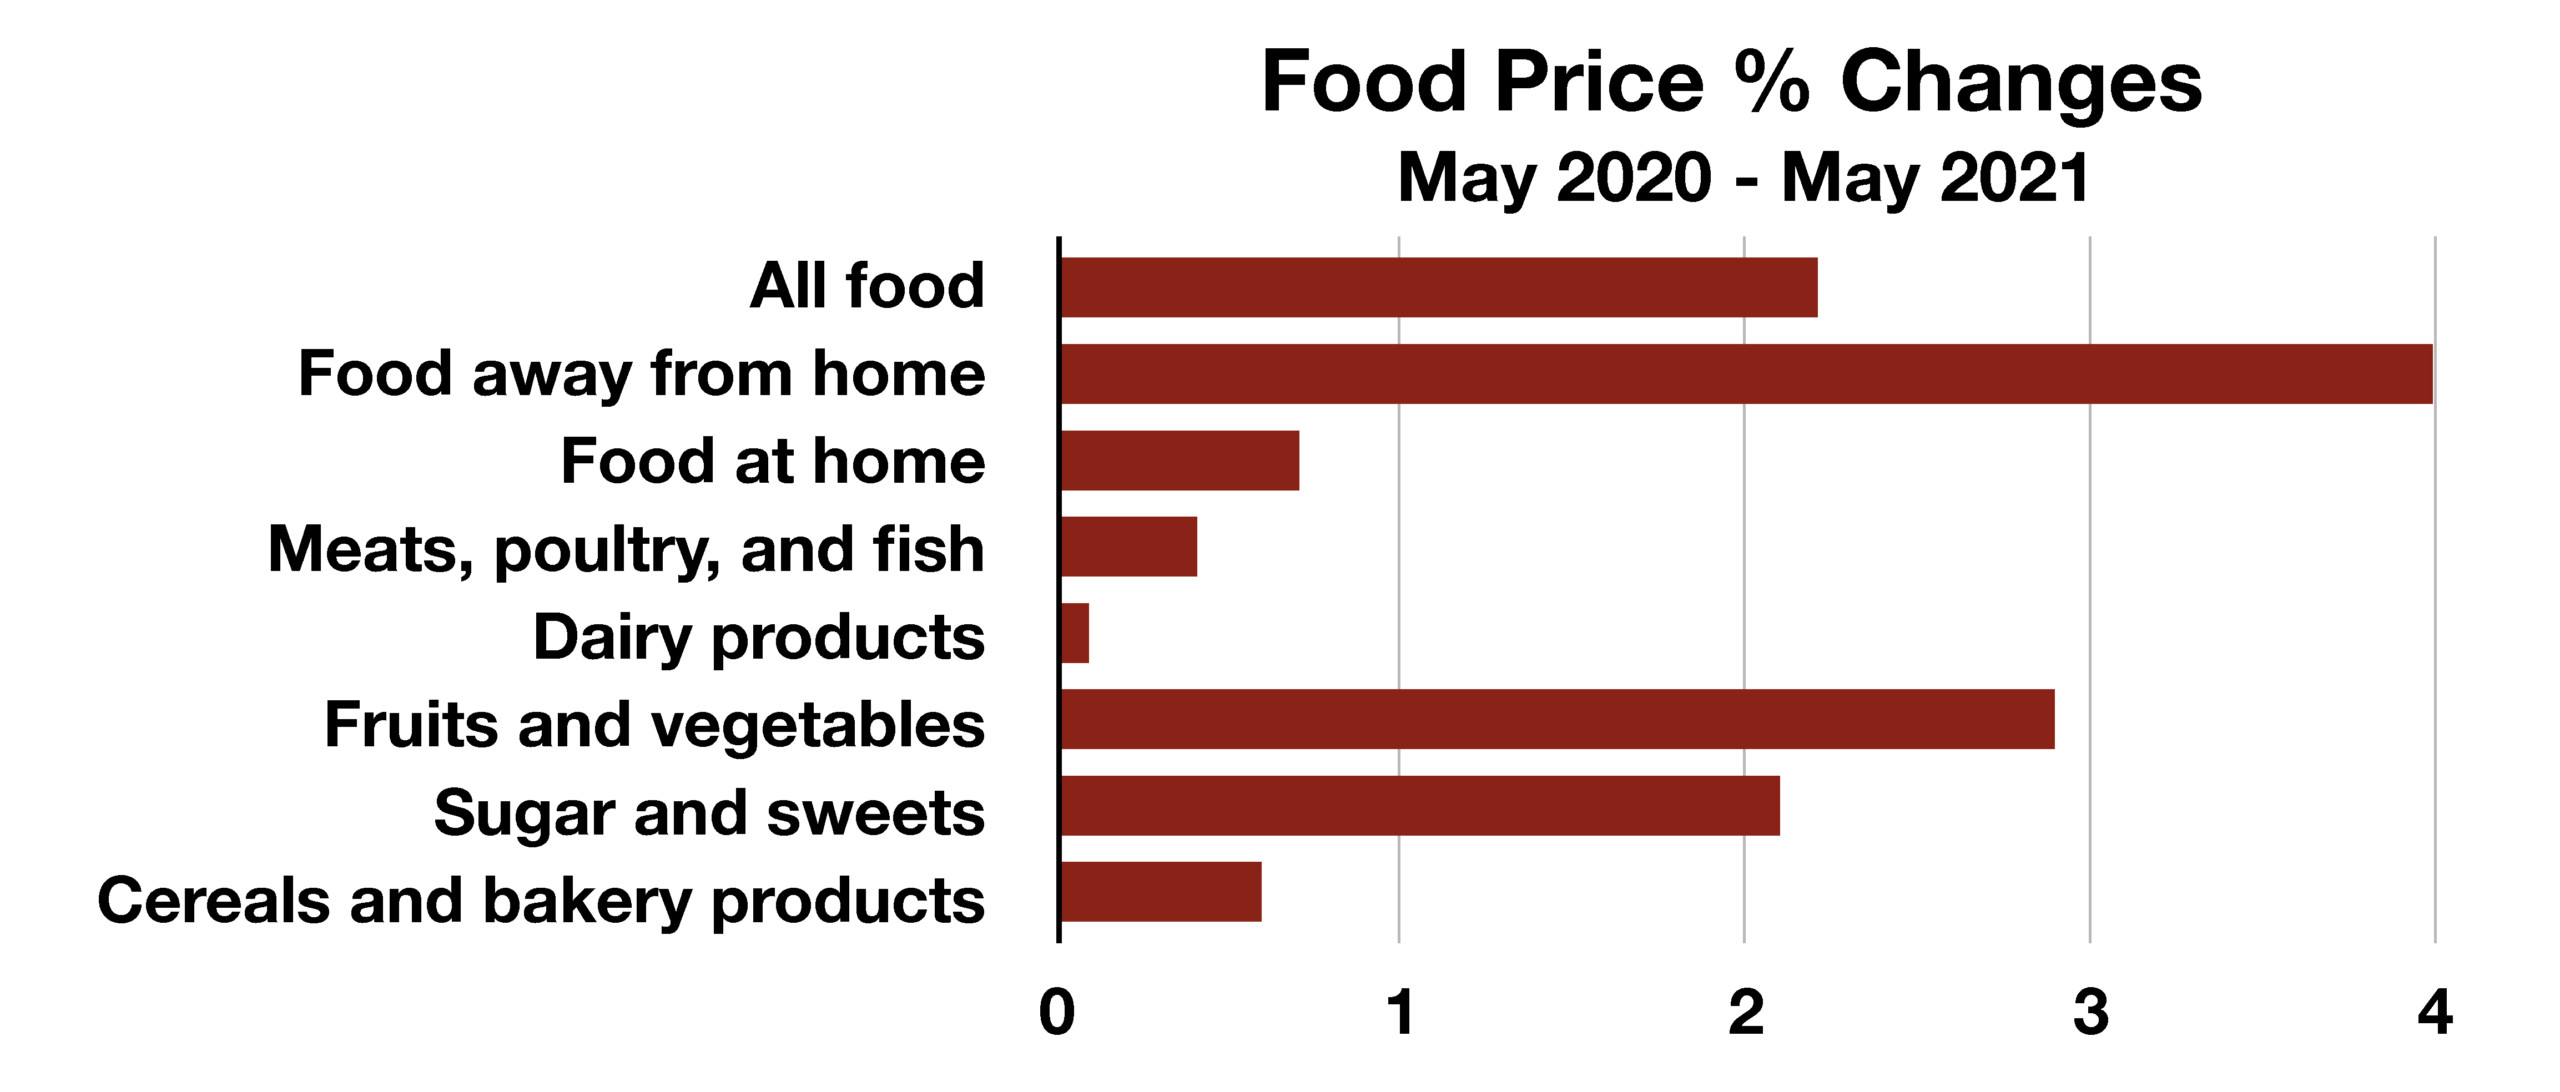
 
the cost of eating out has seen the largest increase in years

Equity Indices Post Positive Second Quarter – Domestic Equity Markets

The 2nd quarter ended positively for major global indices, with the S&P 500 index posting gains for 10 of the 11 sectors. Top performing sectors for the quarter included technology, communications, healthcare, and financials.

The SEC said that it is closely monitoring frantic moves in the market caused by memes to determine if there have been any market disruptions, manipulative trading or other misconduct. It also said that it will act to protect retail investors if violations of federal laws are found.

Inflation, higher taxes, and the Delta variant are the focal point of concern for equity markets, especially at recent new highs. There is some momentum in revenue & earnings growth for particular sectors, but not on a broad level. (Sources: S&P, SEC, Bloomberg)

Rates Cease Upward Trend – Fixed Income Update

Treasury bond yields stabilized in the 2nd quarter after rising earlier in the year. Short-term rates rose slightly resulting in a flattening yield curve, an indication of possible slower economic growth as the Fed considers raising rates higher.

Comments by St. Louis Federal Reserve member James Bullard indicated that the Fed may start increasing rates in 2022 via buying fewer bonds through their asset purchase program. A scale back on mortgage bond purchases is expected to occur initially before pullbacks on other government bonds.

Rates on mortgages stood steady at 2.98% for a 30-year fixed conforming loan as of July 1, 2021 as posted by FreddieMac. Other consumer loans also held steady as the Fed deliberated on possible future rate increases. (Source: U.S. Treasury, Federal Reserve, FreddieMac)

Going Out To Restaurants Has Become Expensive – Food & Dining Update

With the pandemic subsiding and alleviated restrictions enticing consumers to head out, restaurants have seen an enormous surge in business. While many restaurants suffered tremendous setbacks during the height of the pandemic, some have reopened and hired back once laid off employees. Adding to the challenges are increasing costs for food and labor, which have both risen substantially since last year. Consequently, many restaurants are passing along higher costs in the form of more expensive menu prices.

The Bureau of Labor Statistics tracks prices on what consumers use regularly, such as food. What it found is that the costs of eating at restaurants, categorized by the bureau as “food away from home,” had gone up the most relative to other food options. (Source: Bureau of Labor Statistics)

 
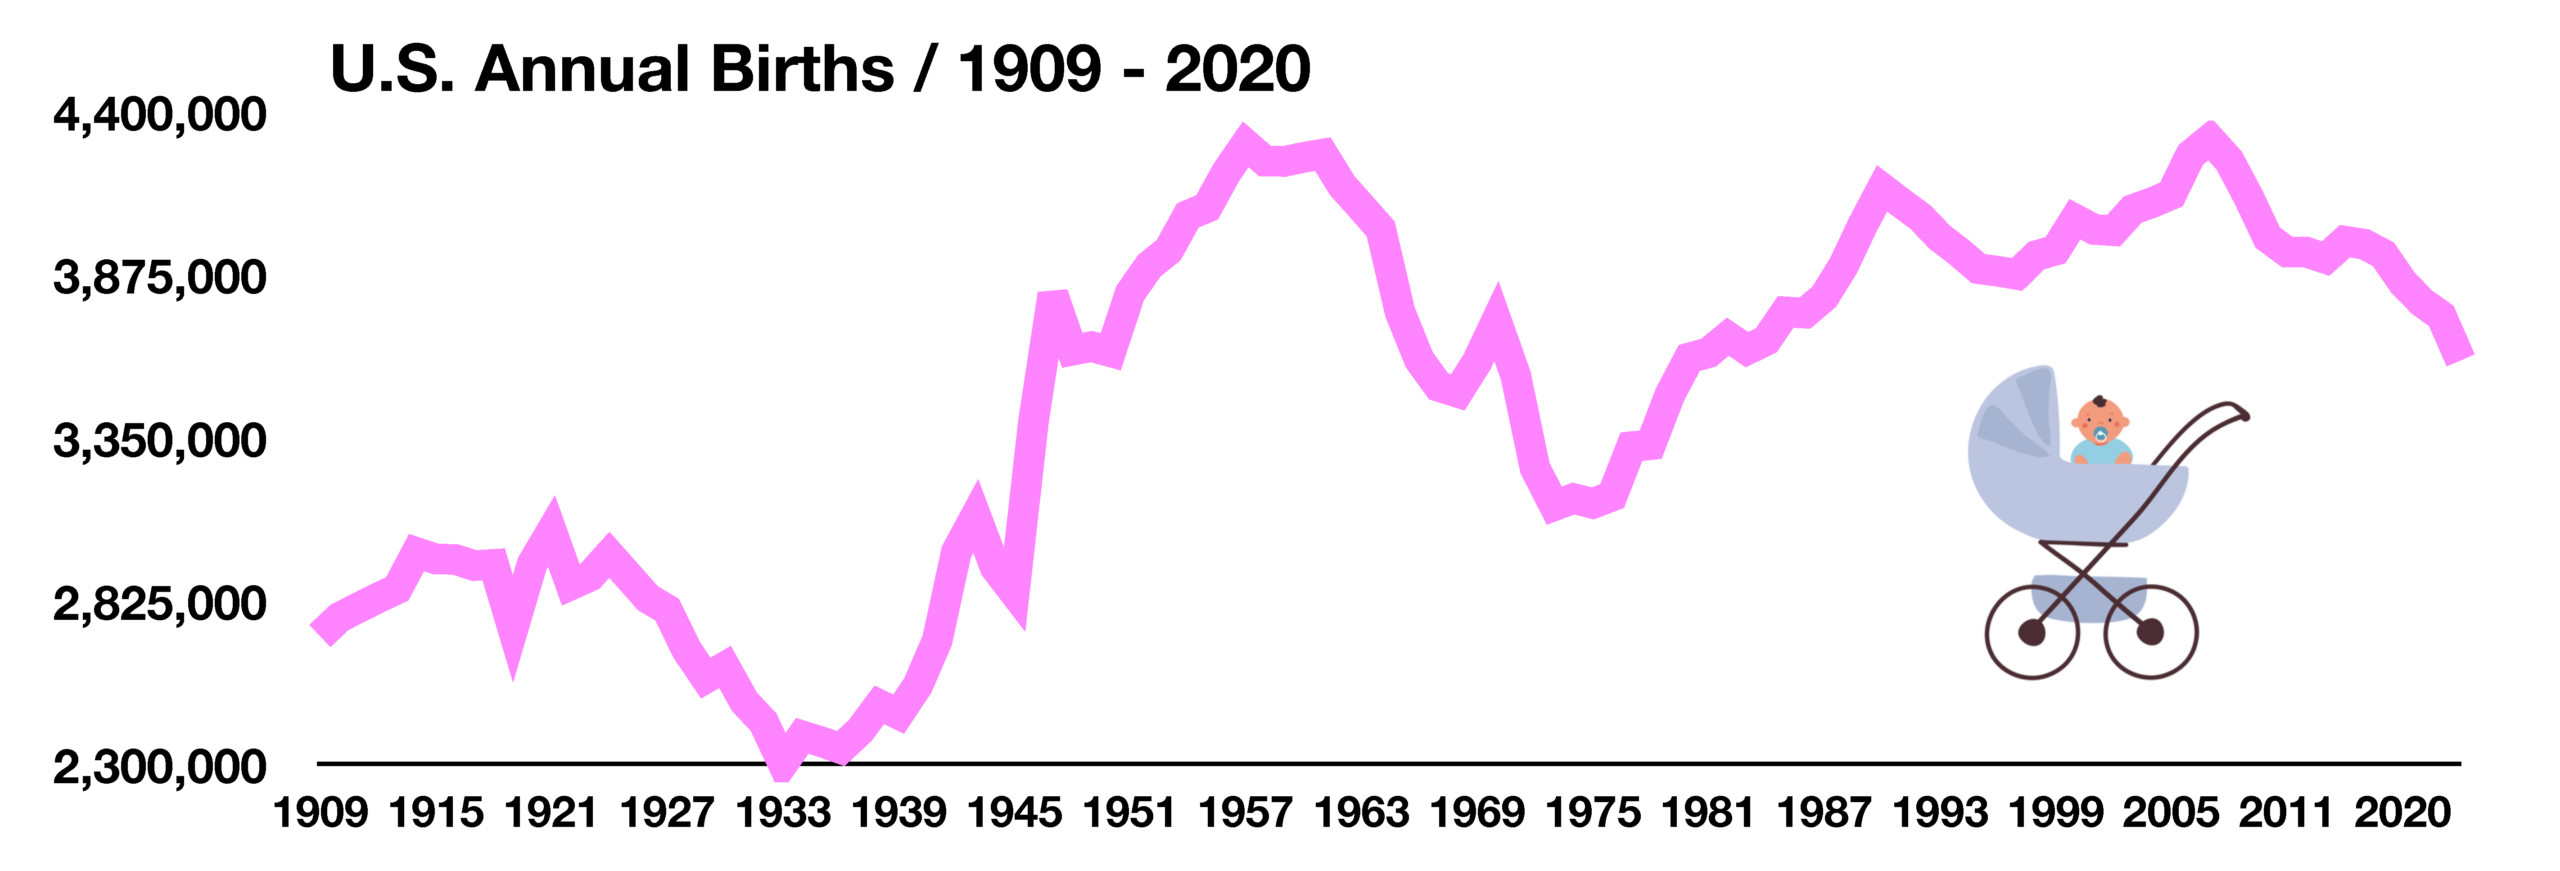
the u.s. birthrate fell 4% over the past year, the largest decline since 1973

Births In U.S. Fall Following Pandemic – Domestic Demographics

The Centers for Disease Control and Prevention reported that the U.S. birthrate fell 4% to about 3.6 million births over the past year, the largest decline since 1973.

Births have been declining since the Great Depression as Americans got married later and held off on having children over the decades. The pandemic pronounced the effects of child birth due to the fear of visiting hospitals and lack of child care. Higher costs associated with raising children also inhibited families from growing especially for those that were unemployed during the pandemic.

It is expected that the drop in births due to the pandemic may have long-term consequences for the U.S. population, limiting growth relative to other developed countries.

Source: The Centers for Disease Control and Prevention

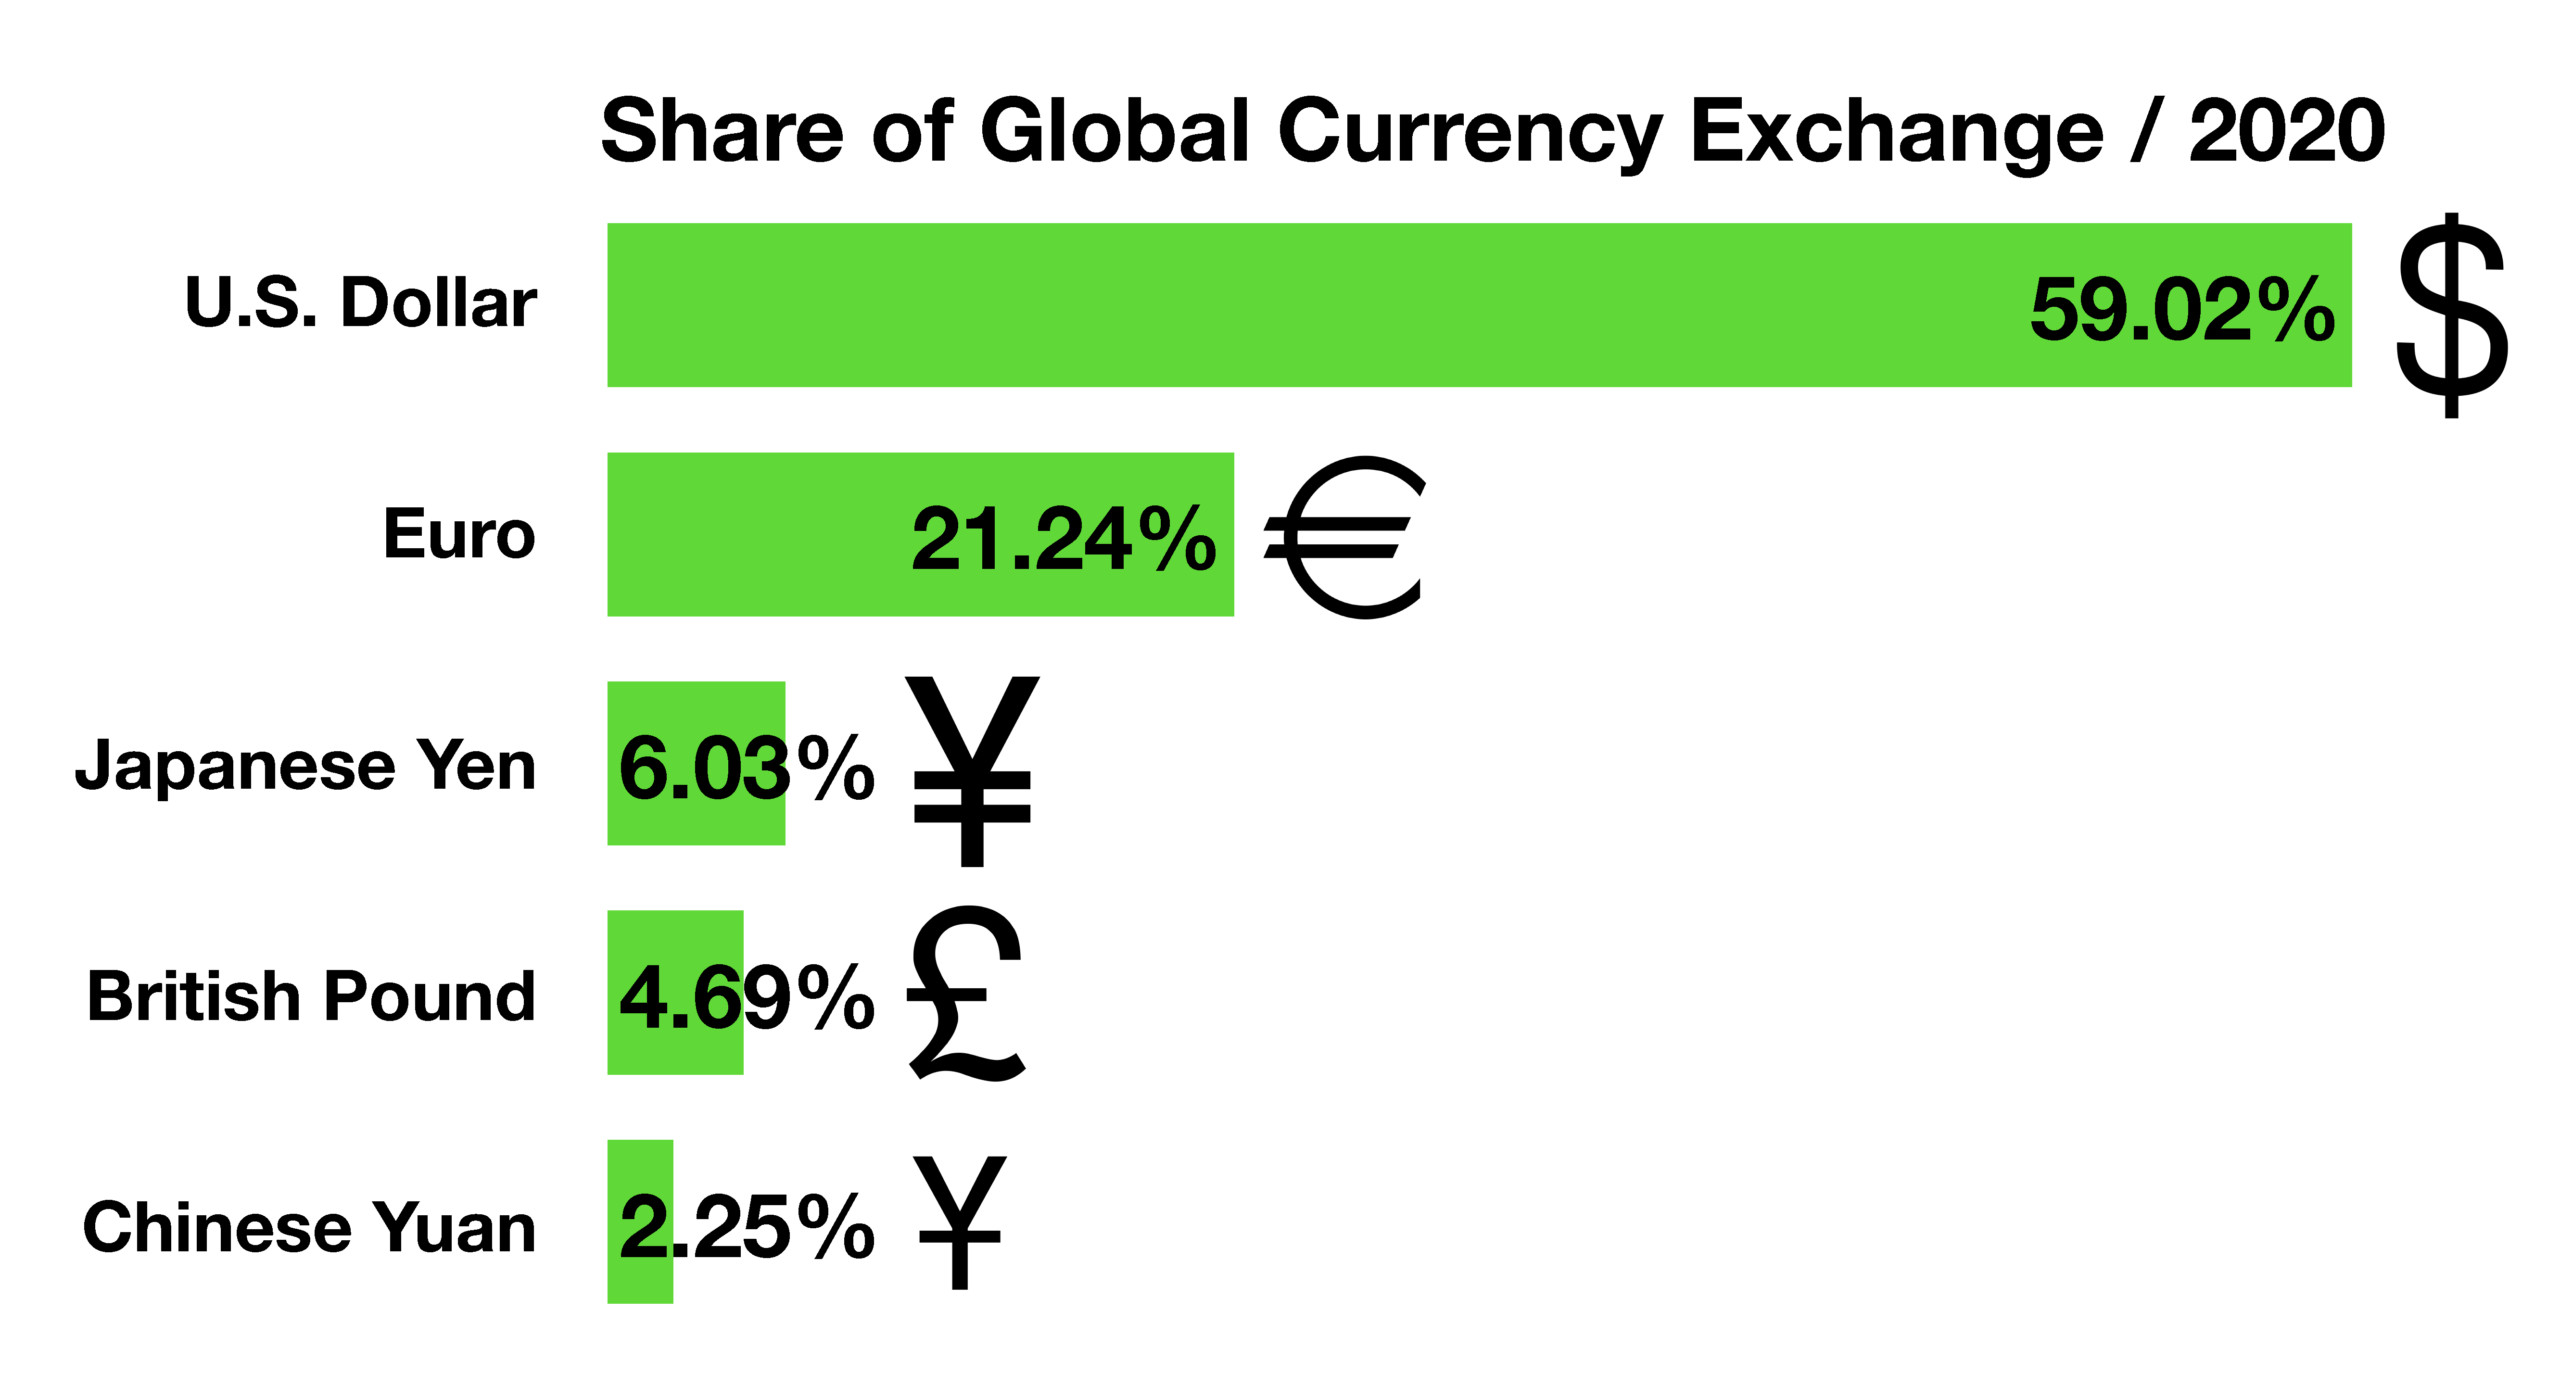
Dollar Share Of Global Exchange Reserves Drops To 25 Year Low – Currency Market Update

For decades the U.S. dollar has been the most dominant of the reserve currencies in the world. The liquidity and transparency of the dollar versus other world currencies has made it the primary reserve currency for foreign governments and international trading entities.

Dollar supremacy has recently become more challenged as the U.S. struggles with a growing budget deficit and expanding Treasury debt, which can put downward pressure on a country’s currency. A weakening dollar may also become inflationary for U.S. consumers by limiting purchasing power as well as increased borrowing costs for the U.S. government.

The most recent data compiled by the International Monetary Fund (IMF) show the U.S. dollar representing 59% of global exchange reserves, down from 65% in 2016 and the lowest in 25 years. Other expanding economies, such as China’s, have seen their currency gradually increase as a reserve currency status over the past few years.

Sources: IMF Currency Composition of Foreign Exchange Reserves, Federal Reserve

 
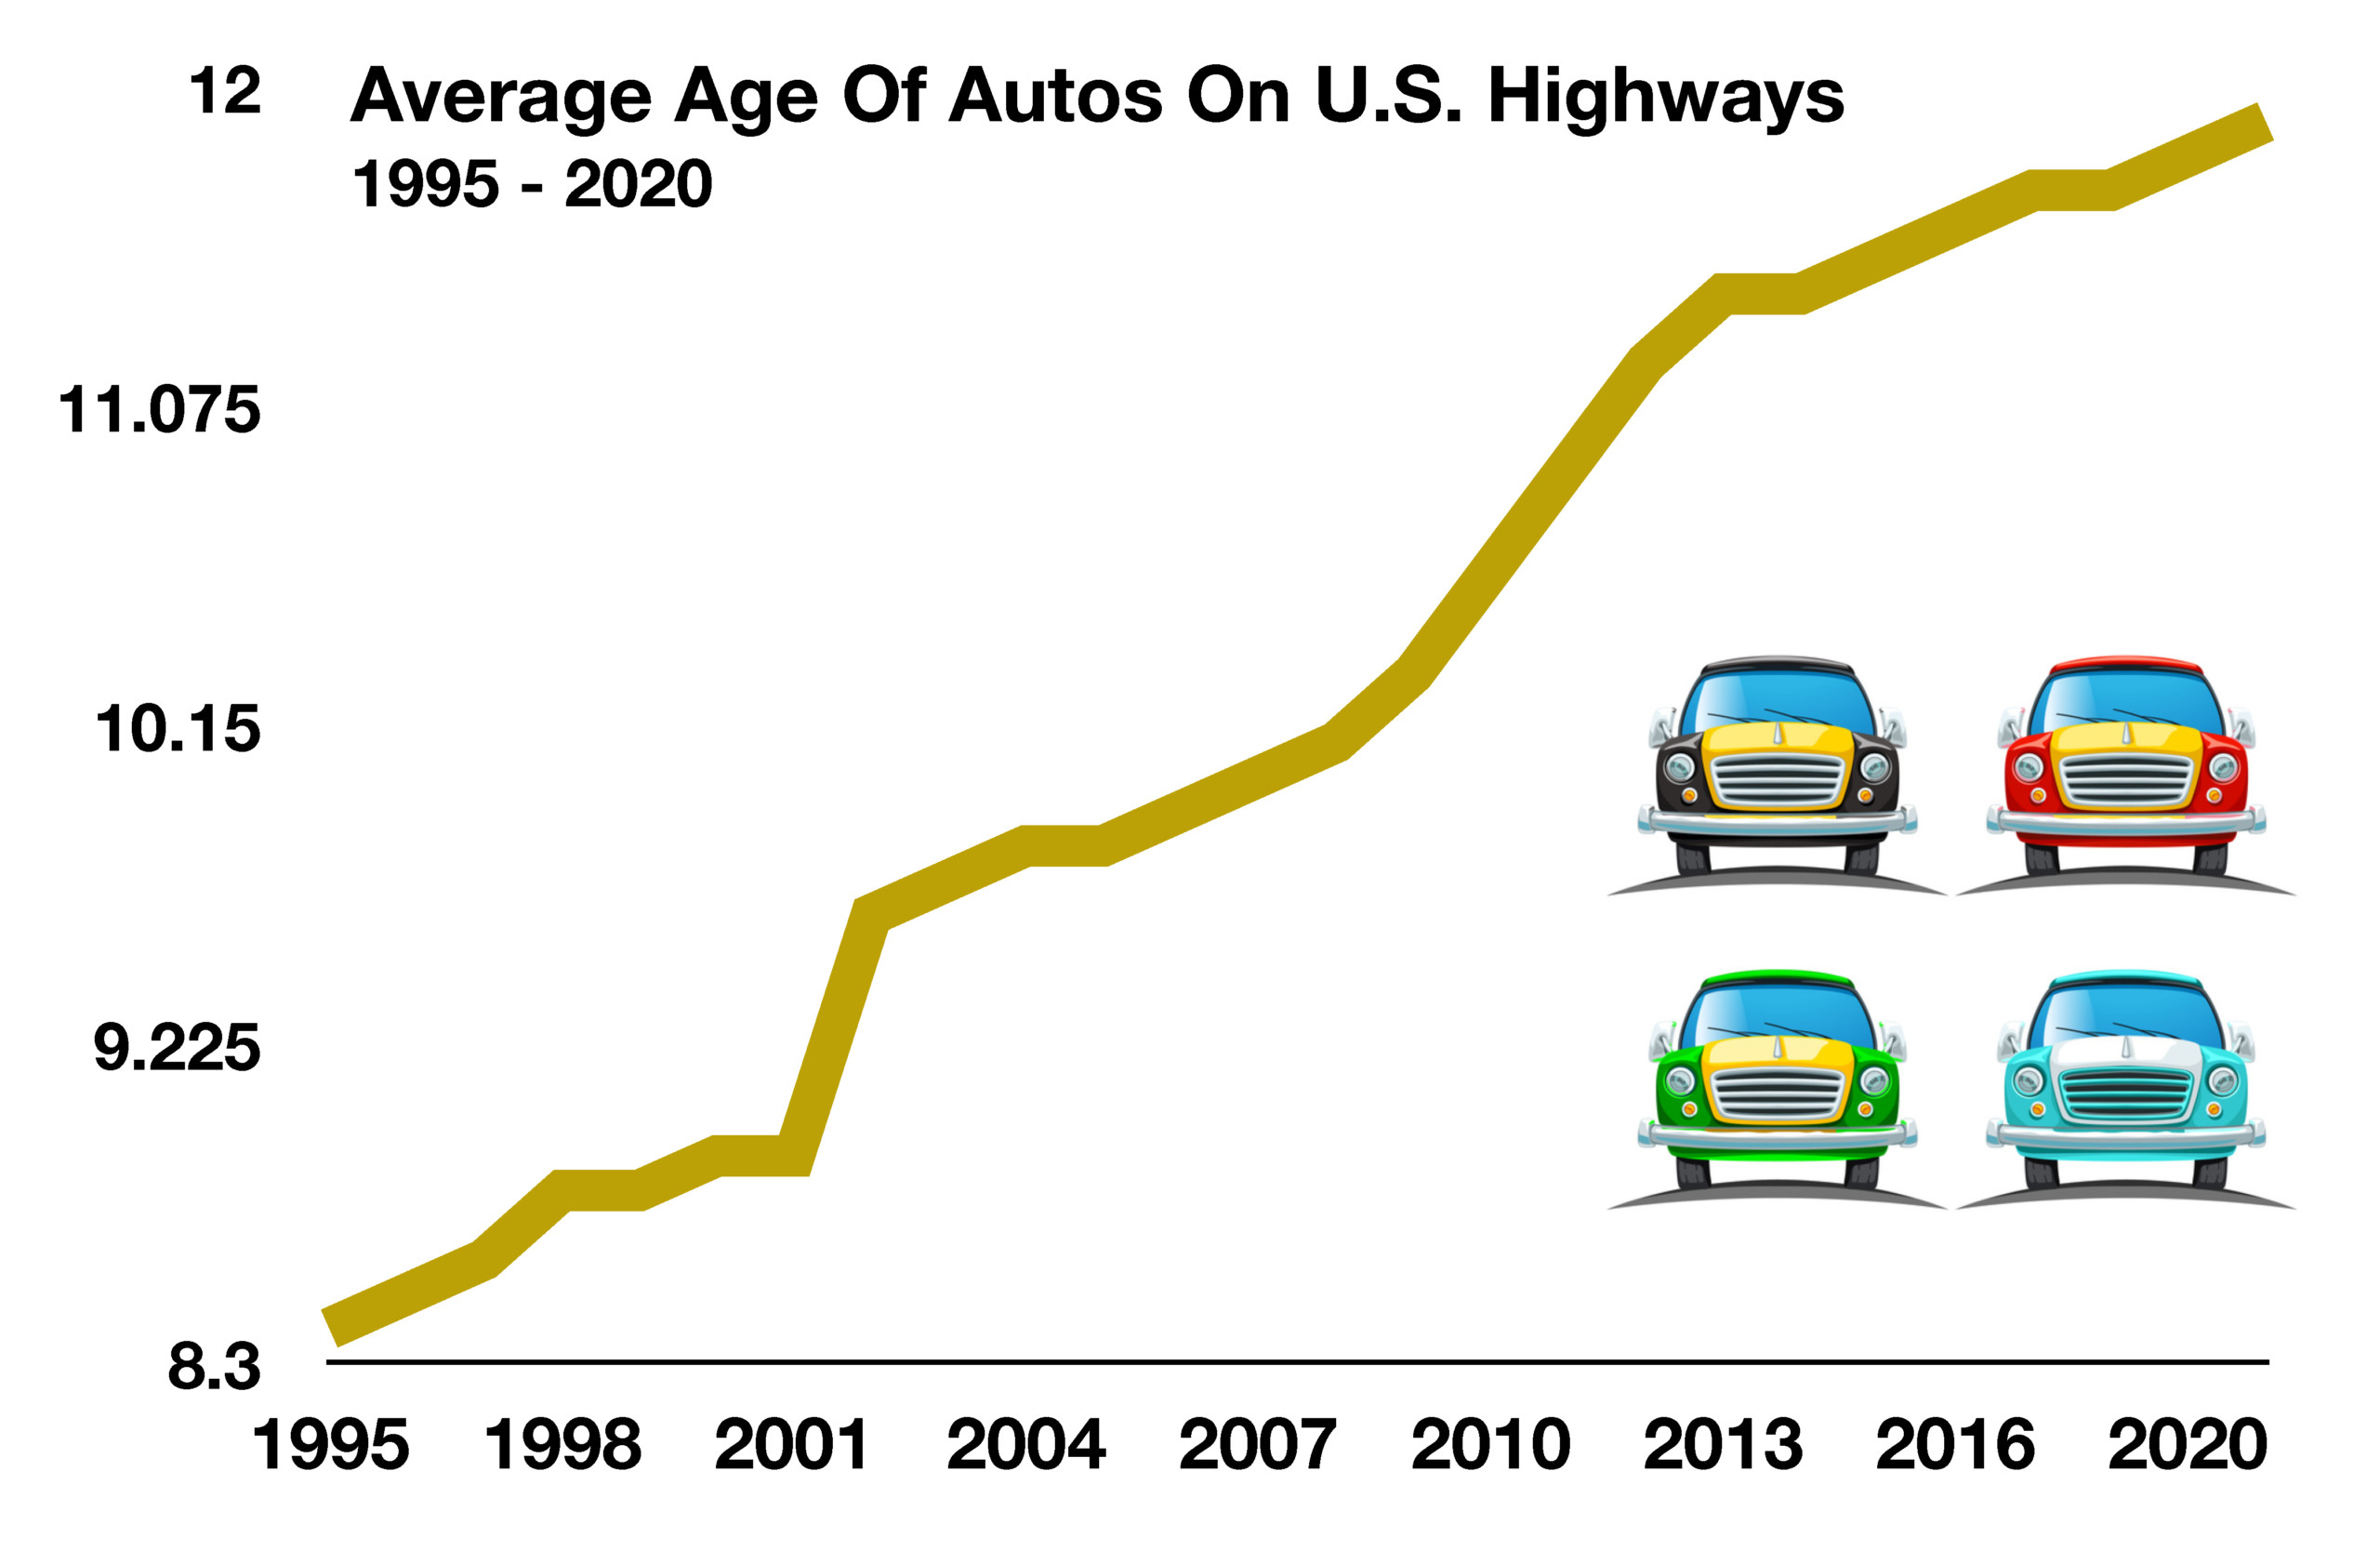
the average age of a car on U.S. highways is now 12 years old

It May Be Time To Review Homeowners Insurance Coverage – Consumer Awareness

As home values have increased, so has the need to review insurance policies to be certain that appropriate coverage is in force. It is recommended that homeowners review their current coverage on their insurance policies in order to avoid under coverage circumstances.

When reviewing homeowners insurance, there are two basic types of coverage: replacement cost and market value. Replacement cost is the cost necessary to replace your entire home based on an estimated replacement cost. Market value is the amount that a buyer would pay to purchase your home and property in its current condition.

Replacement cost is preferred because it takes into account current material costs that may not be reflected in a market value. Over the past year, the pandemic drove the costs of lumber and copper significantly higher, increasing replacement costs. Homeowners that plan to stay put and not sell should review their policies for appropriate coverage. (Source: Consumer Financial Protection Bureau, U.S. Bureau of Labor Statistics; Producer Price Index by Commodity: Lumber and Wood Products: Softwood Lumber)

Average Age Of Autos On U.S. Highways Reaches 12 Years Old – Automotive Market Overview

Circumstances over the past year have driven prices for used and new cars higher, shifting consumer buying behavior. Supply constraint issues for critical components needed for autos and light trucks have made it extremely difficult to purchase new automobiles. As a consequence, demand and prices for used cars has also gone up, leaving many drivers to hold on to their existing cars.

The Bureau of Transportation Statistics identified that the average age of vehicles on U.S. highways is now 12 years old, a reflection of drivers holding on to their cars longer. Improvements in technology and efficiency over the decades has allowed more automobiles to reach higher mileage and keep running.

Source: Bureau of Transportation Statistics