Ocean Park Capital Management

2503 Main Street

Santa Monica, CA 90405

Main: 310.392.7300

Daily Performance Line:  310.281.8577

June 2021
Market Update
(all values as of 04.30.2024)

Stock Indices:

Dow Jones 37,815
S&P 500 5,035
Nasdaq 15,657

Bond Sector Yields:

2 Yr Treasury 5.04%
10 Yr Treasury 4.69%
10 Yr Municipal 2.80%
High Yield 7.99%

YTD Market Returns:

Dow Jones 0.34%
S&P 500 5.57%
Nasdaq 4.31%
MSCI-EAFE 1.98%
MSCI-Europe 2.05%
MSCI-Pacific 1.82%
MSCI-Emg Mkt 2.17%
 
US Agg Bond 0.50%
US Corp Bond 0.56%
US Gov’t Bond 0.48%

Commodity Prices:

Gold 2,297
Silver 26.58
Oil (WTI) 81.13

Currencies:

Dollar / Euro 1.07
Dollar / Pound 1.25
Yen / Dollar 156.66
Canadian /Dollar 0.79
 

Portfolio Overview

Ocean Park Investors Fund gained 3.36%* in June.  The S&P 500 rose 2.22% and the NASDAQ Composite rose 5.49%.  Reversing the results in May, the Fund’s consumer and technology stocks posted solid gains while financial stocks were weak.  Standouts included Docusign (up 38%) and Nvidia (up 23%).

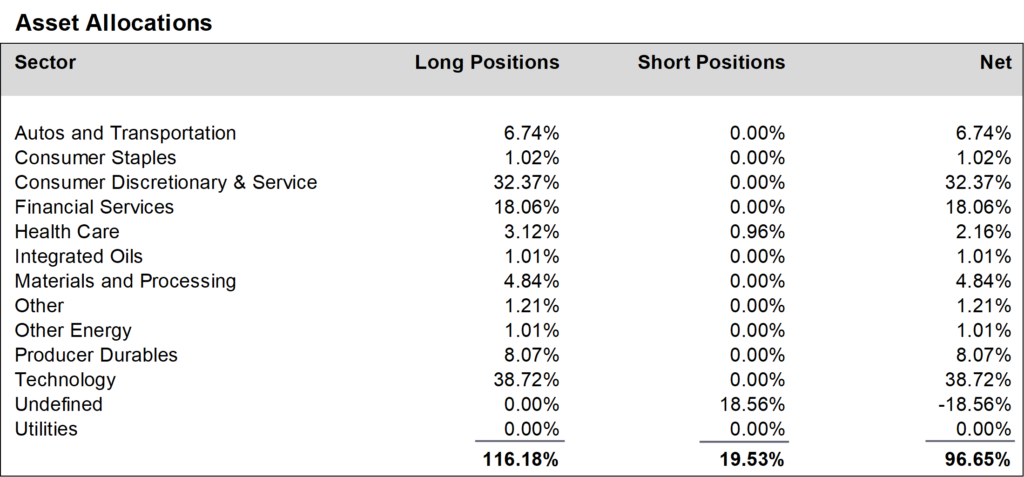
During June, we increased positions in the technology sector and the financial services sector, and reduced positions in the consumer discretionary and services sector.  In addition, to more accurately balance the portfolio, we replaced about half of our short position in the QQQ ETF with a short position in the SPY ETF.  We finished the quarter at about 97% net long, up from about 95% in May.


Daily updates on our activity are available on our Results Line, at 310-281-8577, and current information is also maintained on our website at www.oceanparkcapital.com. To gain access to the site enter password opcap.

*These results are pro forma. Actual results for most investors will vary. See additional disclosures on page 4. 
Past performance does not guarantee future results.
 
Equity Overview

Equity Overview

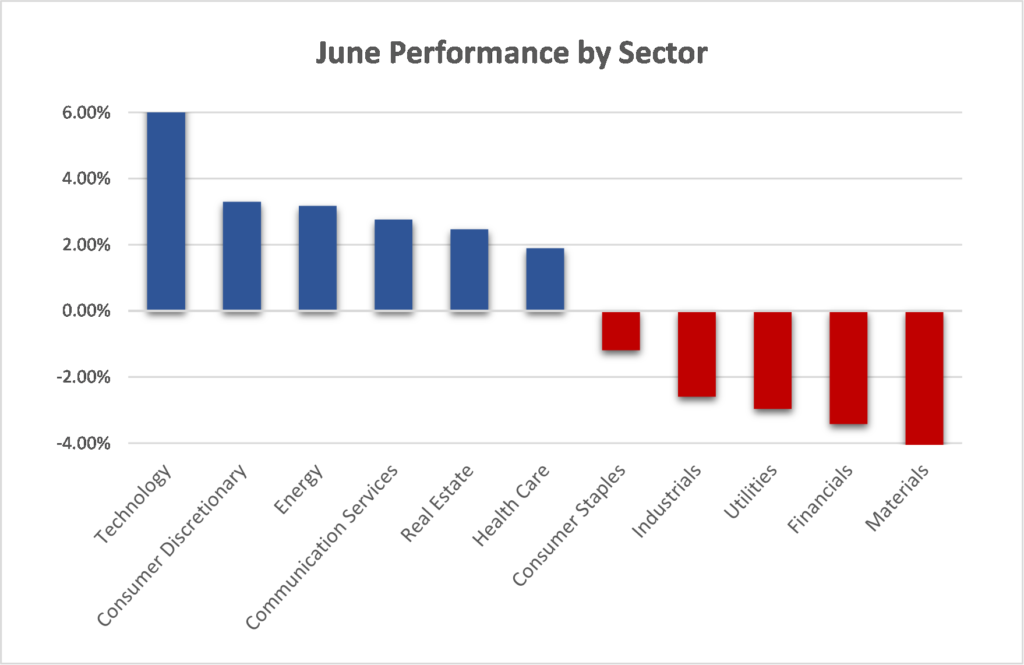
The major indices diverged in June, with the S&P 500 and the NASDAQ Composite up strongly while the Dow was down marginally.  Sector performance was similarly uneven, as technology, consumer, and energy stocks outperformed while materials and financial stocks lost ground

Growth stocks dramatically outperformed value stocks, which posted negative returns for the month.

Volatility was unusually mild, with the S&P 500 moving more than 1% on only two days (down 1.3 % one day, up 1.4% the next day).


Macro Overview

Macro Overview

Economic data reported in June were generally positive, with manufacturing and employment particularly robust.  Consumer confidence hit its highest level in 16 months.

Meanwhile, consumer prices reported in June maintained their upward trajectory, rising 5.0% year-over-year.  This exceeded the 4.2% increase reported in May, which was the highest since September 2008.

In response, cracks have appeared in what was previously unified sentiment at the Fed favoring continued easing in monetary policy.  Some governors are now suggesting tightening sooner rather than later, starting with slowing the pace of Fed bond purchases.  Chairman Powell, however, urges caution.  He continues to believe that the inflationary pressures are temporary and will resolve on their own as the economy returns to normalcy.

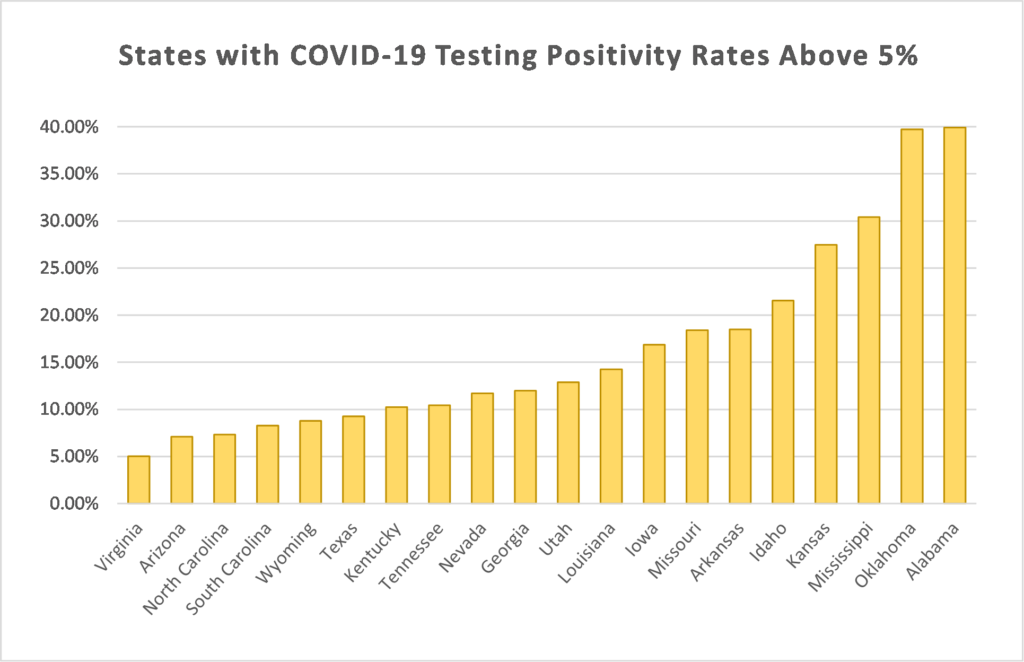
The ebb and flow of the Covid-19 pandemic continues to impact the stock market and the broader economy.  As the Delta variant became the dominant strain in June the virus began to spread again, reversing earlier progress.  The problem was exacerbated by a troubling slowdown in the rate of vaccination, particularly in red states, where disinformation prevails and the issue has become politicized.  Rates of transmission, hospitalizations, and deaths are rising significantly in those areas.  Equally ominous, as the virus continues to infect a large segment of the population, the prospect for further mutation increases—potentially posing a threat to the already-vaccinated.


  Source: Johns Hopkins University Coronavirus Resource Center
 
Additional Disclosures

Additional Disclosures

Performance data for OPI reflect the reinvestment of dividends and other earnings on the fund’s assets.  Performance data for the major indices reflect only changes in the value of those indices, and would be higher if dividends were included. However, the index data do not reflect fees that would be paid to index fund managers and transaction costs that would be incurred when their component stocks are bought or sold, while OPI’s data do reflect quarterly fees and expenses incurred by the fund.  The information provided is believed to be reliable, but its accuracy or completeness is not warranted. This material is not intended as an offer or solicitation for the purchase or sale of any stock, bond, mutual fund, or any other financial instrument. The views and strategies discussed herein may not be appropriate and/or suitable for all investors. This material is meant solely for informational purposes, and is not intended to suffice as any type of accounting, legal, tax, or estate planning advice. Any and all forecasts mentioned are for illustrative purposes only and should not be interpreted as investment recommendations.