Macro Overview
Inflationary pressures are beginning to reveal themselves as U.S. consumer prices recorded their biggest increase in more than three years. Demand for new homes grew as housing starts rose more than expected last month. Such positive economic growth has prompted Fed officials to consider raising rates this summer, stating “its appropriate for the Fed to gradually and cautiously increase rates in the coming months.”
Another rate increase by the Fed would put the Fed Funds Rate at 0.50%, up from its current 0.25% which was the last rate increase in December 2015. The Fed Funds Rate was essentially zero since 2008 when the Fed began its bond buying stimulus program, known as Quantitative Easing (QE).
A new regulation implemented by the Labor Department in May will now allow “exempt” employees making up to $47,476 a year to earn overtime pay. Exempt employees are salaried workers who work over 40 hours per week but receive no overtime pay.
The European Union and central bankers world-wide are eagerly awaiting Britain’s vote on June 23rd to either stay within the Euro Zone or exit, also known as Brexit. Such a departure could cause riffs across markets in Europe as Britain’s banking and financial system presents a vital component of Europe.
Sources: Federal Reserve, ECB, EuroStat
U.S. New Home Sales Strongest Since 8 Years – Housing Update
In an effort to better determine the health of the housing market, the U.S. Department of Housing & Urban Development compiles and releases data every month. The most recent data available is, as of April 2016, revealed that sales of new homes increased to an annualized rate of 619,000, the largest increase in eight years. Various factors may account for the increase, including an improving employment market as well as additional homes completed and ready to sell.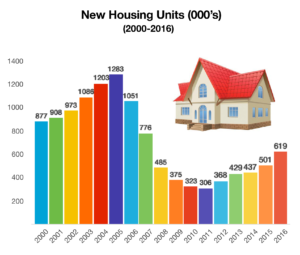
Sales of new homes versus sales of existing homes, provides a glimpse as to the health and future growth of the housing market. The housing market currently employs over 2 million people, a dramatic difference from the height of the housing market in 2006 when the industry employed over 4 million workers. So as more new homes are built and sold, more builders are hiring workers to build homes. There are 2 million fewer construction workers today than at the 2006 peak, due to many having retired and moved on. The supply of new entrants isn’t sufficient to satisfy builder needs in certain areas of the country. Various factors contribute to how and why more new homes were sold throughout the country, among them being supply, weather, demographics, and job growth.
Sources: Commerce Dept., Dept. of Housing & Urban Development
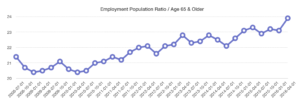 The financial crisis of 2008/2009 and the technology bubble bursting in 2000 devastated many retirement plans for employees, as their 401k and retirement savings lost enough to postpone retirement for many workers. A recent report by the Government Accounting Office showed that nearly 60% of U.S. households have no 401k or retirement plan assets. The precursor to less retirement assets was the waning of traditional pension plans funded by and provided by companies for years. The onslaught of 401ks and self-funding retirement plans has help lead to massive shortfalls in retirement assets.

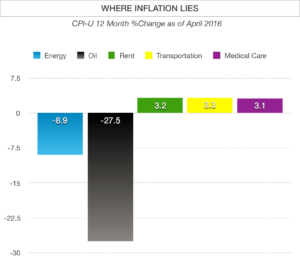 d by the Consumer Price Index (CPI) each month and has been fairly subdued for sometime, until now. The Bureau of Labor Statistics which tracks the CPI reported that prices, as measured by the CPI, increased at the highest rate in three years as of April 2016. This latest report showed prices increasing at annual rate of 1.1%.
 still account for 30% of total euro banknote circulation value. This past month, the ECB decided to terminate the production of the €500 note, in a move to discourage the use of the large note for criminal and illicit purposes. Eurozone officials have found that the €500 note has been the denomination of choice for drug dealers and terrorists to carry large amounts of cash and that is readily exchangeable into other currencies. An irony to the €500 note is the argument to keep it in place, due to negative rates in Europe. With rates below zero for various government bonds in Europe, investors would rather keep their savings in cash as opposed to paying banks to deposit their funds into. Euro’s have become a favored store of value for many, since holding onto cash costs nothing. (Sources: ECB, Eurostat)

 SouthernCents