Joseph SchwSDWIA Bridgearz, CFA 612.355.4365

Stephen Dygos, CFP® 612.355.4364

Benjamin Wheeler, CFP® 612.355.4363

Paul Wilson 612.355.4366

www.sdwia.com

JUNE 2016

Macro Overview

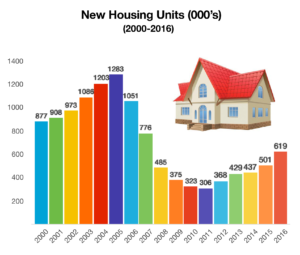
Inflationary pressures are beginning to reveal themselves as U.S. consumer prices recorded their biggest increase in more than three years. Demand for new homes grew as housing starts rose more than expected last month. Such positive economic growth has prompted Fed officials to consider raising rates this summer, stating “its appropriate for the Fed to gradually and cautiously increase rates in the coming months.”

Another rate increase by the Fed would put the Fed Funds Rate at 0.50%, up from its current 0.25% which was the last rate increase in December 2015. The Fed Funds Rate was essentially zero since 2008 when the Fed began its bond buying stimulus program, known as Quantitative Easing (QE).

Oil’s dramatic drop from its highs nearly two years ago has inflicted fiscal hardship on Saudi Arabia. The country has issued debt to fund a drop in oil revenue and plans to sell part of its giant government owned oil company. This past month, rising tensions with other OPEC members led to the firing of the countries oil minister, raising speculation that Saudi Arabia is actively migrating away from being almost entirely dependant on oil exports. A new regulation implemented by the Labor Department in May will now allow “exempt” employees making up to $47,476 a year to earn overtime pay. Exempt employees are salaried workers who work over 40 hours per week but receive no overtime pay.

U.S. crude oil prices reached a 7-month high in May, as prices traded over $50 per barrel, the highest levels since October 2015. U.S. crude prices are represented by West Texas Intermediate (WTI), the benchmark for U.S. produced oil. The price rise came after the U.S. Energy Department released data showing that crude oil inventories had dropped in the U.S. Inventories tend to drop as the economy uses more oil and gasoline going into the summer months.

The European Union and central bankers world-wide are eagerly awaiting Britain’s vote on June 23rd to either stay within the Euro Zone or exit, also known as Brexit. Such a departure could cause riffs across markets in Europe as Britain’s banking and financial system presents a vital component of Europe.

Sources: Federal Reserve, ECB, EuroStat


As of May 2016 the total debt outstanding for the U.S government was $19.2 trillion

U.S. New Home Sales Strongest Since 8 Years – Housing Update

In an effort to better determine the health of the housing market, the U.S. Department of Housing & Urban Development compiles and releases data every month. The most recent data available is, as of April 2016, revealed that sales of new homes increased to an annualized rate of 619,000, the largest increase in eight years. Various factors may account for the increase, including an improving employment market as well as additional homes completed and ready to sell.New Housing Numbers

Sales of new homes versus sales of existing homes, provides a glimpse as to the health and future growth of the housing market. The housing market currently employs over 2 million people, a dramatic difference from the height of the housing market in 2006 when the industry employed over 4 million workers. So as more new homes are built and sold, more builders are hiring workers to build homes. There are 2 million fewer construction workers today than at the 2006 peak, due to many having retired and moved on. The supply of new entrants isn’t sufficient to satisfy builder needs in certain areas of the country. Various factors contribute to how and why more new homes were sold throughout the country, among them being supply, weather, demographics, and job growth.

Sources: Commerce Dept., Dept. of Housing & Urban Development

Who Owns America’s DebtMarket Fact

As of May 26, 2016, total U.S. government debt outstanding was $19.2 trillion. Not only is U.S. debt held by various countries, it is also held by various U.S. government entities.

As oddly as it sounds, the single largest holder of U.S. government debt is the U.S., through its numerous agencies and departments. Contrary to popular belief, less than a third of all U.S. government debt is owned by foreign countries, not the purported fifty percent plus. There are two basic categories of debt; public debt which includes foreign and domestic investors, and federal accounts which are also known as intergovernmental holdings. Federal accounts currently total $5.32 trillion of all government debt and made up of 230 Federal Agencies. The agencies range from the mammoth Social Security Administration with over $2.7 trillion in bonds, to the Department of Energy, Office Foreign Debt Holders of The U.Sof Personnel Management, and the Department of State.

Foreign countries holding U.S. debt total roughly $6.17 trillion, with China and Japan being the two largest owners. As of March 2016, China owns $1.2 trillion of U.S. debt, while Japan has $1.1 trillion.

For the first time ever, the U.S. debt held by Saudi Arabia was released by the Treasury Department in May. It was previously part of the “oil producing nations” category of holders, which didn’t detail the amounts for each country. Saudi Arabia currently owns about $117 billion of U.S. debt, less than India, Taiwan, Belgium, and a host of other countries. Saudi Arabia has previously claimed that it held upwards of $750 billion of U.S. debt, and had used that as a diplomatic tool in dealing with U.S. officials.

Sources: Treasury Dept., Federal Reserve

 
Because of their confidence in the economy's growth the Fed is on schedule to increase rates

Fixed Income UpdateGlobal Bond Markets

The Fed is ready for a rate increase this summer as comments made by Fed officials in May validated their confidence in the economy’s growth and rising inflationary pressures.

Low to negative bond yields in Europe and Japan are costing bond investors billions. Fitch, a bond rating agency, released a statement in May detailing how negative yields impact investors. It estimates that there is roughly $10 trillion of negative yielding debt worldwide, in turn costing investors about $24 billion annually. With the average negative yield being -0.24% on $10 trillion, it costs bond investors $24 billion annually. Conversely, the average yield on the same bonds five years ago were 1.23%, producing $123 billion annually. The ultra low yields are primarily impacting pension funds holding negative yielding debt because the returns earned help pay down any pension liabilities. Lower yields are also influencing investors to shift to higher yielding and more volatile bonds.

Some similarities between Greece and Puerto Rico emerged in May, as Puerto Rico received a form of debt relief for about $120 billion of bonds coming due this month. The House and Senate reached a deal that would give the U.S. Territory of Puerto Rico the ability to forgo paying on some of its debt as well as not impose U.S. minimum wage rates for residents under 25. Puerto Rico has already defaulted on several of its bond payments due in May. A declining economy and migration of citizens out of the country have led to the current circumstances.

Sources: Fitch, Eurostat, Bloomberg

Oil Prices Hit 7 Month High – Commodities Update

U.S. crude oil prices, as measured by the West Texas Intermediate (WTI) benchmark reached a 7-month high in May, as prices traded over $50 per barrel, the highest levels since October 2015. The price rise came after the U.S. Energy Department released data showing that crude oil inventories had dropped in the U.S.. Inventories tend to drop as the economy uses more oil and gasoline going into the summer months.

WTI prices have almost doubled from a year ago as supply of and demand for oil worldwide have started to rebalance. Oil analysts believe that if prices move above $50 per barrel, it will spur additional production by U.S. drillers, as their profit margins increase with higher prices. As long as the extra production is consumed by an increase in demand, then prices should stay about the same if not elevate further.

Sources: U.S. Dept. of Energy

Crude Oil Prices

 
CPI reported prices have increased at the highest rate in three years as of April 2016

Here’s Where The Fed See’s Inflation – Monetary Policy

The Federal Reserve operates under a dual mandate, with three key objectives for monetary policy (which the Fed sets) to accomplish: Maximum employment, moderate long-term interest rates, and stable prices. Two of these three have been validated for the most part, with unemployment at 5%, and long term bond yields above short term bond yields. Stable prices (also known as inflation control) is monitored and released by the Consumer Price Index (CPI) each month and has been fairly subdued for sometime, until now. The Bureau of LaWhere Inflation Lies
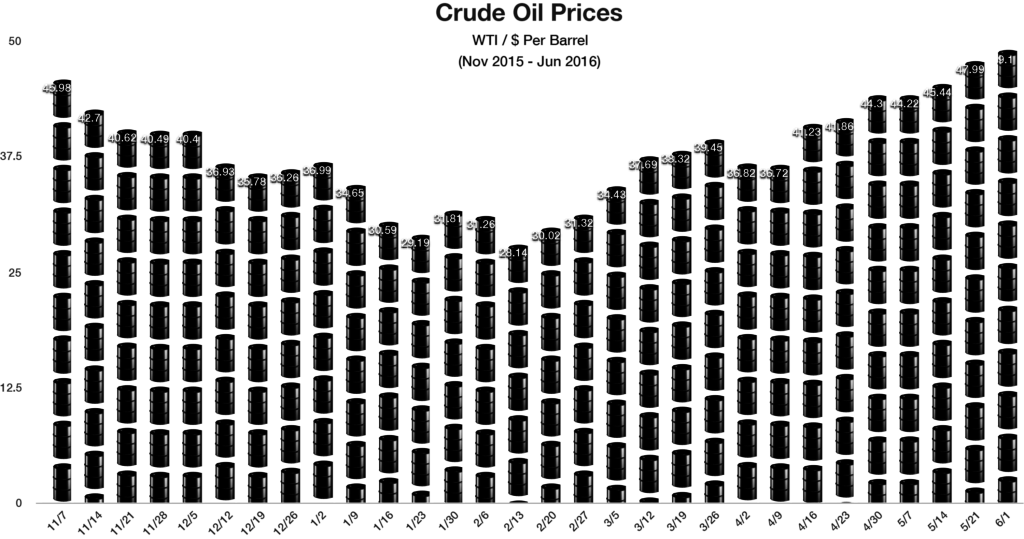
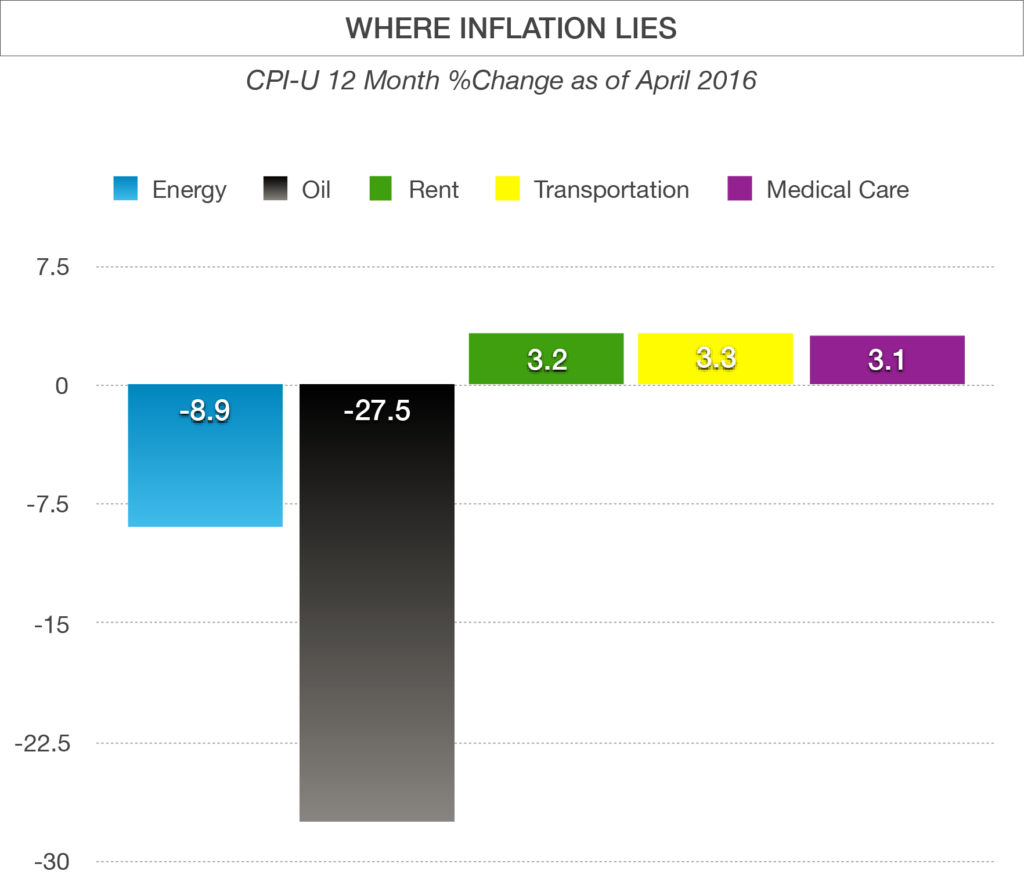
bor Statistics which tracks the CPI reported that prices, as measured by the CPI, increased at the highest rate in three years as of April 2016. This latest report showed prices increasing at annual rate of 1.1%.

A 1.1% rate may not sound like much, but the data hidden within this number reveals something that the Fed may be concerned with. When broken down, the categories with the largest price increases nationwide were medical care services, transportation, and rent. What’s amazing is that the CPI increase would have been much higher if it wasn’t for the dramatic drop in energy and oil prices.

The Fed considers various aspects of the economy and the country’s demographics when drafting its monetary policy. The fact that American’s are aging and are requiring more medical attention is an inflationary threat for retirees. In addition, many younger American’s are still having a very difficult time in securing mortgage loans, thus forcing young families to rent rather than buy. Such a dynamic has increased demand for rentals nationwide, forcing rents to rise until more supply is made available.

Sources: Bureau of Labor Statistics, Federal Reserve

Equity Markets Overview – Domestic Stocks

U.S. equity indices were essentially flat for the month of May, as the S&P 500 and the Dow Jones Industrial Average both were up moderately for May. Analysts are starting to question earnings growth and profitability among some sectors as the term “profits recession” has been widely used. In addition to fundamental concerns such as earnings, other issues with behavioral, tightening credit conditions, and the election in the fall are leading to greater uncertainty.

Many analysts believe that the beginning of the year turmoil that followed the Fed’s rate hike in December may not be replicated, as the equity markets may have already priced in a rate increase. Energy sector earnings have hindered equity indices for months as profits dropped, but are expected to rebound as oil prices have risen.

Sources: Bloomberg, S&P, Dow Jones, Federal Reserve