Ocean Park Capital Management

2503 Main Street

Santa Monica, CA 90405

Main: 310.392.7300

Daily Performance Line:  310.281.8577

May 2020
Market Update
(all values as of 06.28.2024)

Stock Indices:

Dow Jones 39,118
S&P 500 5,460
Nasdaq 17,732

Bond Sector Yields:

2 Yr Treasury 4.71%
10 Yr Treasury 4.36%
10 Yr Municipal 2.86%
High Yield 7.58%

YTD Market Returns:

Dow Jones 3.79%
S&P 500 14.48%
Nasdaq 18.13%
MSCI-EAFE 3.51%
MSCI-Europe 3.72%
MSCI-Pacific 3.05%
MSCI-Emg Mkt 6.11%
 
US Agg Bond -0.71%
US Corp Bond -0.49%
US Gov’t Bond -0.68%

Commodity Prices:

Gold 2,336
Silver 29.43
Oil (WTI) 81.46

Currencies:

Dollar / Euro 1.06
Dollar / Pound 1.26
Yen / Dollar 160.56
Canadian /Dollar 0.73

Portfolio Overview

Ocean Park Investors Fund rose 8.63%* in May and substantially outpaced all the major indices, including the S&P 500 which gained 4.53%.  In addition, the fund outperformed the HFRI Equity Hedge Index, which rose 3.88%.  For the year to date through May, the fund was up 5.20%* while the S&P 500 was down 5.77% and the Dow was down 11.06%.  Significantly, we achieved these results while maintaining the modest hedge which we discussed in last month’s newsletter.  Several portfolio stocks generated outsized gains, including Twilio (up almost 70% for the month) and Lululemon (up 30%).

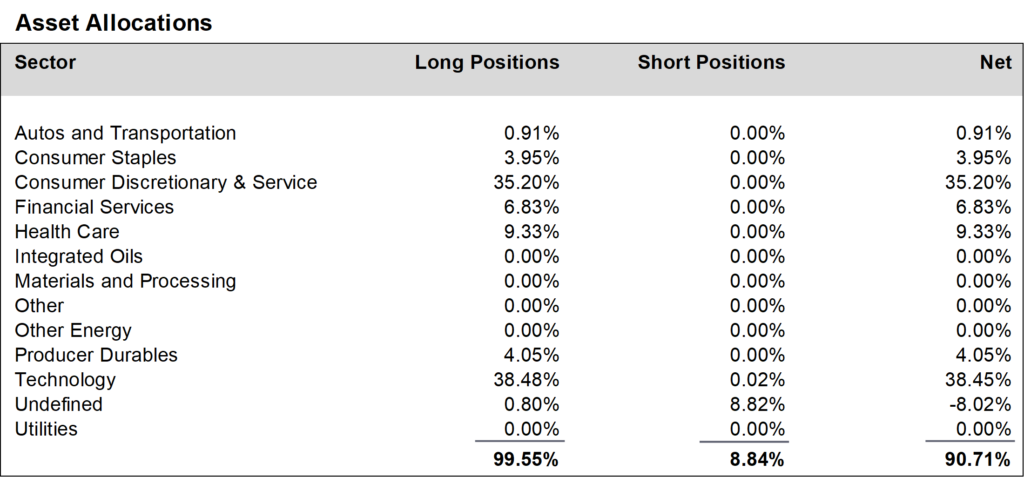
During May, we increased positions in the technology sector and reduced positions in the consumer discretionary and service sector.  We finished the month at about 91% net long, up from about 89% at the end of April.


Daily updates on our activity are available on our Results Line, at 310-281-8577, and current information is also maintained on our website at www.oceanparkcapital.com. To gain access to the site enter password opcap.

*These results are pro forma. Actual results for most investors will vary. See additional disclosures on page 4. Past performance does not guarantee future results.

 
Equity Overview

Equity Overview

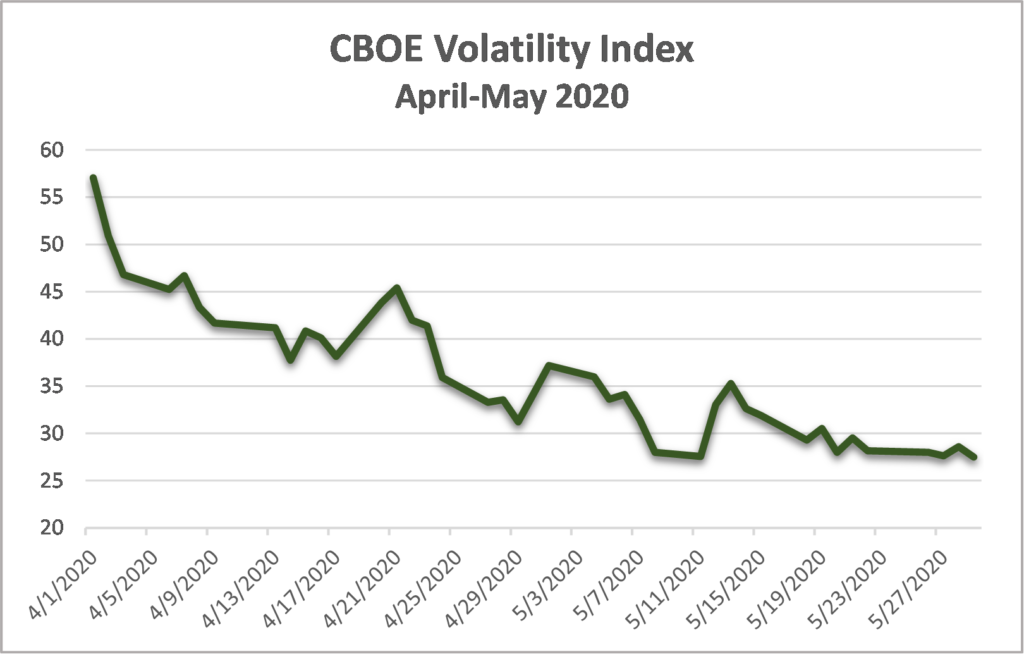
All sectors gained ground in May, with technology and consumer stocks among the leaders.  Growth stocks again outperformed value stocks.  Volatility continued to decline.

1st quarter corporate earnings reported in May reprised the mediocre results in April.  With 97% of S&P 500 companies now reporting, the blended growth rate was negative at -14.6%.  Earnings and revenue beats were lackluster: only 64% of companies beat consensus earnings estimates and 56% beat consensus revenue estimates–in both cases, below the one-year and five-year averages.

However, as the market begins to price in an eventual resolution of the Covid-19 pandemic, it has rewarded beats more and punished misses less than in previous quarters.  During the period from two days before their earnings report to two days after the report, companies that beat consensus earnings estimates generated an average price increase of 1.5%, which is above the 5-year average of 0.9%.  And companies that missed consensus earnings estimates generated an average price decrease of -0.5%–far better than the average decrease of -2.8% sustained by such companies in the previous 20 quarters.


Macro Overview

Macro Overview

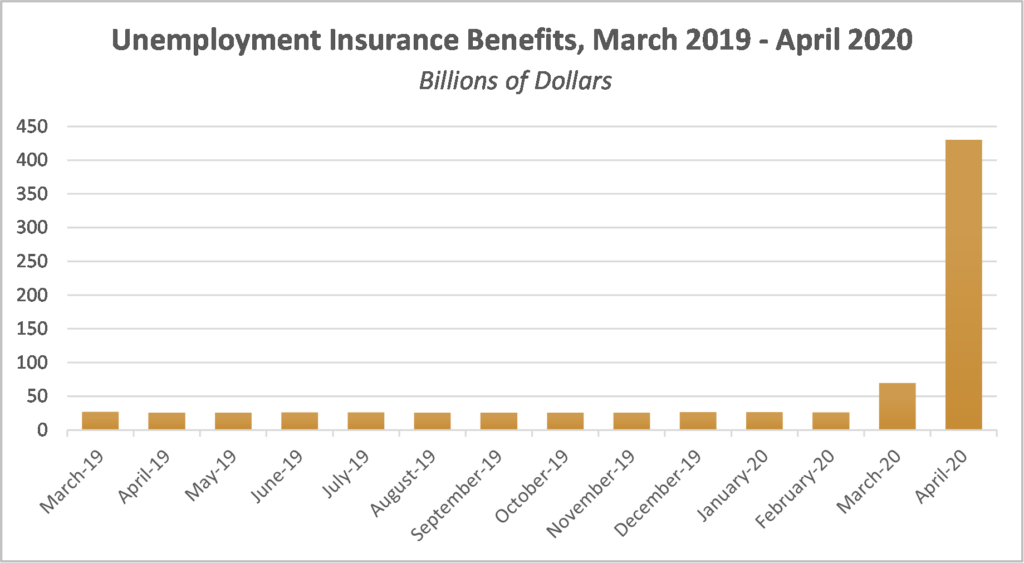
Economic data reported in May echoed the grim numbers in April.  The Commerce Department revised its estimate of first quarter GDP downward, from -4.8% to -5.0%.  The unemployment rate rose to 14.7%, the highest rate since the Great Depression.  Monthly federal unemployment benefits totaled $430-billion, versus an average over the previous five years of $29.5-billion.  Manufacturing continued to decline and retail sales plunged by the largest amount on record.

Amid the ashes, however, some green shoots appeared.  Consumer confidence as measured by the University of Michigan increased incrementally, reflecting the initial reopening of the economy in most states.  And in a Labor Department survey of newly laid-off workers, 90% reported that their job loss was temporary, i.e., a furlough and not a termination.  This suggests that it will be easier for them to return to their jobs, at least for those employees whose companies have survived the shutdown.

As in April, the markets in May shrugged off the bad news and posted significant gains.  Last month, analysts pointed to stabilization in the oil market and extraordinary intervention by the Fed.  This month, analysts highlighted the resumption of economic activity and increased expectations that a vaccine or reliable treatment for Covid-19 will emerge sooner rather than later.  Whether any of these factors will prove to have justified the market recovery is an open question.  Time will tell.


Additional Disclosures

Additional Disclosures

Performance data for OPI reflect the reinvestment of dividends and other earnings on the fund’s assets.  Performance data for the major indices reflect only changes in the value of those indices, and would be higher if dividends were included. However, the index data do not reflect fees that would be paid to index fund managers and transaction costs that would be incurred when their component stocks are bought or sold, while OPI’s data do reflect quarterly fees and expenses incurred by the fund.  The information provided is believed to be reliable, but its accuracy or completeness is not warranted. This material is not intended as an offer or solicitation for the purchase or sale of any stock, bond, mutual fund, or any other financial instrument. The views and strategies discussed herein may not be appropriate and/or suitable for all investors. This material is meant solely for informational purposes, and is not intended to suffice as any type of accounting, legal, tax, or estate planning advice. Any and all forecasts mentioned are for illustrative purposes only and should not be interpreted as investment recommendations.