March 2017
Market Update
(all values as of 04.30.2024)

Stock Indices:

Dow Jones 37,815
S&P 500 5,035
Nasdaq 15,657

Bond Sector Yields:

2 Yr Treasury 5.04%
10 Yr Treasury 4.69%
10 Yr Municipal 2.80%
High Yield 7.99%

YTD Market Returns:

Dow Jones 0.34%
S&P 500 5.57%
Nasdaq 4.31%
MSCI-EAFE 1.98%
MSCI-Europe 2.05%
MSCI-Pacific 1.82%
MSCI-Emg Mkt 2.17%
 
US Agg Bond 0.50%
US Corp Bond 0.56%
US Gov’t Bond 0.48%

Commodity Prices:

Gold 2,297
Silver 26.58
Oil (WTI) 81.13

Currencies:

Dollar / Euro 1.07
Dollar / Pound 1.25
Yen / Dollar 156.66
Canadian /Dollar 0.79
 

Macro Overview

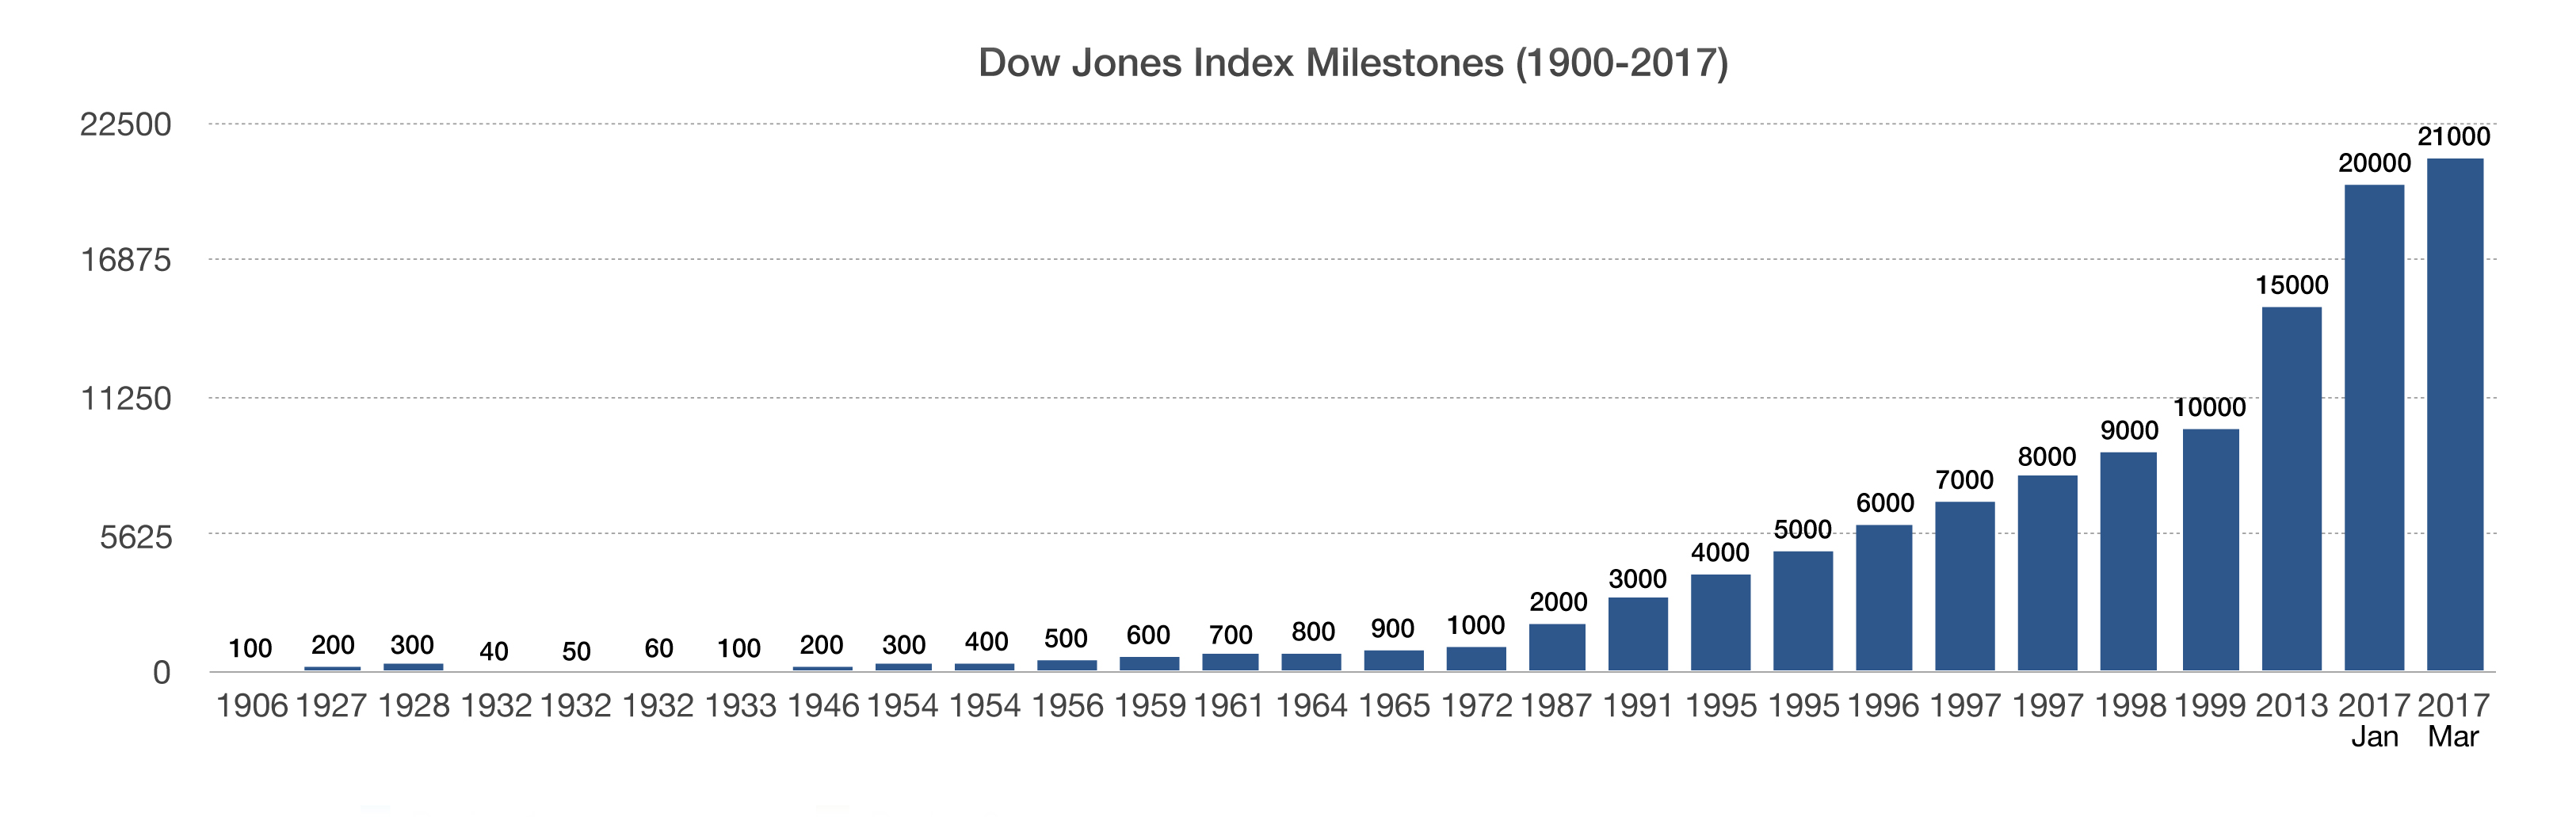
Equity indices had their longest streak of record closes since January 1987, with the Dow Jones Industrial Average reaching 21,000, its second milestone in less than 30 days after reaching 20,000. It took the Dow only 24 trading days to elevate from 20,000 to 21,000, tying a record set in 1999.

Executives from 16 major U.S. companies urged Congress to pass a comprehensive rewrite to the U.S. tax code, including implementing a controversial border tax. Many U.S. companies believe that a border tax would make their products more competitive in the international markets. The border tax proposal has also drawn criticism from U.S. companies such as automobile manufacturers and retailers that require imports and whose margins would fall with border tax payments.

Reflation has become the new inflation as growth expectations are heating up prices, production costs, and wages. Higher wages eventually lead to inflationary pressures because employers pass higher costs along to consumers. Some higher prices for consumers are expected with President Trump’s proposals, yet at the same time rising wages may offset higher prices.

U.S. retail stores are struggling due to e-commerce competition and slowing mall traffic. The downturn has led to the highest level of credit distress among the sector since the recession of 2008-2009, according to Moody’s Credit Rating agency.

The anticipation that Congress might start repealing portions of Dodd-Frank banking regulations, signed into law following the financial crisis, is driving bank sector stocks higher.

The Federal Reserve made its first rate decision under the Trump administration in February, leaning towards a rate increase as early as March.

The Tax Policy Center, a nonpartisan independent entity in Washington, believes that the tax proposals presented by the president may not become effective until 2018 at the earliest since passage by Congress takes time.

Due to IRS efforts to prevent fraud, tax refunds will be delayed for households claiming the Earned Income Tax Credit (EITC) and the Additional Child Tax Credit (ACTC). It is estimated that about 25 – 30 million households will need to wait to get their refunds creating cash flow disruptions in February and March. Historically, tax payers receiving refunds tend to spend the funds almost immediately.

The Department of Labor is delaying the fiduciary rule from going into effect until June 9th. It was originally scheduled to become effective April 10th, but the department has decided to allow more time to solicit feedback from industry professionals and the public. The fiduciary rule is only affecting retirement accounts for the time being, requiring that investment advisors put the best interests of the investor first.

Sources: Labor Dept., IRS, Fed, Dow Jones, S&P


It Took 27 Years For The Dow Jones Index To Reach 100 Again

Equity Update – Domestic Stock Market Overview

Equity indices had their longest streak of record closes since January 1987 as positive sentiment swept the markets, propelling the major equity indices to new highs. The S&P 500’s market capitalization attained $20 trillion for the first time ever, a dramatic increase over the past few months.

The Dow Jones Industrial Average reached 21,000, its second milestone in less than 30 days after reaching 20,000. It took the Dow only 24 trading days to elevate from 20,000 to 21,000, tying a record set in 1999 for the shortest period between 1000 point milestones. Albeit, the Dow was at a much smaller level in 1999, making that move much larger on a percentage basis.

Market pundits believe that we have officially been in a bull market cycle for the past eight years, as major equity indices have continued to hit new highs since 2008. Many analysts and economists are linking the market’s eight-year run to the Fed’s monetary easing program, producing ultra low rates and yield seekers.

Bank sector stocks elevated as the expectation that Dodd-Frank regulations would be alleviated as well the Fed positioning for a rate hike fairly soon. Banks tend to perform better with less regulation and a higher interest rate environment.

Sources: Dow Jones, S&P, Reuters


Fixed Income Update – Interest Rate Overview

The 10-year Treasury yield fell to levels not seen since November 2016 when markets were still pensive about the outcome of the presidential election. The retreat of Treasury bond yields may signal that the strong asset flows into equities may be easing up.

Comments by Federal Reserve members in February signaled a solidifying stance for a rate hike as soon as March. Fed member William Dudley cited “sturdy job gains, increase in inflation, and rising optimism among business owners” as viable reasons for higher rates.

Bond yields stopped rising in February and reversed course as lower yields became the norm. Equity investors hesitated at the end of February and reallocated some assets to bonds, driving fixed income prices higher.

Sources: Bloomberg, Federal Reserve


The U.S. Is Expected To Be A Net Energy Exporter By 2026

First Brexit……….Now Frexit – International Update

A similar sentiment that encouraged British voters to exit the EU is now influencing French voters to possibly do the same. Upcoming Presidential elections in France on April 23rd will determine the country’s future in the EU, as a popular candidate, Marine Le Pen, is an advocate of having France exit the EU.

A growing concern in Europe is that a domino effect may take hold as the sentiment to exit the EU spreads to other countries. Upcoming elections in Lithuania, Austria, Netherlands, and Germany may yield additional candidates that also favor an EU exit. Of the 28 EU member countries, France currently has the third largest economy after Germany and the UK, which voted to leave the EU in 2016.

A flight to safety following uncertain political ramifications in Europe drove yields on two-year German government bonds into negative territory in February.

Sources: Eurostat, Bloomberg


Oil Imports Into The U.S. Slowing – Commodities

For decades, the United States has relied on oil and petroleum imports in order to meet demand. Following the second world war, demand for gasoline and petroleum in the U.S. rose dramatically as economic growth and automobiles drove demand up. The Arab Oil Embargo of 1973-1974 tested the United States and its tolerance for reliance on the valuable commodity. As the embargo ended, oil prices normalized and imports increased as demand strengthened. The recession of 1990-1991 saw a drop in imports as demand fell due to a sluggish economy. The economic growth of the 90s and early 2000s saw a steady increase in imports, until the Energy Policy Act was passed in 2005.

The act incentivized energy companies to explore and expand in the U.S. while also being conscience of environmental impacts. Hydraulic fracturing, also known as fracking, had been used for decades but became incredibly popular as regulations that had limited its expansion were revised. Today over half of all domestically produced oil originates from fracking, dramatically decreasing the demand for imported oil and petroleum products.

In its Outlook 2017, the EIA is projecting that the United States will become a net energy exporter by 2026, thus eliminating all oil imports within nine years.

Sources: EIA, Department of Energy


Auto Loans & Student Loans Are Growing Among Younger Borrowers

How The Fed Balance Sheet Will Affect Mortgage Rates – Monetary Policy

Following the financial crisis of 2008/2009, the Federal Reserve orchestrated an ambitious stimulus program of buying enormous amounts of U.S. government debt and mortgage securities. Over the past eight years, these efforts ballooned the balance sheet of the Federal Reserve to over $4.5 trillion, compiled of both Treasuries and MBS (Mortgage Backed Securities).

This past month, several Fed officials raised the topic of alleviating the large amounts of mortgage debt on the Fed’s balance sheet. The accumulation of debt by the Fed has basically provided a temporary fix to the financial crisis. Now the Fed has reached the point to start unwinding its gigantic portfolio of both Treasuries and mortgage bonds.

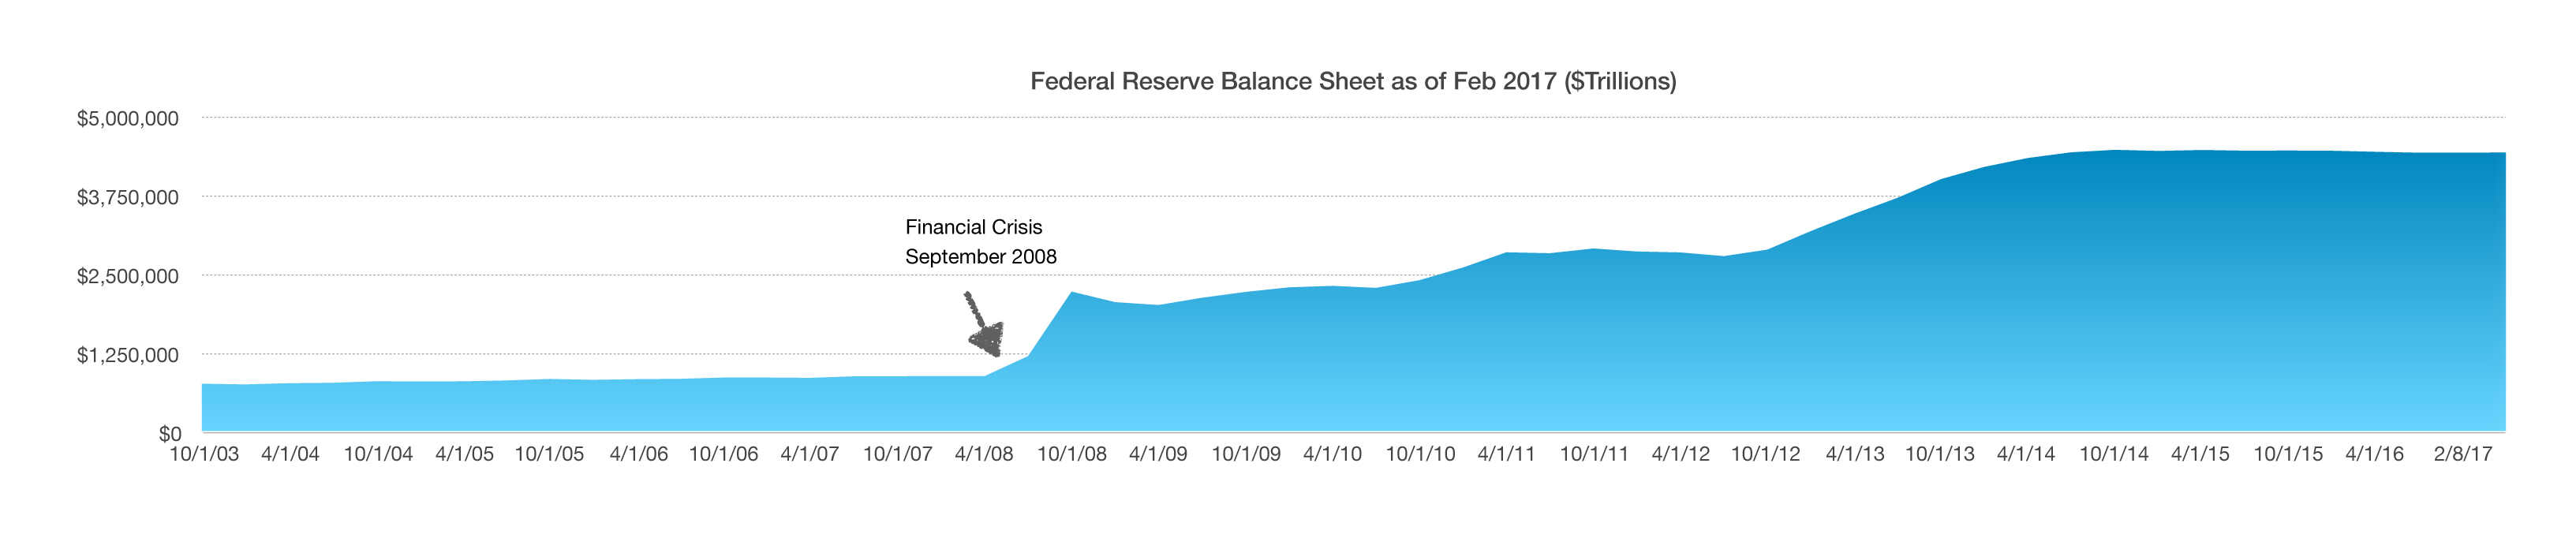
Many bond traders expect that as MBS bonds start to flow off the Fed’s balance sheet, it will allow private buyers such as mutual funds and pension funds to essentially take over the buying from the Fed. The hope is that in conjunction with alleviation of certain Dodd-Frank rules that limit trading by banks and financial institutions in government securities, these two dynamics may encourage new market participants to become buyers of what the Fed is selling. (Sources: Fed, U.S. Treasury)

Household Debt On The Rise Again – Consumer Finance

According to data from the Federal Reserve Bank of New York, total household debt climbed to $12.58 trillion at the end of 2016, an increase of $460 billion for the year, making it the largest increase in almost a decade. The current amounts are almost equal to the debt levels Americans had in 2008, when total consumer debt reached a record high of $12.68 trillion.

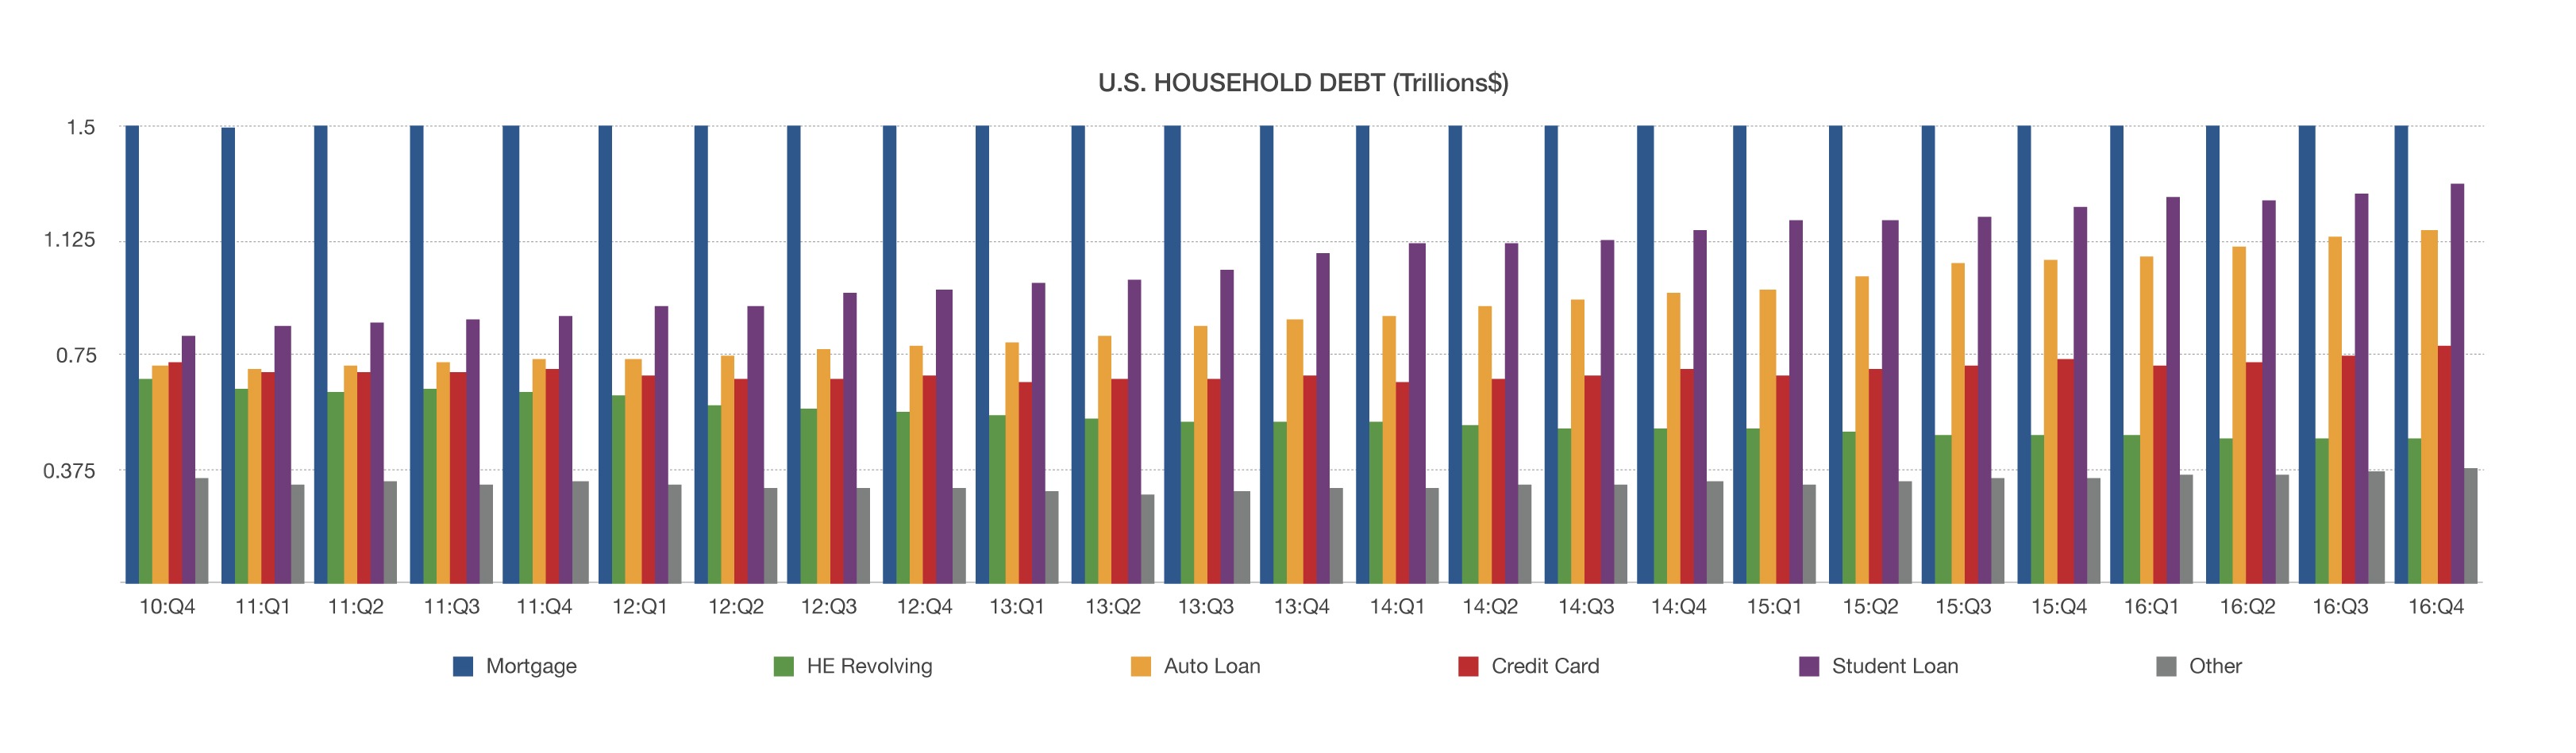
The recent increase in total overall debt is primarily attributable to a steady rise in both student and auto loans. (Sources: Federal Reserve Bank of New York)


What a Market Top Looks Like

What a Market Top Looks Like (by Bob Veres)

The current bull market in stocks will reach its 8th anniversary tomorrow, and for about the last four years, professional investors and financial planners have been scratching their heads.  The markets have gone up and up and up, and we all know that they won’t go up forever, which means there’s a correction looming somewhere on the horizon.

The problem is that the wisest professionals generally know what a market top looks like—and what it doesn’t.  For most of those eight years, investors were constantly looking over their shoulders, waiting for the next shoe to fall, being very cautious about their stock allocations.  As long as that generalized anxiety persisted, it was unlikely that we would see the exuberance and overconfidence that typically precedes a major market decline.

The markets generally top out when the average person starts feeling like he or she is missing out on future returns.  Suddenly money that has been on the sidelines for years starts to flow back into the market, causing it to rise faster than it ever did during the buildup early years of a bull market.  You start to see pundits, touts and market prognosticators get really enthusiastic.  Nobody could see any sign of that swell of overconfidence—

Until now, with what Wall Street has been calling The Trump Trade.  The trade means that people everywhere are investing in anticipation of lower corporate taxes and fewer regulations.

An excellent description of how to spot a market top was published on the MarketWatch website, entitled “7 Signs We’re Near a Market Top, and What to Do Now.”  What are the signs?  The first one is when you see retail investors start pouring money into stock mutual funds, in fear of missing out on another year of growth.  Second: the survey of professional investors starts showing a low proportion of bears to bulls, basically meaning that the bear market prognosticators (and there are some who nearly ALWAYS predict one) start to give in. 

Third, market sentiment indicators like the VIX index (that tells us what traders think of future market volatility) start to look complacent.  Fourth: you see record price/earnings ratios, which means people are ignoring value and simply expecting future growth.  Fifth: investors are finally starting to forget the last market crash, and have stopped looking over their shoulders.  Sixth, the article says that the Nasdaq index of mainly tech stocks will begin a bull run.  And seventh, investors reach a tipping point where greed outweighs fear.  Instead of fearing a market pullback, they fear missing out.

Does any of this look familiar when you look at today’s markets? 

To many professional investors, the signs are everywhere that the investment markets have finally reached those last heady stages of a bull market, when prices begin to soar faster than they ever did in the runup.  You can’t expect a major, painful bear market until those conditions have been met, and we’re finally meeting them now.  You’re going to hear that earnings per share for American corporations have been beating expectations in the latest quarter, but as the chart shows, the margin has shrunk.


What a Market Top Looks Like (continued)

What a Market Top Looks Like (by Bob Veres)

With all this wisdom and insight, what’s the best course of action?  Trying to time the market is never a good strategy.  Even though valuations are high right now, there is no good reason, with all the euphoria, that they won’t keep getting higher—and the euphoria could last days, weeks, months… or years.  If you get out now, there’s a good chance you’ll miss the most exciting part of the bull market. 

More importantly, if you get off of the roller coaster and do manage to miss the next dip, how will you know when to get back in again?  Bear markets have a habit of suddenly reversing themselves, and it’s possible that by the time you feel confident that the market is finally on an upswing, you’ll be buying at prices higher than what you sold for.

A better possibility is to quietly start to raise the cash allocation in your portfolio, with the idea that when the bear market finally does manifest, you’ll have money to invest at bargain prices.  This isn’t for the faint-hearted, however, since it’s tough to miss the last stage of a roaring bull, and even tougher to re-invest when everybody else is selling ou

A safer way to weather the storm is to simply hang onto the restraining bar in your roller coaster seat and endure the bumpiest part of the ride.  If you believe that stocks will eventually recover, as they always have in the past, then eventually you’ll be looking at gains again while a lot of your friends and neighbors will have sold near the bottom in the last stages of a bear market capitulation.

Most importantly, you should recognize that the best, most seasoned market watchers can and will be way off on their timing.  You can’t rely on any of us to know the future.  That MarketWatch article that talked about the seven signs of a market top?  It advised people to start edging out of the market as soon as possible, because the red flags, it said, were everywhere.

And it was published in March, 2014.

Sources: http://www.marketwatch.com/story/7-signs-were-near-a-market-top-and-what-to-do-now-2014-03-07

http://www.marketwatch.com/story/why-the-end-of-the-earnings-recession-doesnt-guarantee-stock-market-gains-2017-03-08

 
Executive Compensation Bloat

Executive Compensation Bloat (by Bob Veres)

We heard a lot about income inequality and the stagnating incomes of middle class Americans on the campaign trail last year, and Wall Street firms that mostly move money around rightly got some of the blame.  But hardly anybody talked about how CEOs routinely loot the treasuries of their own companies, taking money out of the pockets of stock investors and shareholders who they theoretically work for.

How does this happen?  Many public companies are run by CEOs who staff their compensation committees with cronies and buddies, who then turn around and approve huge salaries and stock incentives to the CEO.  Often, the committee will compare their CEO’s salary with a comparable group of other chief executives who are also getting enormous pay raises.  This circular process creates an artificial rising tide that lifts compensation packages in the C suites while doing nothing for the workers who actually make the products or provide the labor that the company sells to generate profits.

How big is this problem?  According to an organization called GlassDoor.com, which collects salary data anonymously from public companies, the average CEO made about 20 times the average salary of the company’s workers in 1965.  Since then, inflation-adjusted CEO compensation has increased an astonishing 997 percent, which is double the stock market growth over that same period, and substantially greater than the 10.9% total growth in a typical worker’s annual compensation.  Some CEOs, like David Zaslav of Overy Communications, earn 1,951 times what his company’s average worker makes.  Chipotle CEO Steve Elis’s $29 million in total pay was calculated to be 1,522 times more than the average Chipotle worker’s pay, and Walmart CEO Douglas McMillon’s $25.5 million compensation was 1,133 times what the greeters and cash register people make when they serve their customers.

Don’t shareholders rise up in protest?  In most cases, no, and the problem is aggravated by the fact that so much stock is now held in index funds.  More than 25% of all large company stock is in mutual fund portfolios on behalf of investors.  Many funds refuse to vote on shareholder activist initiatives, while others, like the index funds run by Vanguard, can’t pull their money out of a company without introducing a deviation in their holdings compared to the index they’re supposed to be tracking.

You can expect to hear more about the ratio between CEO and median worker pay.  The Dodd-Frank Act, passed in response to the global economic crisis of 2008, requires companies to share their ratios beginning this year.  If you were shocked by the numbers you read here, then you can expect many Americans to be alarmed when routinely published data shows how far their income has fallen behind the cozy residents of America’s C suites.

Sources: 

https://www.bloomberg.com/view/articles/2017-03-06/excessive-ceo-pay-for-dumb-luck

http://www.payscale.com/data-packages/ceo-pay

https://www.glassdoor.com/research/ceo-pay-ratio/

 
Longer Lives, Here and Abroad

Longer Lives, Here and Abroad (by Bob Veres)

For years, the U.S. life expectancy was among the longest in the world, a natural byproduct of the fact that the U.S. is wealthier, per capita, than other nations.  Indeed, a research report in the medical journal The Lancet projects that between now and 2030, women in the U.S. will live an average 83.3 years (up from 81.2 today) and men an average of 79.5 years (up from 76.5 today).

The report analyzed data on mortality and longevity patterns from 35 industrialized nations, both high-income and emerging.  American longevity increases are surely encouraging, but the more interesting part of the study is how the rest of the world is catching up and even surpassing American seniors.  South Korean women are projected to live to an average age of 90 years in 2030, and women in Spain, Portugal, Slovenia and Switzerland will see average lifespans above 87.  South Korea, the Netherlands, Australia Denmark and Switzerland will all see their male citizens survive, on average, beyond age 80.  Gains in Mexico and the Czech Republic will put lifespans there, for both men and women, to levels comparable to the U.S. by 2030.

Why is the U.S. not progressing as fast as other countries?  The report and some of the research around the report note that the U.S. has high obesity rates and our diets are not as healthy, per capita, as some of the leading nations.  South Korea has invested in childhood nutrition and medical technology, and although the U.S. spends more of its total GDP on healthcare than any other nation, the quality of health tends to be top-heavy; the richer Americans can afford much better care than their less-wealthy counterparts.

Sources:

https://www.washingtonpost.com/news/to-your-health/wp/2017/02/21/us-life-expectancy-will-soon-be-on-par-with-mexicos-and-croatias/?tid=sm_tw&utm_term=.cb737a6fb684

http://www.cnn.com/2017/02/21/health/life-expectancy-increase-globally-by-2030/index.html

 
Not “If;” “When”

Not “If;” “When” (by Bob Veres)

You’re starting to hear people talk about “if” there’s a bear market during the Trump Administration, when the real truth is they should be talking about “when.”  And it won’t necessarily be triggered by a poorly-worded tweet, a global-trade-stopping new tariff regime or tax and entitlement reform.  Every presidential cycle has its share of market drawdowns, seemingly regardless of presidential policies.

You don’t believe it?  The accompanying chart shows the worst stock market drawdowns for every president since Herbert Hoover in the 1930s, and you can see that good president or bad, Republican or Democrat, they all eventually experienced significant down markets.  Some might be surprised to see Ronald Reagan’s 25% and 33% drop from high to low, or the nearly 52% drawdown experienced during George W. Bush’s presidency.  Weren’t these pro-business Presidents?

What the chart doesn’t show, but you know already, is that after every single one of these scary drops, the markets recovered to post new highs, which we’re experiencing today.  So don’t listen to anybody who talks about “if” the markets are eventually going to go down sometime in the next four years.  We’re going to experience a bear market—time, date, duration and extent unknown.  And then, if history is any indication, we’ll see new highs again eventually.

Source:

https://www.bloomberg.com/view/articles/2017-01-25/who-s-president-doesn-t-matter-that-much-to-the-stock-market?curator=thereformedbroker&utm_source=thereformedbroker

 
Goodbye, My Friend

Goodbye, My Friend

Life seldom proceeds along the path we imagine or hope. As we were preparing the February newsletter (my apology that a technical issue prevented its distribution), a new planning client who had fast become one of my favorite people died quite unexpectedly. Although he had just turned 70, the number of years my grandfather often said were all the Almighty had promised, my friend still had so much life yet to give (yes, give). Professionally, he was still expanding the knowledge of his field. Personally, he was still in demonstrable love with his bride of 47 years. Socially, he was a man of enormous faith, boundless yet hidden generosity, and childlike humor. He enthusiastically served his God, his country (US Army Bronze Star), his community, and his family.

I had selfishly hoped to have five more years to implement his financial plan and many subsequent years to enjoy his company. But, I was reminded anew that certain elements of your financial plan must always be complete regardless of where you think you are in your life’s journey.

These are but a few of the technical things that should always be complete within your financial plan. However, for many families (fortunately not within my friend’s family), there is a much more important question. Are you at peace in your relationships? Have you done your part to heal those relationships whose broken status weigh on your heart? Those are the things that money truly cannot buy.

Regards,

Wayne Firebaugh