Ocean Park Capital Management

2503 Main Street

Santa Monica, CA 90405

Main: 310.392.7300

Daily Performance Line:  310.281.8577

February 2019
Market Update
(all values as of 04.30.2024)

Stock Indices:

Dow Jones 37,815
S&P 500 5,035
Nasdaq 15,657

Bond Sector Yields:

2 Yr Treasury 5.04%
10 Yr Treasury 4.69%
10 Yr Municipal 2.80%
High Yield 7.99%

YTD Market Returns:

Dow Jones 0.34%
S&P 500 5.57%
Nasdaq 4.31%
MSCI-EAFE 1.98%
MSCI-Europe 2.05%
MSCI-Pacific 1.82%
MSCI-Emg Mkt 2.17%
 
US Agg Bond 0.50%
US Corp Bond 0.56%
US Gov’t Bond 0.48%

Commodity Prices:

Gold 2,297
Silver 26.58
Oil (WTI) 81.13

Currencies:

Dollar / Euro 1.07
Dollar / Pound 1.25
Yen / Dollar 156.66
Canadian /Dollar 0.79
 

Fund Overview

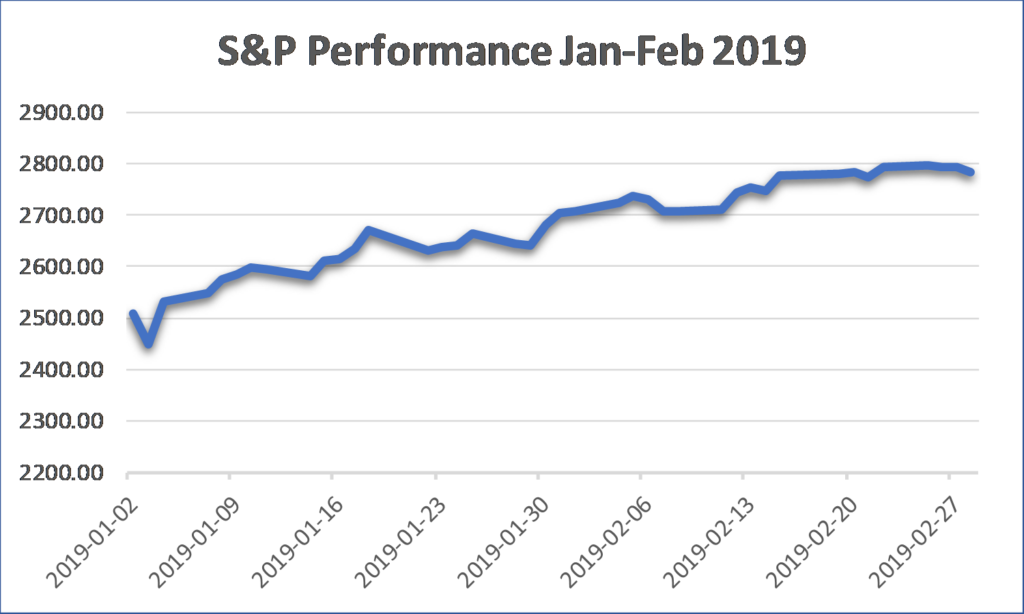
Equities continued their broad-based rally in February, as did the Ocean Park funds.  The funds outperformed all the major indices, as well as the HFRI Equity Hedge Index, which rose 1.79%.  Technology stocks were particularly strong.  The funds also generated outsized gains from some less-followed stocks, such as Cyber-Ark Software and Etsy, as well as from a short position in Weight Watchers.

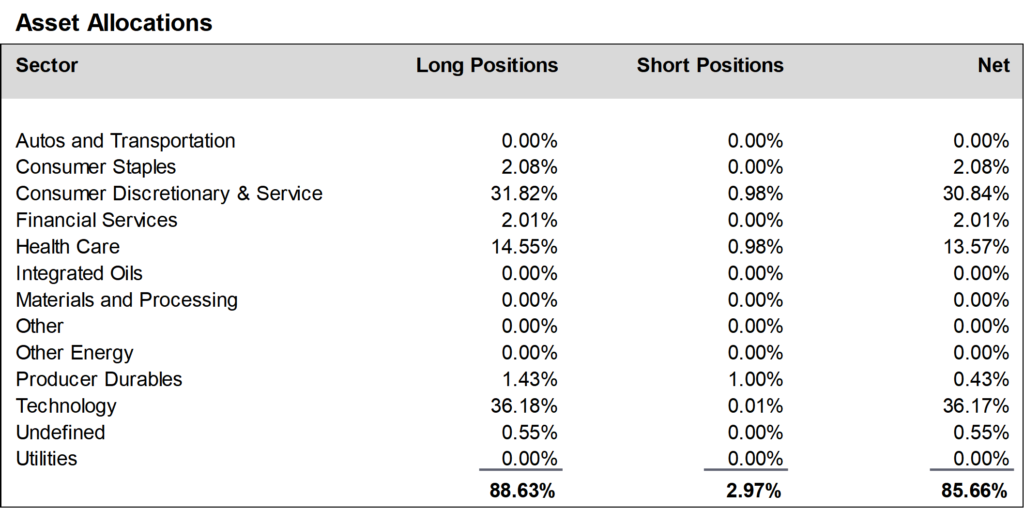
During February, we added to positions in the technology sector and reduced positions in the consumer discretionary and service sector and the producer durables sector.  We ended the month at about 86% net long, up from about 85% in January.

A schedule showing the performance of the Investors Fund is included below, along with our Asset Allocation Chart. Daily updates on our activity are available on our Results Line, at
310-281-8577, and current information is also maintained on our website at www.oceanparkcapital.com. To gain access to the site enter password opcap.


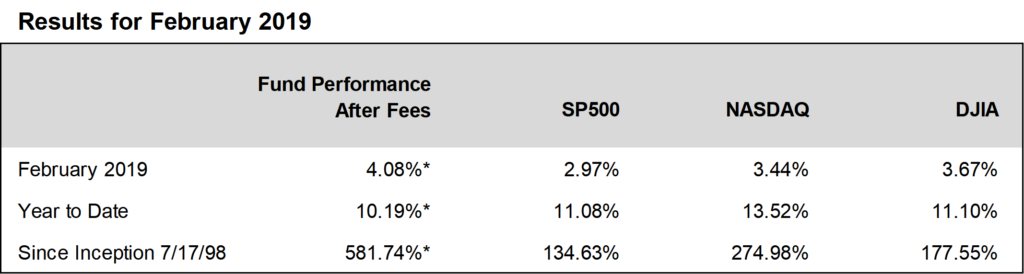
*These results are pro forma. Actual results for most investors will vary. See additional disclosures on page 4.
Past performance does not guarantee future results.

 
Equity Overview - February 2019

Equity Overview

Combining January and February results, the S&P 500 had its best start since 1991.  Reversing the sentiment in January, investors favored growth stocks over value in February.  Toward month’s end, the forward 12-month price-earnings ratio for the S&P 500 was 16.2, up from 15.7 in January but still below the five-year average.

Fourth quarter corporate earnings reported in February continued to beat analyst expectations at a modest pace.  With 89% of S&P 500 companies reporting, the blended growth rate was 13.1%,  higher than the 12.4% rate in January but well below the 20%+ rates in recent quarters.  69% of companies beat consensus earnings estimates and 61% beat consensus revenue estimates, in both cases below their one-year averages.


Macro Overview - February 2019

Macro Overview

Economic data reported in February were mixed.  Job growth was strong, manufacturing showed tepid gains, and housing continued weak.  The Commerce Department estimate of fourth quarter 2018 GDP growth, delayed because of the government shutdown, came in at 2.6%.  This reflected a slowdown from third quarter growth of 3.4% and also fell below the administration’s target of 3%.  Analysts project a further slowdown in the first quarter of 2019, with some estimates as low as 1.2%.

Congress reached a compromise on border security which provided no funding for a wall on the Mexican border.  The president signed the bill reluctantly, ending the threat of a further government shutdown and its attendant economic consequences, but promptly declared a “national emergency” in order to reallocate money to build a wall.  This provoked a confrontation with Congress, which is ongoing.

In international news, the trade war with China was put on hold as the administration cancelled the March 2nd deadline for imposing additional tariffs, citing progress in the negotiations.  The same could not be said for Brexit, which continued to defy resolution.  Prime Minister Theresa May failed to get Parliament to approve her plan for withdrawal, and Britain hurtled toward a no-deal “hard” exit from the European Union on March 29.  Most commentators view that prospect as disastrous for the British economy.


Additional Disclosures - February 2019

Additional Disclosures

Performance data for OPI reflect the reinvestment of dividends and other earnings on the fund’s assets.  Performance data for the major indices reflect only changes in the value of those indices, and would be higher if dividends were included. However, the index data do not reflect fees that would be paid to index fund managers and transaction costs that would be incurred when their component stocks are bought or sold, while OPI’s data do reflect quarterly fees and expenses incurred by the fund.  The information provided is believed to be reliable, but its accuracy or completeness is not warranted. This material is not intended as an offer or solicitation for the purchase or sale of any stock, bond, mutual fund, or any other financial instrument. The views and strategies discussed herein may not be appropriate and/or suitable for all investors. This material is meant solely for informational purposes, and is not intended to suffice as any type of accounting, legal, tax, or estate planning advice. Any and all forecasts mentioned are for illustrative purposes only and should not be interpreted as investment recommendations.