Kim Nordmo
Artience Capital Management, LLC
One Market Street, Spear Tower
Suite 3600
San Francisco, CA 94105
415-354-5574
Dow Jones | 42,330 |
S&P 500 | 5,762 |
Nasdaq | 18,189 |
2 Yr Treasury | 3.66% |
10 Yr Treasury | 3.81% |
10 Yr Municipal | 2.63% |
High Yield | 6.66% |
Dow Jones | 12.31% |
S&P 500 | 20.81% |
Nasdaq | 21.17% |
MSCI-EAFE | 12.90% |
MSCI-Europe | 12.10% |
MSCI-Pacific | 13.80% |
MSCI-Emg Mkt | 16.80% |
US Agg Bond | 4.44% |
US Corp Bond | 5.32% |
US Gov’t Bond | 4.39% |
Gold | 2,657 |
Silver | 31.48 |
Oil (WTI) | 68.27 |
Dollar / Euro | 1.11 |
Dollar / Pound | 1.33 |
Yen / Dollar | 142.21 |
Canadian /Dollar | 0.73 |
Macro Overview
U.S. equities continued to defy negative sentiment and sanguine market readings as tepid economic data advanced stocks higher in February. Equities posted their best first two months of the year since 1991, rebounding from the volatile fourth quarter of 2018. Gross domestic product (GDP), the primary measure of U.S. economic growth, expanded at a 2.6% annualized pace for the fourth quarter of 2018. Despite negative sentiment and market turmoil towards the end of the year, consumer spending and business investment continued to gradually expand.
GDP as well as other economic indicators that were not released during the government shutdown were posted in early February, a month past its scheduled release. It is expected that additional lingering data will continue to be released throughout March, helping to shed light on the economy’s current stance.
According to Federal Reserve data, declines in stock values, as which occurred in late 2018, have a far greater impact on middle and upper income earners now relative to 30 years ago. Middle America now has many of the same investment opportunities that only the very wealthy had decades ago.
A key housing report, which was delayed due to the government shutdown, revealed that new housing starts in December 2018 fell to the lowest monthly level since September 2016. Economists believe that the slowdown may have been in response to the market pullback in December as well as continued weakness in the housing sector.
Trade tensions with China eased as a March 1st deadline was extended by the President, with discussions between U.S. and Chinese negotiators continuing into March. Another notable deadline looms in Europe as the exit of Britain from the EU, known as Brexit, approaches on March 29th.
Comments by the Fed Chair, Jerome Powell, hinted that the Federal Reserve has become increasingly concerned with stock prices and market volatility. Some economists believe that the Fed slowed its pace of rate increases in order to alleviate further market turmoil following December’s rout.
Federal government offices and agencies avoided a second shutdown following a Congressional compromise on border security. The prior shutdown at the beginning of the year lasted 45 days, which hindered businesses reliant on governmental permits and authorizations.
The IRS reported that for 2018 tax returns filed as of February 22, 2019, the average federal tax refund was $3,143, slightly above the average refund of $3,013 for the same period last year. This tax season is the first year where the 2017 tax cuts have become fully effective, including revisions to withholdings and standard deduction levels. According to data from the IRS and the Tax Foundation, American taxpayers had $140 billion less withheld from their paychecks in 2018.
Sources: Fed, BLS, IRS, EuroStat, Bloomberg
Rates Hold Steady……For Now – Fixed Income Overview
The Fed intends to stop reducing its balance sheet this year, which influences the rise in rates, but still remains devoted to raising rates when economic data deems it. The markets interpret this strategy as a mixed signal, whereas the Fed may be unsure as to what direction the economy may actually head. The yield on the 1-year Treasury has been trending higher than the yield on the 5-year Treasury, creating what is know as an inversion, perhaps indicating slower economic growth.
Global government yields dipped to their lowest levels in months, with the German 10-year bund (bond) reaching near zero percent and the Japanese 10-year government bond falling below zero percent. Nearly $11 trillion of global debt securities reached negative yields in February, representing a reaction to slowing global growth and the Fed’s current hold stance. (Sources: Federal Reserve Bank, U.S. Treasury)
Stocks Post Early Gains – Equity Update
The S&P 500 posted its best two-month start for the year since 1991, with the information technology, energy, and industrial sectors leading the index. Volatility was mostly absent in February following several weeks of heightened market swings that drove uncertainty.
Stocks were bolstered by the expectations of a formalized China trade deal and the shift in stance by the Fed to hold off raising rates. Sentiment in Europe has become more uncertain as negative yields on various bonds have become negative, meaning that economic growth expectations have weakened. As a key trading partner, the European Union (EU) comprised of 28 countries, has become an integral component of U.S. trading activity. Some analysts have noted that prices may have risen faster than growth expectations over the past two months, meaning that there will be greater emphasis on earnings over the next few weeks. (Sources: S&P, Bloomberg, Reuters)
2018 Saw An Increase In Striking Workers – Labor Market Overview
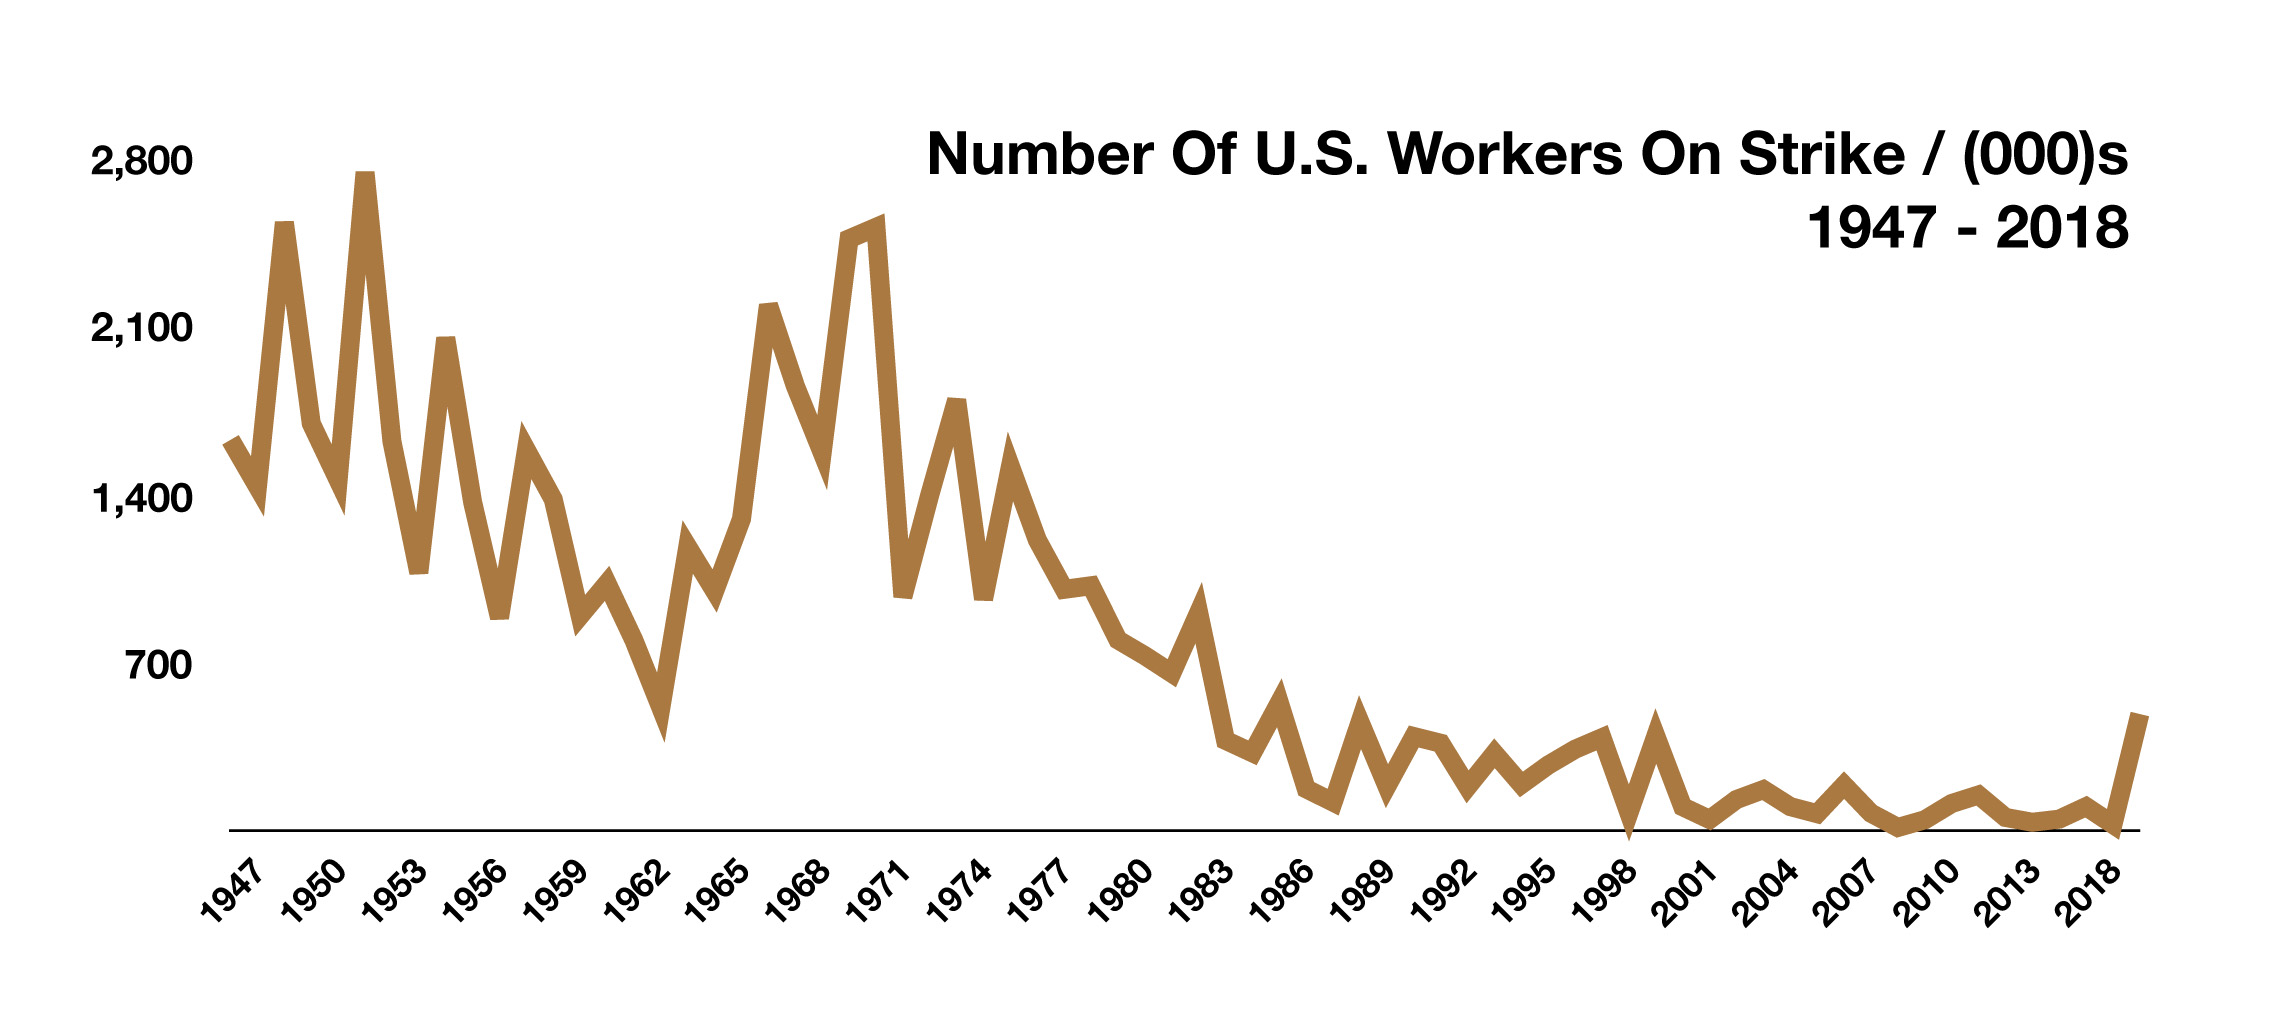
As occupations and trades evolved over the decades in the United States, so have the workers that have been on strike. The Bureau of Labor Statistics monitors and tracks the number of idle workers on strike nationwide, known as work stoppages.
For over 200 years, strikes in the United States have usually evolved from a specific group of workers or labor group. This past year, educational service workers including teachers and office staff for schools, accounted for over 90% of all workers on strike in 2018. Other industries whose employees were also on strike in 2018 included healthcare, hospitality, and information. Incidentally, 2018 saw the most number of workers strike since 1986. Workers in America have been going on strike since the days of the Thirteen Colonies. Among one of the nation’s earliest strikes was the chimney sweepers’ strike of 1763, which occurred in Charleston. Other significant strikes that happened during the 1700’s included tradesman such as tailors, printers, weavers, and river pilots. The 1800’s saw numerous occupational strikes as well, many of which have become obsolete, such as shoebinders, bookbinders, cigar makers, cloakmakers, and pullmen.(Source: BLS)
Europe Buys More From China Than It Does From The U.S. – International Trade
Over the years, Chinese exports have inundated not only the United States, but the European Union (EU) as well. Similar to the trade imbalances with the U.S., the EU also has trade imbalances with China. China has become a significant influence on the EU and its trading characteristics, garnering more trade expansion than with the U.S. China is now the EU’s second-largest trading partner behind the United States, while the EU is China’s largest trading partner. The U.S. represents about 17% of the EU’s total trade, while China currently makes up about 15% of the EU’s total trade.
The EU, like the U.S., wants to ensure that trade with China is fair, respects intellectual property and meets its obligations as a member of the World Trade Organization (WTO). The majority of the imports into the EU from China include consumer goods, machinery, shoes, and clothing. The bulk of exports from the EU to China are automobiles, planes, and chemicals. (Sources: U.S. Department of Commerce, EuroStat, CIA Factbook)
Tax Rule Changes To Be Aware Of When Filing – Tax Planning
This tax season is the first year where all of the changes and provisions passed under the Tax Cuts & Jobs Act are affecting both individual taxpayers and companies with broad changes for deductions and tax rates. The changes, effective January 1, 2019, affect most every tax payer filing as an employee or self-employed business owner. Some of the tax provisions enacted by the new tax act will be temporary, while others permanent. Affecting essentially every taxpayer is the increase in the standard deduction, which is meant to simplify the tax preparation process by replacing itemized deductions with a larger standard deduction.
A provision in the tax code known as indexing will affect 2019 Tax Brackets & Rates, which is essentially an inflation adjusted modification to account for rising inflation trends. For 2019, income brackets increased by roughly 2% across all income levels. Income brackets for capital gains have also increased slightly for 2019. With personal exemptions eliminated under the new tax law, a larger single standard deduction was devised in order to streamline returns for taxpayers. Standard deduction amounts increased slightly for 2019. For both employees and self-employed individuals, IRA and Qualified Plan contributions have increased as well for 2019.
Other significant changes occurring for 2019 include:
Estate Tax Exemption increases from $11.18 million to $11.40 million in 2019.; Elimination of the ACA penalty for not having health insurance becomes effective ; Unreimbursed medical expenses must exceed 10% of AGI in order to deduct; Alimony is no longer deductible for the payor and no longer taxable for the recipient for divorce decrees issued after December 31, 2018.(Sources: https://taxfoundation.org, IRS.gov)
Global Uncertainty Drives Demand For U.S. Treasuries – Fiscal Policy
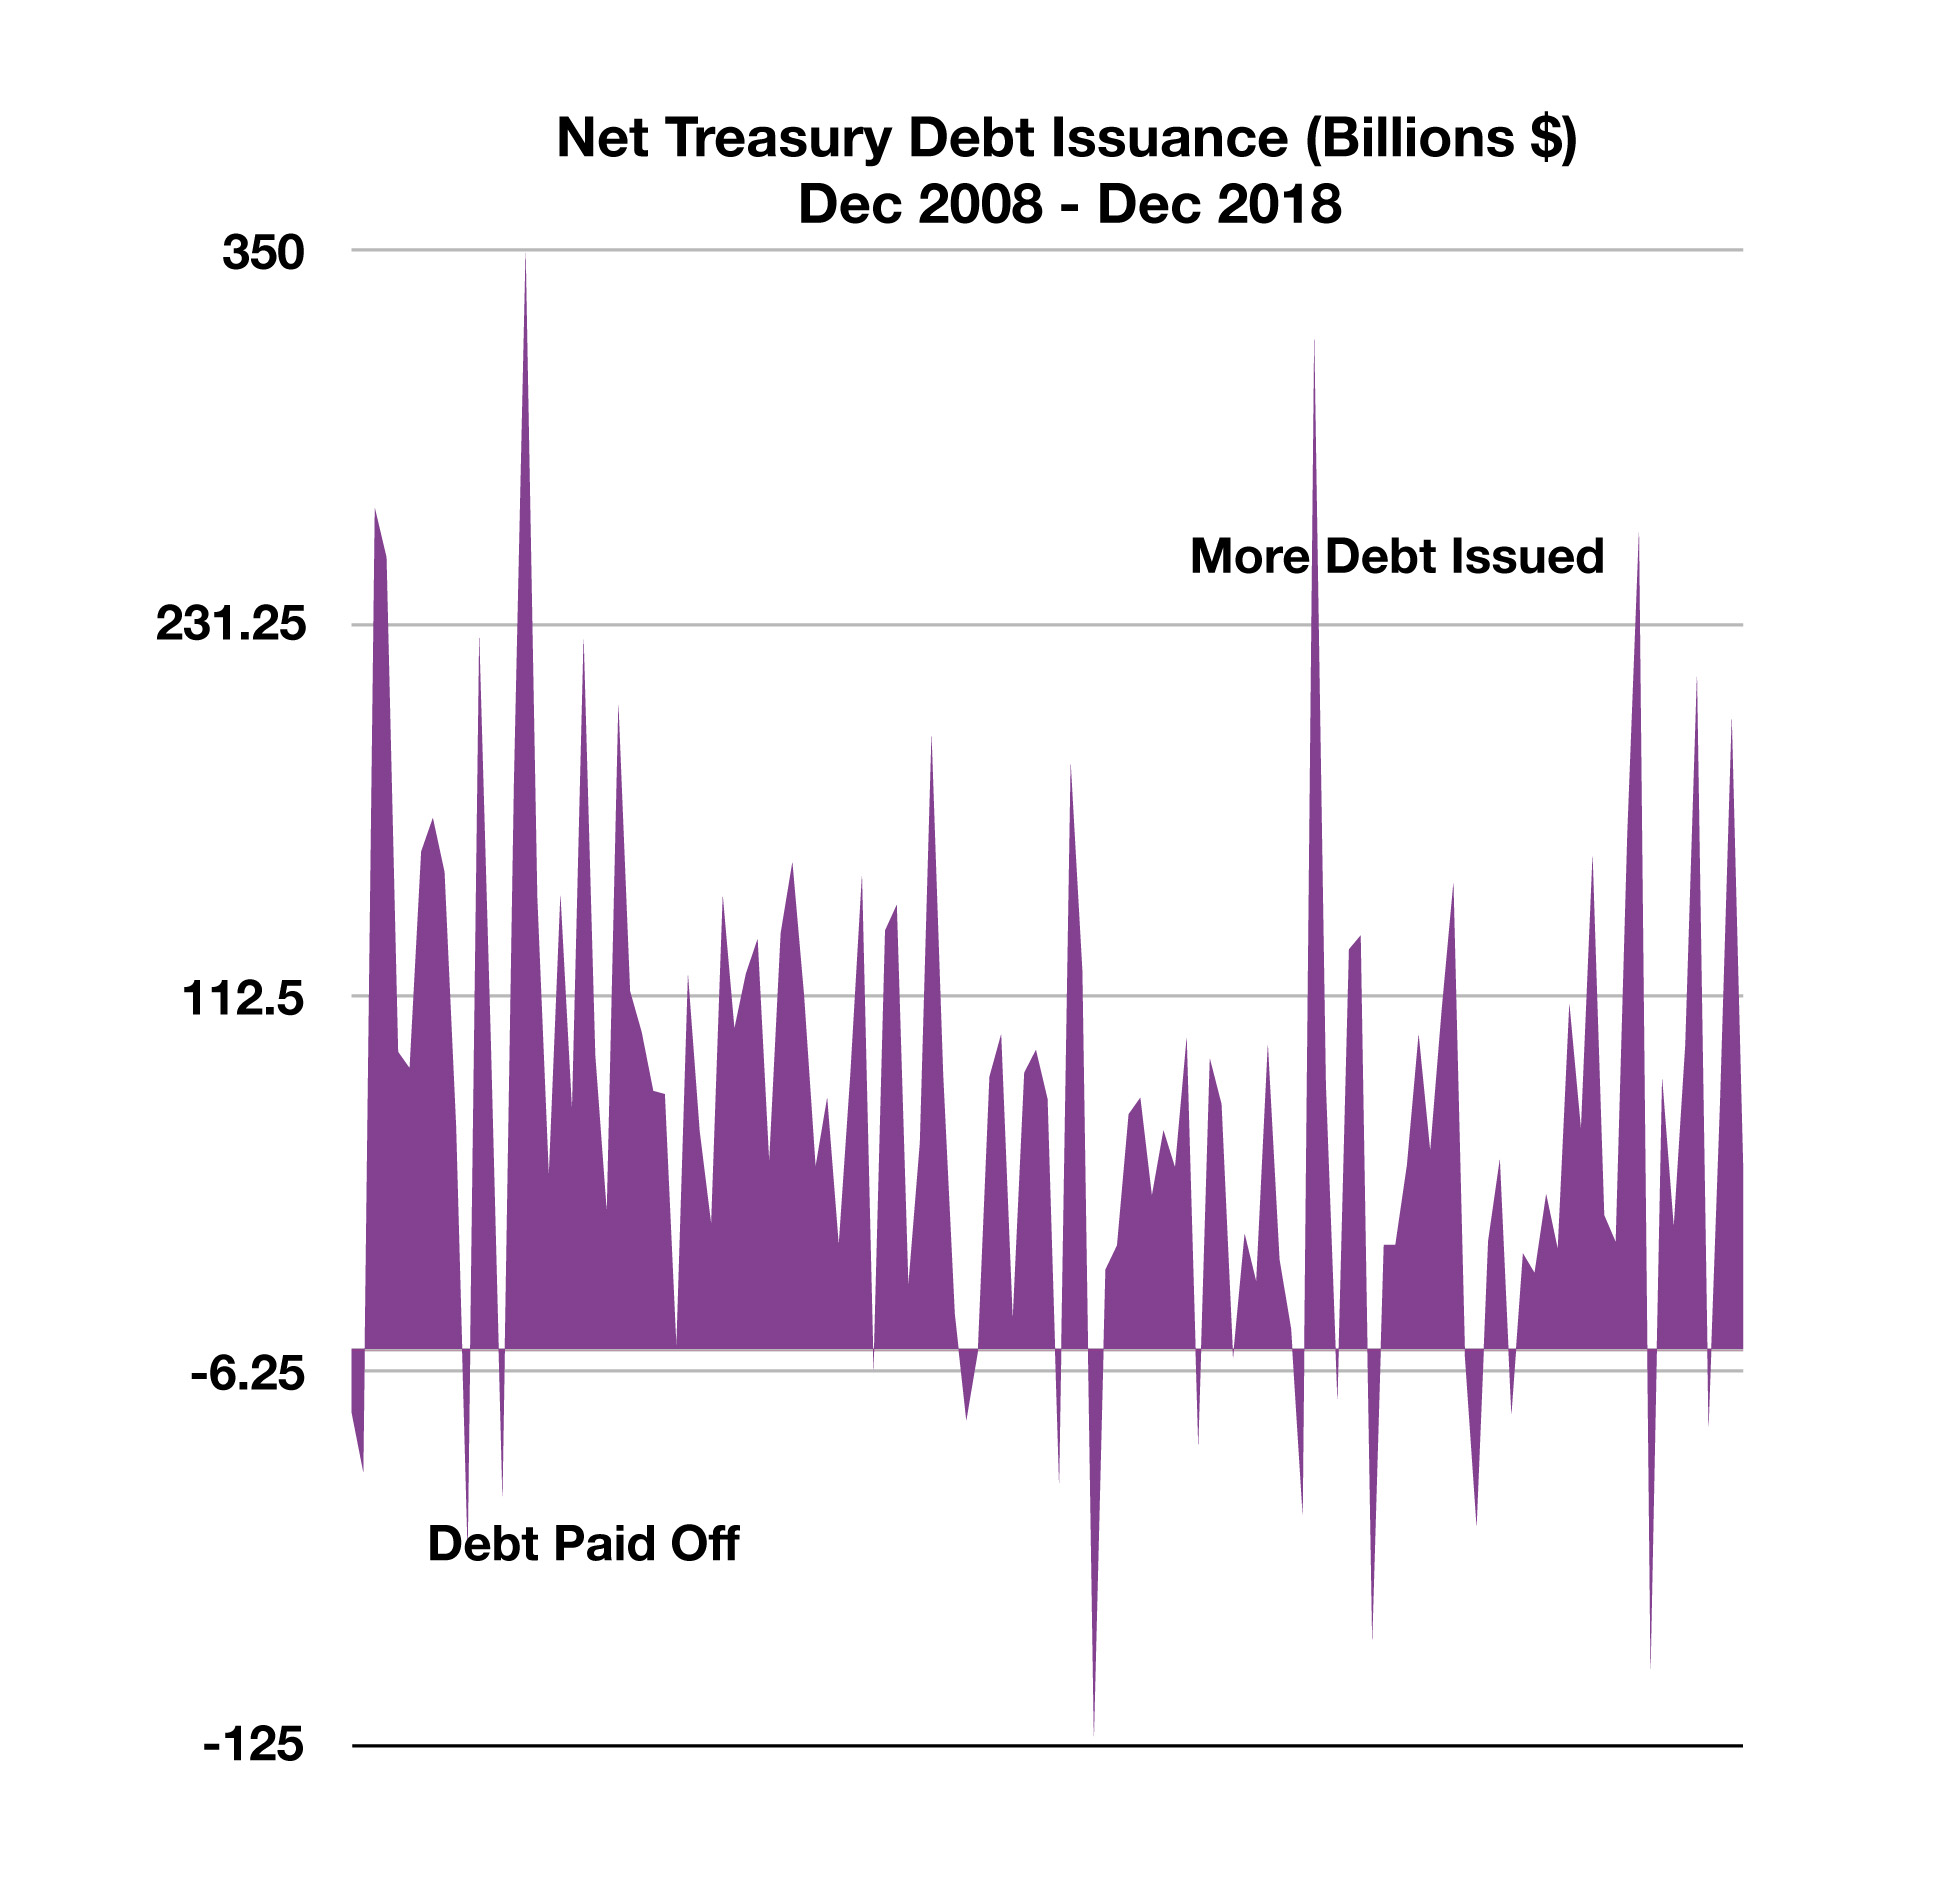
The prospect of an increasing deficit has led to an increase in debt issuance by the Treasury due to an expected shortfall of tax revenue. The Treasury issues debt in order to fund the ongoing operations of the U.S. government. Some of the recent tax measures passed by Congress are expected to reduce revenues while increasing spending, which will in turn be funded by issuing new Treasuries. The debt management process is comprised of both the issuance of new debt and the retirement of preexisting debt. Should the Treasury issue more debt than it is retiring, there is a net increase in the amount of debt outstanding.
Over the past 18 years, the Treasury has issued an average of $505.4 billion of debt each month, while also retiring or simply paying off an average of $454.8 billion every month. This deficit has been a subject of constant political debate. A heightened supply of Treasuries follows tax cuts and increased government spending, along with growing entitlement payments and higher service costs for government debt. The Treasury Department’s total net new issuance in 2018 amounted to $1.34 trillion, more than double the 2017 level of $550 billion. It is estimated that new debt issuance for 2019 will be $1.4 trillion, then range from $1.25 trillion to $1.4 trillion over the next four years. Despite the increased flood of new government debt supply, demand has surprisingly kept up as an insatiable demand from abroad continues to drive investors to the liquid and transparent market of U.S. government debt.(Sources: U.S. Treasury Department)
Consumers Opt For Auto Loans Rather Than Mortgages – Consumer Credit
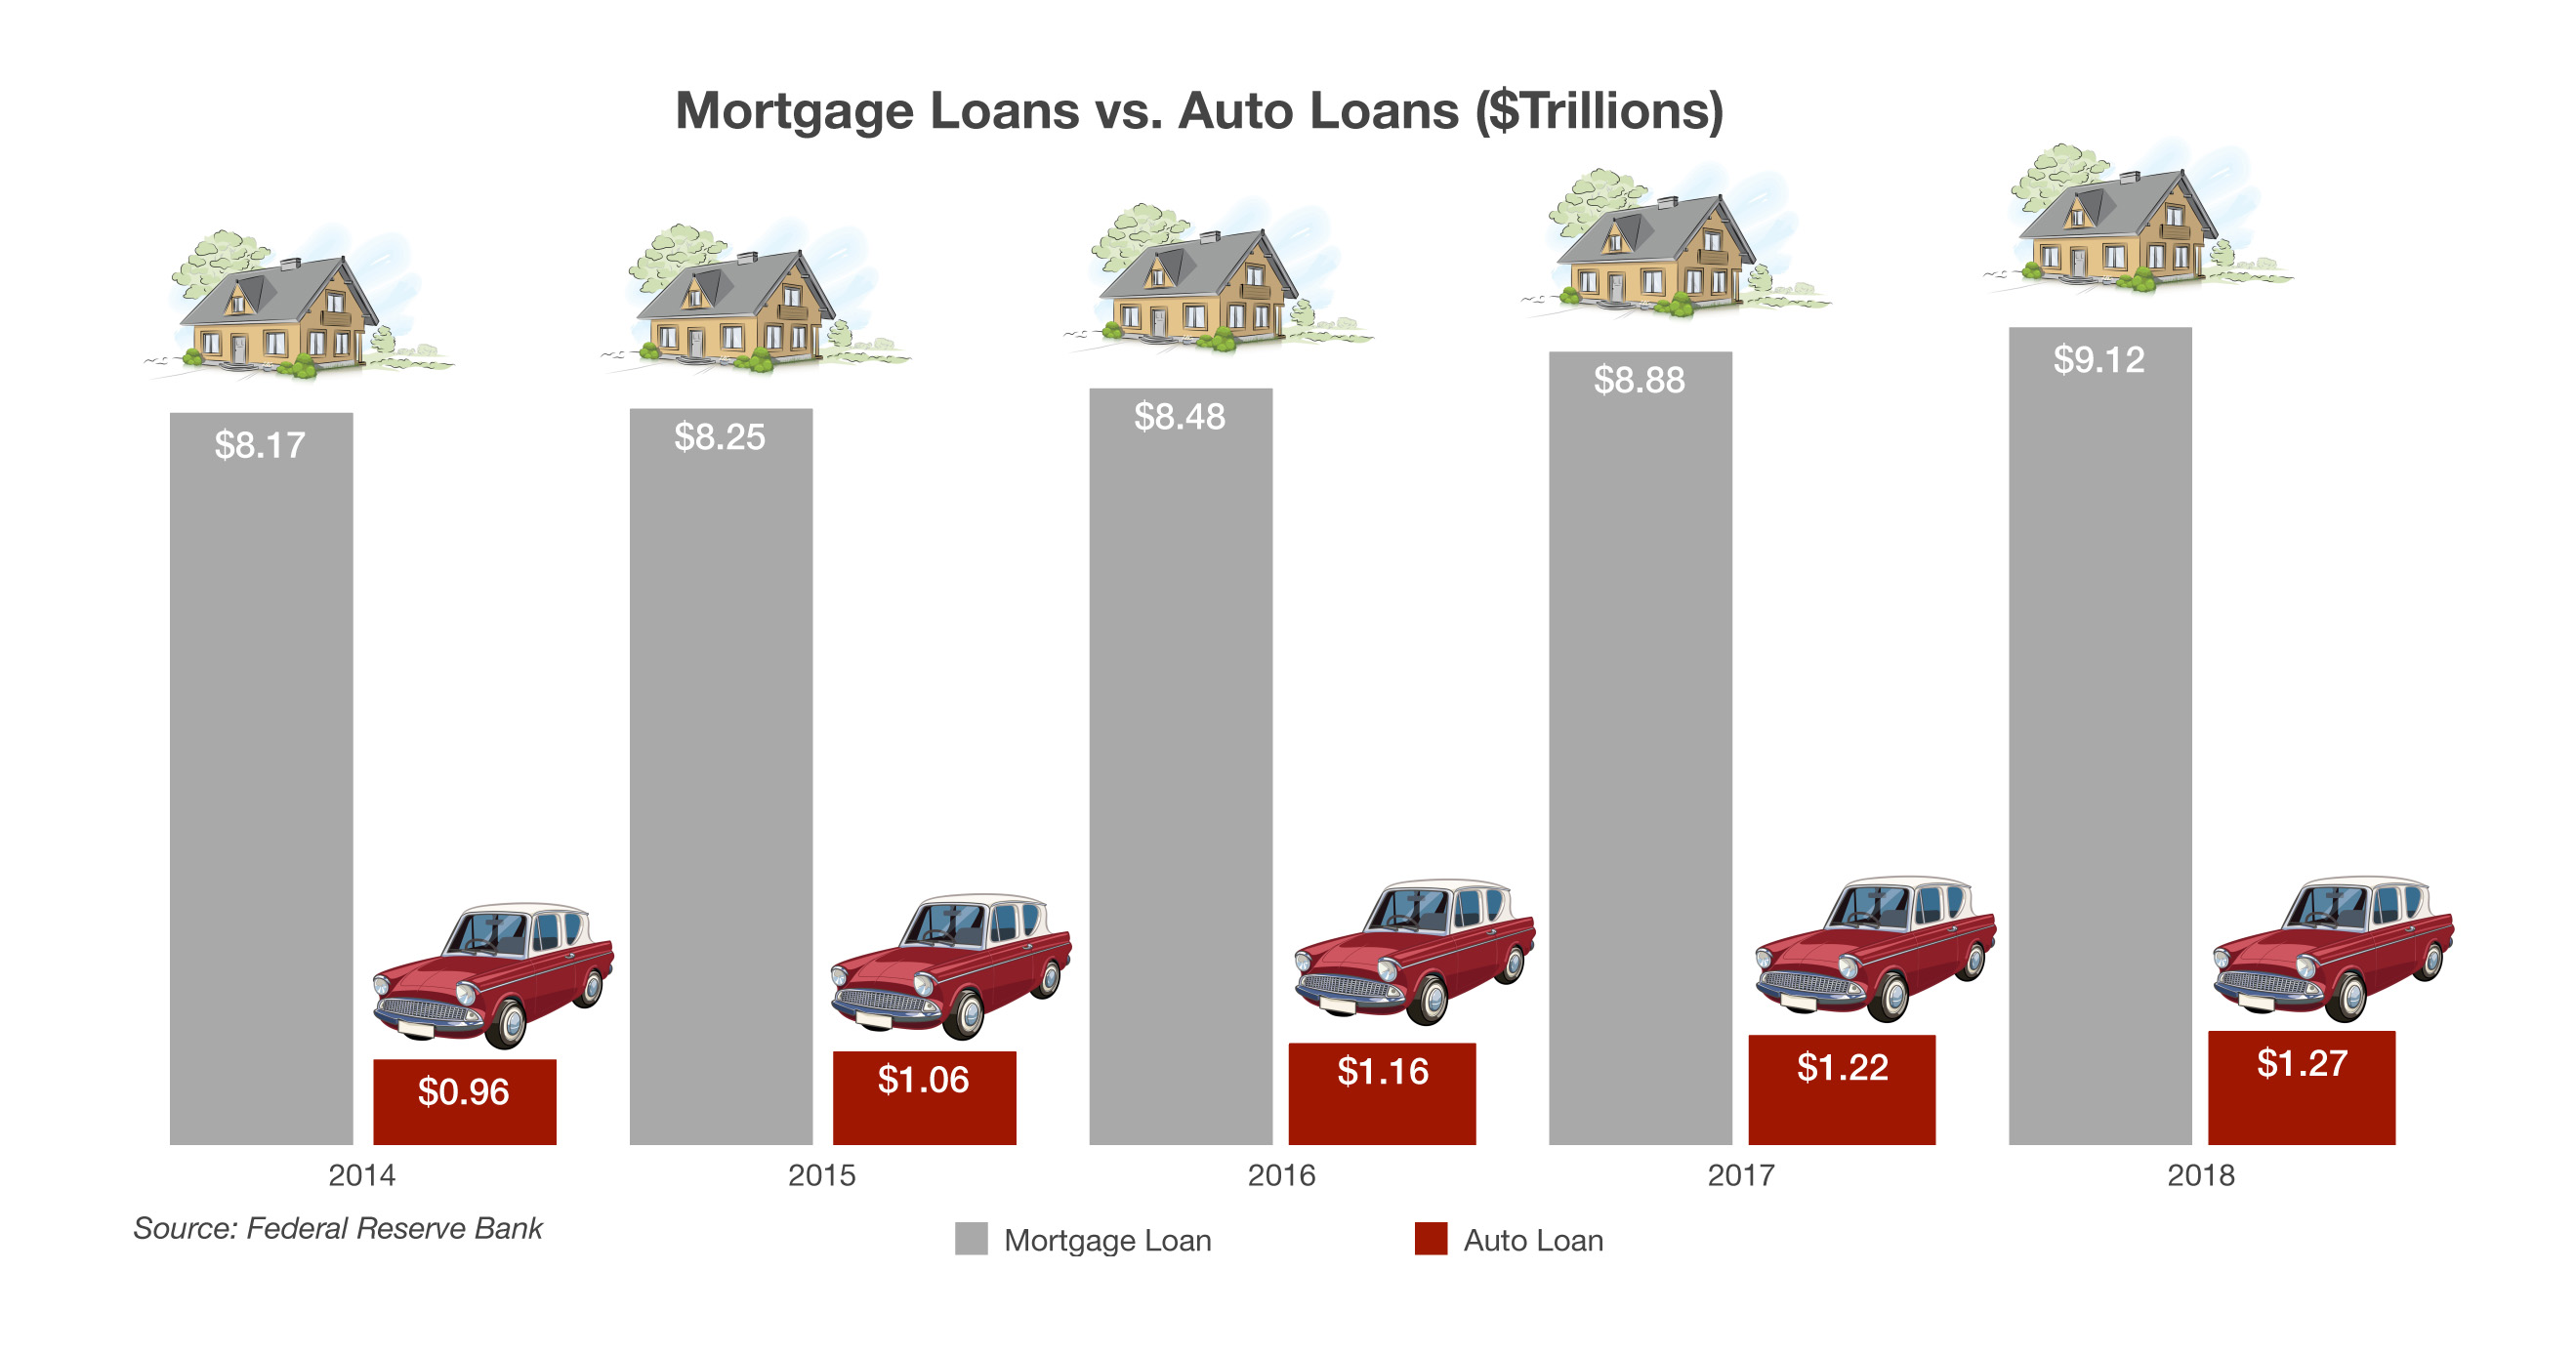
Data released by the Federal Reserve Bank of New York found that Americans have been borrowing more for automobiles and less for homes. While new mortgages fell to their lowest levels since 2014, car loans have been steadily increasing. A weakening housing sector along with tepid wage growth has affected mortgage demand over the past few quarters. Consumers who have been discouraged by a slowing housing market have instead stayed put and purchased new home goods and cars with their improving credit. Auto loans have been making up a faster growing segment of consumer debt than mortgages. Mortgage loans still make up the single largest debt payment for consumers nationwide, with auto payments the second largest. (Source: fred.stlouisfed.org)