March 2019
Market Update
(all values as of 04.30.2024)

Stock Indices:

Dow Jones 37,815
S&P 500 5,035
Nasdaq 15,657

Bond Sector Yields:

2 Yr Treasury 5.04%
10 Yr Treasury 4.69%
10 Yr Municipal 2.80%
High Yield 7.99%

YTD Market Returns:

Dow Jones 0.34%
S&P 500 5.57%
Nasdaq 4.31%
MSCI-EAFE 1.98%
MSCI-Europe 2.05%
MSCI-Pacific 1.82%
MSCI-Emg Mkt 2.17%
 
US Agg Bond 0.50%
US Corp Bond 0.56%
US Gov’t Bond 0.48%

Commodity Prices:

Gold 2,297
Silver 26.58
Oil (WTI) 81.13

Currencies:

Dollar / Euro 1.07
Dollar / Pound 1.25
Yen / Dollar 156.66
Canadian /Dollar 0.79
 

Macro Overview

U.S. equities continued to defy negative sentiment and sanguine market readings as tepid economic data advanced stocks higher in February. Equities posted their best first two months of the year since 1991, rebounding from the volatile fourth quarter of 2018. Gross domestic product (GDP), the primary measure of U.S. economic growth, expanded at a 2.6% annualized pace for the fourth quarter of 2018. Despite negative sentiment and market turmoil towards the end of the year, consumer spending and business investment continued to gradually expand.

GDP as well as other economic indicators that were not released during the government shutdown were posted in early February, a month past its scheduled release. It is expected that additional lingering data will continue to be released throughout March, helping to shed light on the economy’s current stance.

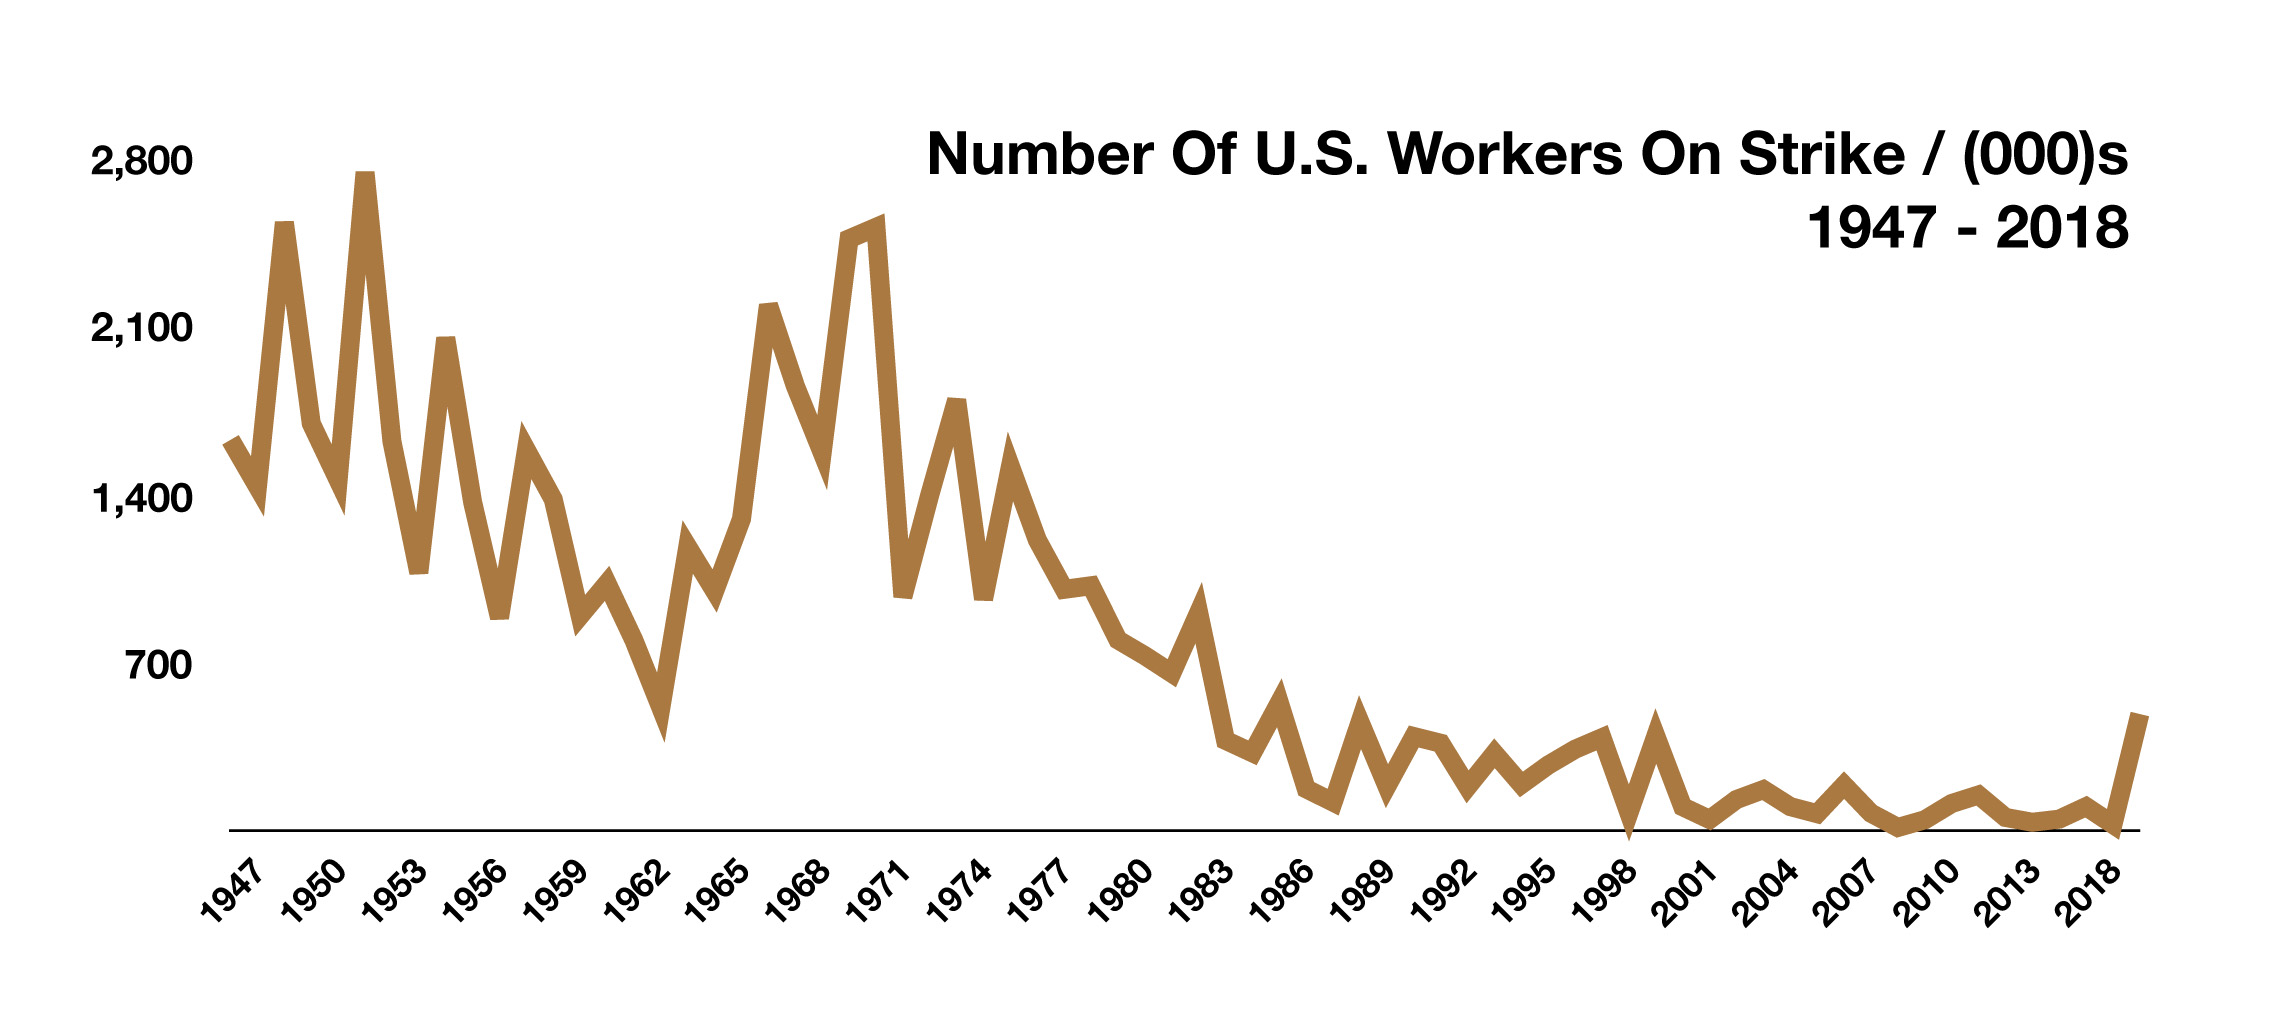
According to Federal Reserve data, declines in stock values, as which occurred in late 2018, have a far greater impact on middle and upper income earners now relative to 30 years ago. Middle America now has many of the same investment opportunities that only the very wealthy had decades ago.

A key housing report, which was delayed due to the government shutdown, revealed that new housing starts in December 2018 fell to the lowest monthly level since September 2016. Economists believe that the slowdown may have been in response to the market pullback in December as well as continued weakness in the housing sector.

Trade tensions with China eased as a March 1st deadline was extended by the President, with discussions between U.S. and Chinese negotiators continuing into March. Another notable deadline looms in Europe as the exit of Britain from the EU, known as Brexit, approaches on March 29th. 

Comments by the Fed Chair, Jerome Powell, hinted that the Federal Reserve has become increasingly concerned with stock prices and market volatility. Some economists believe that the Fed slowed its pace of rate increases in order to alleviate further market turmoil following December’s rout.

Federal government offices and agencies avoided a second shutdown following a Congressional compromise on border security. The prior shutdown at the beginning of the year lasted 45 days, which hindered businesses reliant on governmental permits and authorizations.

The IRS reported that for 2018 tax returns filed as of February 22, 2019, the average federal tax refund was $3,143, slightly above the average refund of $3,013 for the same period last year. This tax season is the first year where the 2017 tax cuts have become fully effective, including revisions to withholdings and standard deduction levels. According to data from the IRS and the Tax Foundation, American taxpayers had $140 billion less withheld from their paychecks in 2018.

{Sources: Fed, BLS, IRS, EuroStat, Bloomberg}

 
485,000 workers went on strike in 2018...the most since 1986

Rates Hold Steady……For Now – Fixed Income Overview

The Fed intends to stop reducing its balance sheet this year, which influences the rise in rates, but still remains devoted to raising rates when economic data deems it. The markets interpret this strategy as a mixed signal, whereas the Fed may be unsure as to what direction the economy may actually head. The yield on the 1-year Treasury has been trending higher than the yield on the 5-year Treasury, creating what is know as an inversion, perhaps indicating slower economic growth.

Global government yields dipped to their lowest levels in months, with the German 10-year bund (bond) reaching near zero percent and the Japanese 10-year government bond falling below zero percent. Nearly $11 trillion of global debt securities reached negative yields in February, representing a reaction to slowing global growth and the Fed’s current hold stance. {Sources: Federal Reserve Bank, U.S. Treasury}

Stocks Post Early Gains – Equity Update

The S&P 500 posted its best two-month start for the year since 1991, with the information technology, energy, and industrial sectors leading the index. Volatility was mostly absent in February following several weeks of heightened market swings that drove uncertainty.

Stocks were bolstered by the expectations of a formalized China trade deal and the shift in stance by the Fed to hold off raising rates. Sentiment in Europe has become more uncertain as negative yields on various bonds have become negative, meaning that economic growth expectations have weakened. As a key trading partner, the European Union (EU) comprised of 28 countries, has become an integral component of U.S. trading activity. Some analysts have noted that prices may have risen faster than growth expectations over the past two months, meaning that there will be greater emphasis on earnings over the next few weeks.       {Sources: S&P, Bloomberg, Reuters}

2018 Saw An Increase In Striking Workers – Labor Market Overview

As occupations and trades evolved over the decades in the United States, so have the workers that have been on strike. The Bureau of Labor Statistics monitors and tracks the number of idle workers on strike nationwide, known as work stoppages.

For over 200 years, strikes in the United States have usually evolved from a specific group of workers or labor group. This past year, educational service workers including teachers and office staff for schools, accounted for over 90% of all workers on strike in 2018.  Other industries whose employees were also on strike in 2018 included healthcare, hospitality, and information. Incidentally, 2018 saw the most number of workers strike since 1986. Workers in America have been going on strike since the days of the Thirteen Colonies. Among one of the nation’s earliest strikes was the chimney sweepers’ strike of 1763, which occurred in Charleston. Other significant strikes that happened during the 1700’s included tradesman such as tailors, printers, weavers, and river pilots. The 1800’s saw numerous occupational strikes as well, many of which have become obsolete, such as shoebinders, bookbinders, cigar makers, cloakmakers, and pullmen. {Source: BLS}

 
China is now the EU’s second largest trading partner behind the United States

Europe Buys More From China Than It Does From The U.S. – International Trade

Over the years, Chinese exports have inundated not only the United States, but the European Union (EU) as well. Similar to the trade imbalances with the U.S., the EU also has trade imbalances with China. China has become a significant influence on the EU and its trading characteristics, garnering more trade expansion than with the U.S. China is now the EU’s second-largest trading partner behind the United States, while the EU is China’s largest trading partner. The U.S. represents about 17% of the EU’s total trade, while China currently makes up about 15% of the EU’s total trade.

The EU, like the U.S., wants to ensure that trade with China is fair, respects intellectual property and meets its obligations as a member of the World Trade Organization (WTO). The majority of the imports into the EU from China include consumer goods, machinery, shoes, and clothing. The bulk of exports from the EU to China are automobiles, planes, and chemicals. {Sources: U.S. Department of Commerce, EuroStat, CIA Factbook}

OPEC Weakens Further – Oil Industry Focus

The once almighty oil cartel known as OPEC (Organization of the Petroleum Exporting Countries), has weaken to the point that its members have lost confidence in the organization’s ability to manage and control oil prices as it has done for decades. Recent political events for certain OPEC members have further hindered OPEC with sanctions on Iran and the demise of Venezuela’s oil industry.

Descent among the organization has enticed Saudi Arabia and other members to seek alternative arrangements. Discussions among a 10 nation group, including Russia but not Iran, was a consideration reviewed in February.

OPEC was established in 1960 with an initial group of 14 oil producing nations. As of September 2018, OPEC’s member countries account for 44 percent of global oil production and over 81 percent of the world’s proven oil reserves. Because of it’s cartel structure, OPEC has been the primary influence on global oil prices and supply for decades, until now. Over the past few years, the onslaught of non-OPEC producers such as U.S. shale oil production, has hindered OPEC’s supply and price control of the global oil markets, hampering its global influence on the industry.

The U.S. Energy Information Administration (EIA) tracks and projects OPEC production with the intent of identifying erratic changes in oil prices. For 2019, the EIA estimates that OPEC production will fall by 1 million barrels per day compared to 2018 daily production. The EIA is concurrently estimating an increase of U.S. production of over 2 million barrels per day. OPEC’s 14 nation members currently produce an average of 30 million barrels per day, while U.S. daily production is exceeding 11 million barrels. {Sources: opec.org, EIA; Crude Oil Production, OPEC Total, Quarterly}


It is estimated that new debt issuance for 2019 will be $1.4 trillion

Global Uncertainty Drives Demand For U.S. Treasuries – Fiscal Policy 

The prospect of an increasing deficit has led to an increase in debt issuance by the Treasury due to an expected shortfall of tax revenue. The Treasury issues debt in order to fund the ongoing operations of the U.S. government. Some of the recent tax measures passed by Congress are expected to reduce revenues while increasing spending, which will in turn be funded by issuing new Treasuries. The debt management process is comprised of both the issuance of new debt and the retirement of preexisting debt. Should the Treasury issue more debt than it is retiring, there is a net increase in the amount of debt outstanding.

Over the past 18 years, the Treasury has issued an average of $505.4 billion of debt each month, while also retiring or simply paying off an average of $454.8 billion every month. This deficit has been a subject of constant political debate.  A heightened supply of Treasuries follows tax cuts and increased government spending, along with growing entitlement payments and higher service costs for government debt. The Treasury Department’s total net new issuance in 2018 amounted to $1.34 trillion, more than double the 2017 level of $550 billion. It is estimated that new debt issuance for 2019 will be $1.4 trillion, then range from $1.25 trillion to $1.4 trillion over the next four years. Despite the increased flood of new government debt supply, demand has surprisingly kept up as an insatiable demand from abroad continues to drive investors to the liquid and transparent market of U.S. government debt.{Sources: U.S. Treasury Department}

Consumers Opt For Auto Loans Rather Than Mortgages – Consumer Credit

Data released by the Federal Reserve Bank of New York found that Americans have been borrowing more for automobiles and less for homes. While new mortgages fell to their lowest levels since 2014, car loans have been steadily increasing. A weakening housing sector along with tepid wage growth has affected mortgage demand over the past few quarters. Consumers who have been discouraged by a slowing housing market have instead stayed put and  purchased new home goods and cars with their improving credit. Auto loans have been making up a faster growing segment of consumer debt than mortgages. Mortgage loans still make up the single largest debt payment for consumers nationwide, with auto payments the second largest. {Source: fred.stlouisfed.org}


What a 500-point swing in the Dow means for your investment portfolio

Getting to the Point of a Point

Dimensional Fund Advisors – March 2019

A quick online search for “Dow rallies 500 points” yields a cascade of news stories with similar titles, as does a similar search for “Dow drops 500 points.”

These types of headlines may make little sense to some investors, given that a “point” for the Dow and what it means to an individual’s portfolio may be unclear. The potential for misunderstanding also exists among even experienced market participants, given that index levels have risen over time and potential emotional anchors, such as a 500-point move, do not have the same impact on performance as they used to. With this in mind, we examine what a point move in the Dow means and the impact it may have on an investment portfolio.

Impact of Index Construction

The Dow Jones Industrial Average was first calculated in 1896 and currently consists of 30 large cap US stocks. The Dow is a price-weighted index, which is different than more common market capitalization-weighted indices.[1]

An example may help put this difference in weighting methodology in perspective. Consider two companies that have a total market capitalization of $1,000. Company A has 1,000 shares outstanding that trade at $1 each, and Company B has 100 shares outstanding that trade at $10 each. In a market capitalization-weighted index, both companies would have the same weight since their total market caps are the same. However, in a price-weighted index, Company B would have a larger weight due to its higher stock price. This means that changes in Company B’s stock would be more impactful to a price-weighted index than they would be to a market cap-weighted index.

The relative advantages and disadvantages of these methodologies are interesting topics themselves, but the main purpose of discussing the differences in this context is to point out that design choices can have an impact on index performance. Investors should be aware of this impact when comparing their own portfolios’ performance to that of an index.

Headlines vs. Reality

Movements in the Dow are often communicated in units known as points, which signify the change in the index level. Investors should be cautious when interpreting headlines that reference point movements, as a move of, say, 500 points in either direction is less meaningful now than in the past largely because the overall index level is higher today than it was many years ago.

Exhibit 1 plots what a decline of this magnitude has meant in percentage terms over time. A 500-point drop in January 1985, when the Dow was near 1,300, equated to a nearly 39% loss. A 500-point drop in December 2003, when the Dow was near 10,000, meant a much smaller 5% decline in value. And a 500-point drop in early December 2018, when the Dow hovered near 25,000, resulted in a 2% loss.

{continued on page 6}


stocks composing the index may not be representative of an investor’s portfolio

{Getting to the Point of a Point continued}

Exhibit 1.       Hypothetical 500-Point Decline of the Dow Measured in Percentage Terms

Dow Jones and S&P 500 data © 2019 S&P Dow Jones Indices LLC, a division of S&P Global. The chart illustrates what a 500-point drop would have been in percentage terms for the Dow Jones Industrial Average on a daily basis. It assumes a 500-point loss took place each trading day from January 1, 1985, to February 1, 2019, and uses daily historical closing values of the Dow Jones Industrial Average to compute the percentage change. Percentage change does not indicate the actual change in the Dow during the period shown. Actual results may vary.

How Does the Dow Relate to your Portfolio?

While the Dow and other indices are frequently interpreted as indicators of broader stock market performance, the stocks composing these indices may not be representative of an investor’s total portfolio.

For context, the MSCI All Country World Investable Market Index (MSCI ACWI IMI) covers just over 8,700 large, mid, and small cap stocks in 23 developed and 24 emerging markets countries with a combined market cap of more than $50 trillion. The S&P 500 includes 505 large cap US stocks with approximately $23.8 trillion in combined market cap.[1] The Dow is a collection of 30 large cap US stocks with a combined market cap of approximately $6.8 trillion.[2]

Even though the MSCI ACWI IMI, S&P 500, and Dow are all stock market indices, each one tracks different segments of the market, so their performance can differ significantly over time, as shown in Exhibit 2. Since 1995, the Dow has outperformed the S&P 500 and MSCI ACWI IMI by an average of 0.5% and 3.3%, respectively (based on calendar year returns). However, relative performance in individual years can be much different. For example, in 1997, the Dow underperformed the S&P 500 by 8.4% but outperformed the MSCI ACWI IMI by 13.9%.

{continued on page 7}


Dow offers limited insights to diversified portfolio holding global stocks & bonds

{Getting to the Point of a Point continued}

Exhibit 2.       Performance of MSCI ACWI IMI, S&P 500, and Dow by Calendar Year

Dow Jones and S&P 500 data © 2019 S&P Dow Jones Indices LLC, a division of S&P Global. All rights reserved. MSCI data © MSCI 2019, all rights reserved. MSCI ACWI IMI is the MSCI All Country World Investable Market Index (net dividends). Their performance does not reflect fees and expenses associated with the management of an actual portfolio. Past performance is no guarantee of future results.

It is also important to note that some investors may be concerned about other asset classes besides stocks. Depending on investor needs, a diversified portfolio may include a mix of global stocks, bonds, commodities, and any number of other assets not represented in a stock index. A portfolio’s performance should always be evaluated within the context of an investor’s specific goals. Understanding how a personal portfolio compares to broadly published indices like the Dow can give investors context about how headlines apply to their own situation.

Conclusion

News headlines are often written to grab attention. A headline publicizing a 500-point move in the Dow may trigger an emotional response and, depending on the direction, sound either exciting or ominous enough to warrant reading the article. However, after digging further, we can see that the insights such headlines offer may be limited, especially if investors hold portfolios designed and managed daily to meet their individual goals, needs, and preferences in a broadly diversified and cost-effective manner. {Source: Dimensional Fund Advisors LP. Also available at us.dimensional.com/perspectives/getting-to-the-point-of-a-point

Indices are not available for direct investment. Their performance does not reflect the expenses associated with the management of an actual portfolio. Past performance is not a guarantee of future results. Diversification does not eliminate the risk of market loss. There is no guarantee investment strategies will be successful. Investing involves risks, including possible loss of principal.

All expressions of opinion are subject to change. This article is distributed for informational purposes, and it is not to be construed as an offer, solicitation, recommendation, or endorsement of any particular security, products, or services. Investors should talk to their financial advisor prior to making any investment decision.

 
Unreimbursed medical expenses must exceed 10% of AGI in order to deduct

Tax Rule Changes To Be Aware Of When Filing – Tax Planning

This tax season is the first year where all of the changes passed under the Tax Cuts & Jobs Act are affecting both individual taxpayers and companies with broad changes for deductions and tax rates. The changes, effective January 1, 2019, affect most every tax payer filing as an employee or self employed business owner.

Some of the tax provisions enacted by the new tax act will be temporary, while others permanent. Affecting essentially every taxpayer is the increase in the standard deduction, which is meant to simplify the tax preparation process by replacing itemized deductions with a larger standard deduction.

A provision in the tax code known as indexing will affect 2019 Tax Brackets & Rates, which is essentially an inflation adjusted modification to account for rising inflation trends. For 2019, income brackets increased by roughly 2% across all income levels. Income brackets for capital gains have also increased slightly.

With personal exemptions eliminated under the new tax law, a larger single standard deduction was devised in order to streamline returns for taxpayers. Standard deduction amounts increased slightly for 2019.

For both employees and self-employed individuals, IRA and Qualified Plan contributions have increased as well for 2019.

Other significant changes occurring for 2019 include:

Credit Score Calculations Will Change In 2019 – Financial Planning

In response to pressure from regulators and the banking industry, credit reporting firms will offer modified credit scores starting in 2019. The modifications include the calculation of utility and cellphone bills that millions of Americans pay every month.

Banks have argued that a large group of consumers nationwide just don’t have sufficient credit history to generate a viable credit score for a bank loan. However, the inclusion of utility and cellphone payments will help identify credit worthy consumers for bank loans. The challenge lies with consumers that hold little if any loan balances, thus not generating a track record of payments. The change is expected to increase loan issuance by banks as millions of consumers become qualified for loans. An overall drop in credit scores following the financial crisis of 2008-09 made it difficult for consumers to obtain loans.

With over 270 million cell phone users in the country, many are expected to benefit from so-called non-loan bill payments as their credit scores may positively be affected. {Sources: Fair Issac Corp., Office of the Comptroller of the Currency, Treasury Dept.}

 
pet spending in the U.S. is estimated to exceed $72 billion

Less Cheese Exports Affects U.S. Dairies – Agricultural Trade

U.S. dairies are among the largest producers of cheese in the world, producing from cheddar to mozzarella.  The global cheese market is currently made up of over 21 million tons of cheese production coming from countries all over the world. Cheese comes in various forms, as large uncut blocks to small package products such as string cheese. 

Cheese is big business worldwide since dairies, usually on large areas of land, demand enormous amounts of capital to maintain operations. U.S. dairies are among the largest and most efficient worldwide, producing mass amounts of cheese for domestic consumption & international export.

Trade tensions and tariff retaliations have made U.S. cheese exports more expensive worldwide. With less exports, an increasing supply of cheese has been accumulating in the U.S. Additionally, U.S. consumers are consuming less cheese and dairy products, driving demand down as stockpiles climb. {Sources: U.S. Dept. of Agriculture, FRED; Bank of St. Louis}

What We Spend On Our Pets – Consumer Behavior

The Chinese are forecasted to spend about US$2.6 billion on their pets by 2019 – a 50 percent increase from 2016. This, however, pales in comparison with what Americans spend on their pets annually. This year alone, pet spending in the U.S. is estimated to exceed $72 billion, which is more than the combined GDP of the 39 poorest countries in the world.

U.S. pet owners spent $69.51 billion on pet products in 2017 with overall U.S. pet industry spending increasing 4.1 percent between 2016 and 2017. While this statistic may seem rather steep, when we take into account the cost of pet food, along with basic pet services and trips to the vet that often result in medications and treatments, we can see where the money goes.

What makes this information even more interesting is that over the past several years, costs have continued to increase.

Breakdown:                                                          US$ billion               % increase ’16 to ‘17
Food                                                                       $29.07                                2.9%
Supplies/OTC Medicine                                       $15.11                                 2.7%
Vet Care                                                                 $17.07                                7.0%
Live animal purchases                                         $  2.10                                0.0%
Pet Services: grooming & boarding                   $  6.16                                 6.9%

{Source: Bureau of Labor Statistics, American Pet Products Association}


Weather, taxes, jobs and housing affordability are among the primary factors incentivizing people to move

Which States Are Seeing The Most Population Growth – Demographics

Various factors have made some states more attractive than others, influencing the migration of citizens from state to state. Weather, taxes, jobs and housing affordability are among the primary factors incentivizing people to move from one state to another. 

The U.S. Census Bureau tracks population growth and declines for the 50 states, which individual states carefully monitor in order to determine any tax revenue changes for the states. Demographics is also a contributing variable as residents leave one state and head to another. The Census Bureau found that higher paid Americans with an elevated education were the main migrants to California, where housing and taxes are among the most expensive nationwide.

Data compiled over the past 10 years by the Census Bureau revealed a number of states as the primary recipients of new residents, including Utah, Texas, and Florida. Lower unemployment rates have allowed other factors such as weather and housing to become more of a deciding factor.

Some states are more susceptible to swings in the economy and particular industries affecting the population growth of the state. North Dakota saw an incredible population growth in 2011, 2012 and 2013 as the fracking industry drew people in from nearby states for an abundance of jobs. The state has since seen a reallocation of energy related fracking workers move to other states such as Texas and New Mexico where their experience was garnering more attractive wages in addition to more favorable weather. {Sources: U.S. Census Bureau}