AIS March 2020 Newsletter
Market Update
(all values as of 09.30.2024)

Stock Indices:

Dow Jones 42,330
S&P 500 5,762
Nasdaq 18,189

Bond Sector Yields:

2 Yr Treasury 3.66%
10 Yr Treasury 3.81%
10 Yr Municipal 2.63%
High Yield 6.66%

YTD Market Returns:

Dow Jones 12.31%
S&P 500 20.81%
Nasdaq 21.17%
MSCI-EAFE 12.90%
MSCI-Europe 12.10%
MSCI-Pacific 13.80%
MSCI-Emg Mkt 16.80%
 
US Agg Bond 4.44%
US Corp Bond 5.32%
US Gov’t Bond 4.39%

Commodity Prices:

Gold 2,657
Silver 31.48
Oil (WTI) 68.27

Currencies:

Dollar / Euro 1.11
Dollar / Pound 1.33
Yen / Dollar 142.21
Canadian /Dollar 0.73
 

Macro Overview

Fear has been permeating capital markets worldwide as the impact of the (COVID-19) coronavirus continues to evolve. Global economic forecasts have been revised downward by the International Monetary Fund (IMF) and the World Bank as factory closures, quarantines, and travel bans continue to hinder numerous industries.

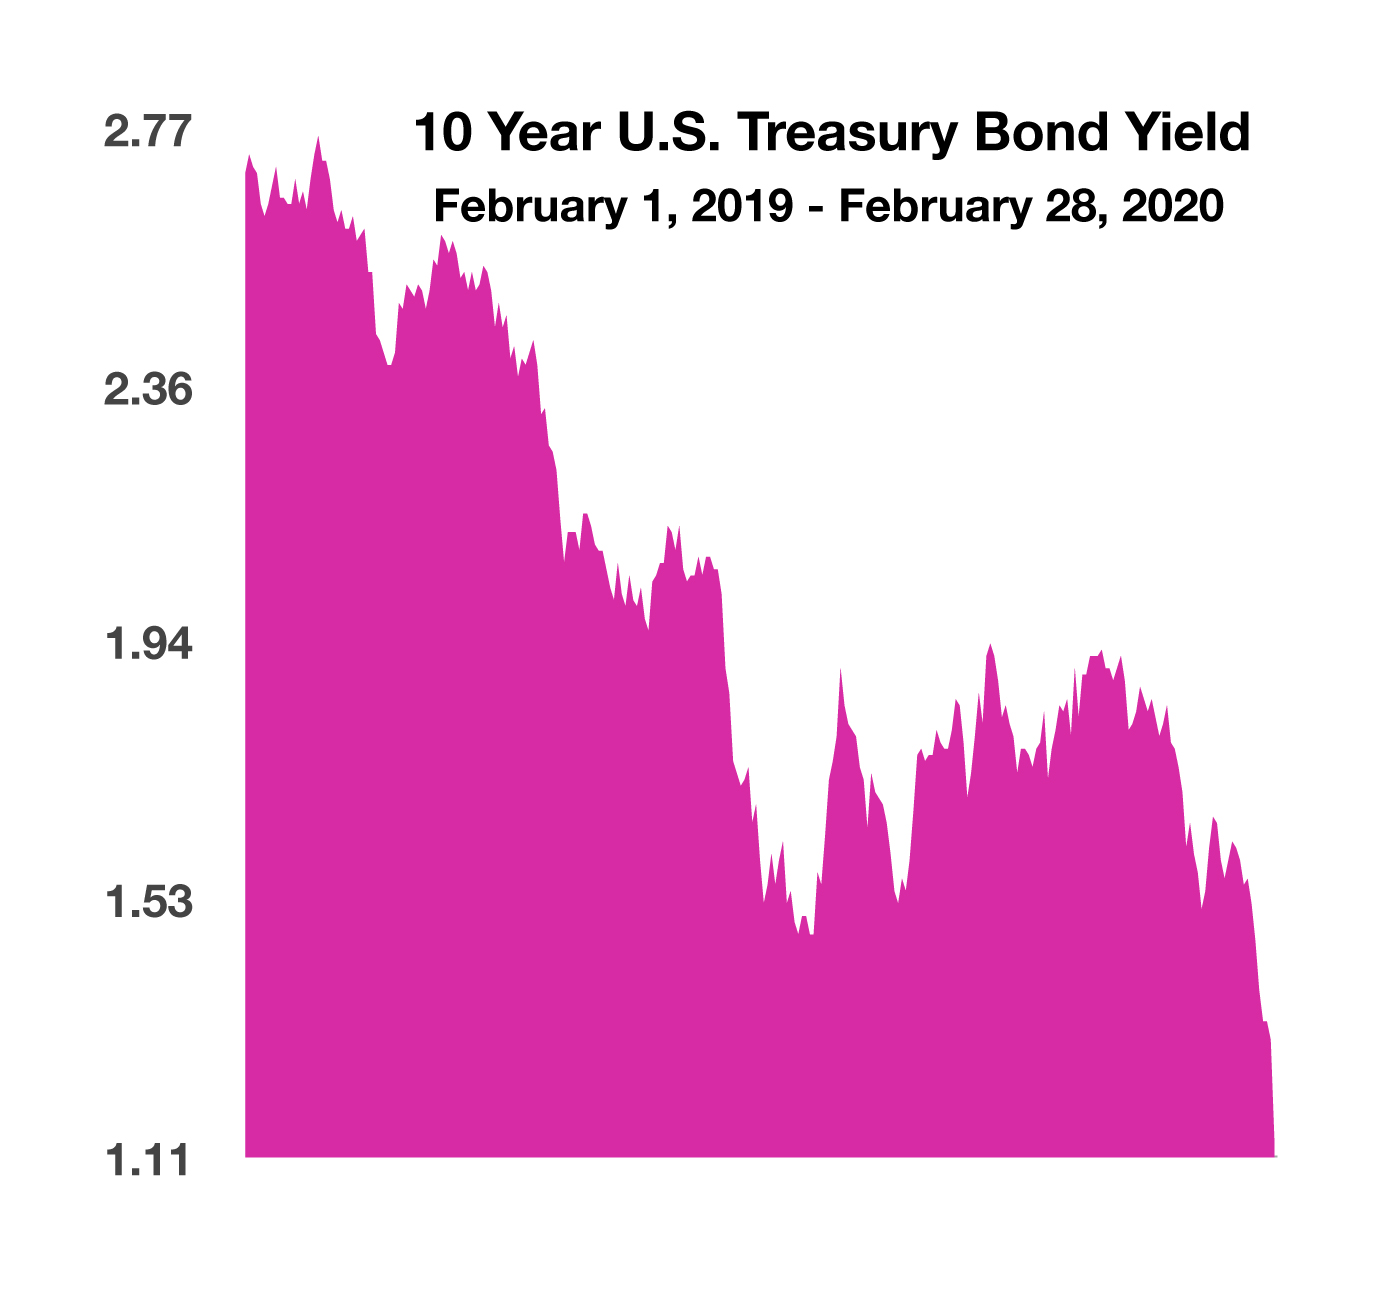
The Federal Reserve helped alleviate markets with a rate reduction announcement as a result of a rare emergency meeting. The rate cut was made in order to maintain liquidity and structure in an already stressed environment caused by the virus outbreak. Fed Chairman Jerome Powell said that “the fundamentals of the U.S. economy remain strong,” yet the coronavirus may pose evolving risks for the economy. Yields on Treasuries fell to historical lows as funds migrated from equities to bonds, driving bond prices up. 

U.S. equities registered their largest weekly losses since 2008, with $3.6 trillion worth of stock values erased within the last week of February. The rapid decline was among the swiftest in market history, creating havoc in all sectors and industries. Global equity markets also saw similar losses as large capitalized international stocks and emerging market equities gave up gains. Global equity valuations retreated due to uncertainty surrounding the extent of the outbreak and its effects on the global economy. Analysts are closely following companies with supply chains tied to China, which has become a widespread concern.

The virus outbreak has affected financial markets differently relative to other more traditional disruptions. Supply chains tethered to China are creating a shortage of supplies and products, while demand had not been an issue until the virus outbreak. Should a vaccine emerge making the coronavirus outbreak a shorter term incident, then pent up demand could propel economic activity higher.

The National Center for Biotechnology Information reports that advancements in medical technology over the years has allowed the development and creation of new vaccines to combat viruses at a faster pace than decades ago.

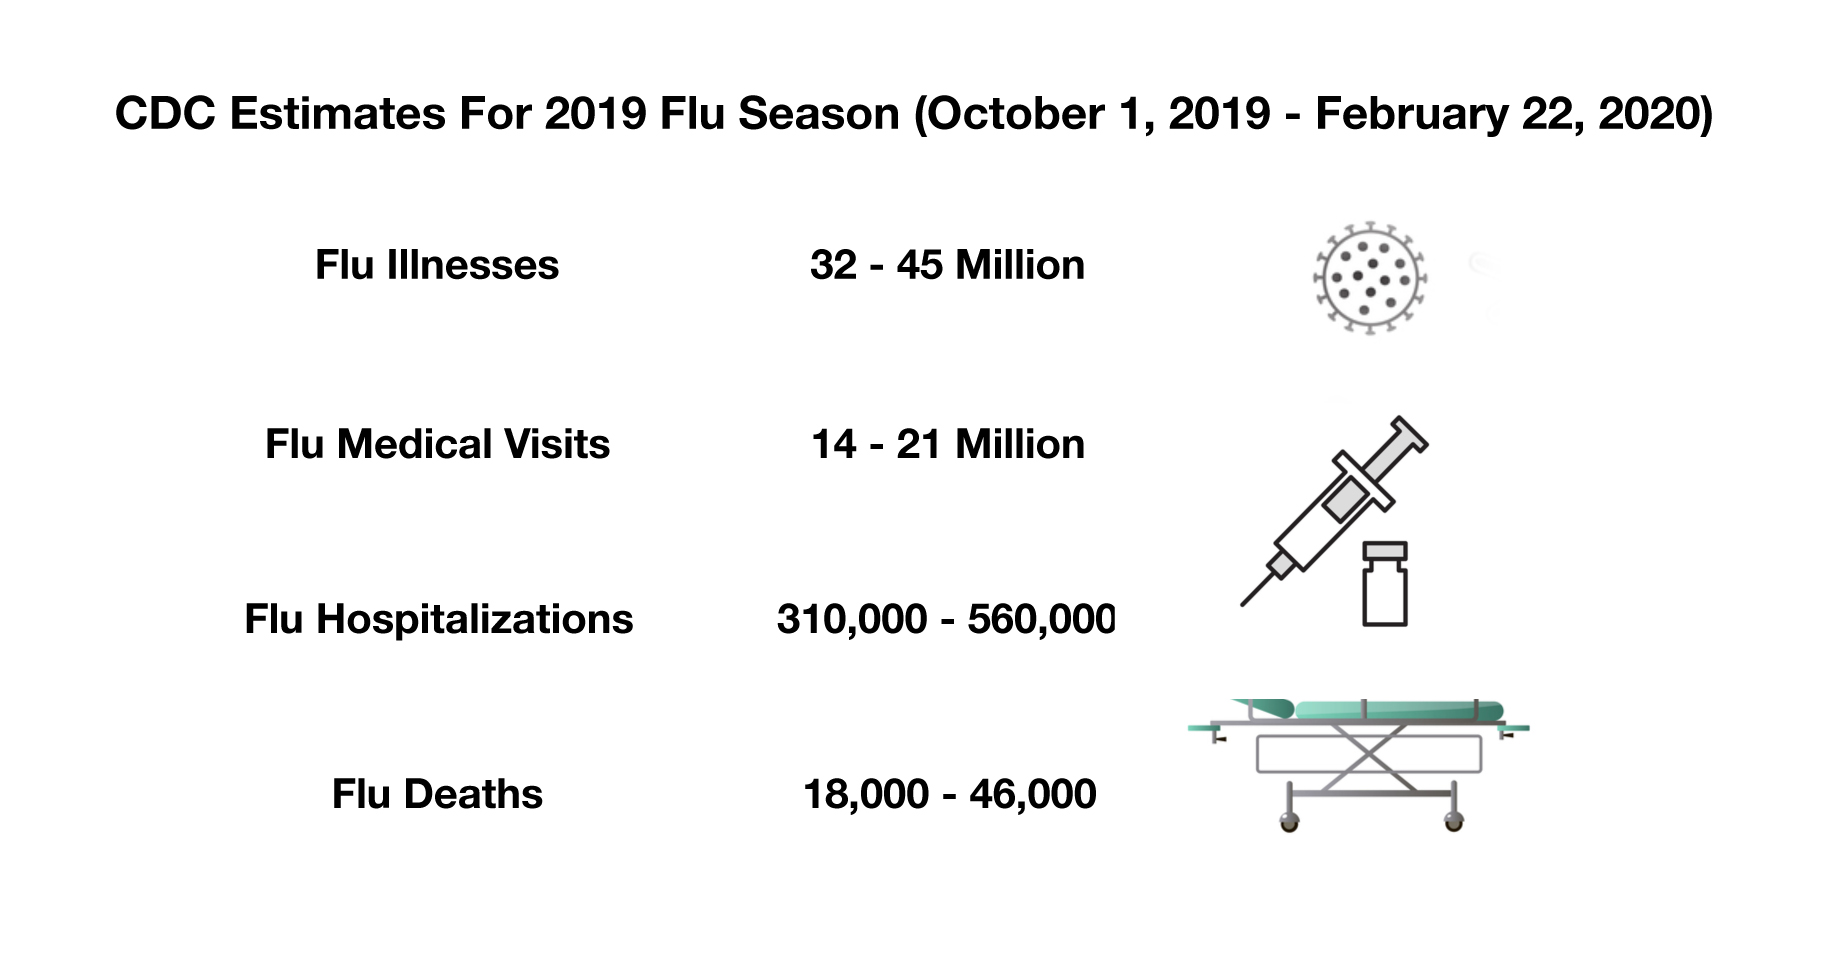
The extent of the coronavirus can be put into perspective as related to influenza, also known as the flu, which currently affects over 32 million Americans. Flu-related deaths in the United States are estimated to reach between 18,000 and 46,000 this flu season alone, as reported by the Centers for Disease Control. The center also estimates that as many as 45 million Americans will suffer flu-related symptoms and illnesses during this year’s season. (Sources: IMF, World Bank, Fed, U.S. Treasury, NCBI, CDC)

 
the flu will cost the healthcare system and society $11.2 billion this flu season

Equities Slump As Concern Elevates – Stock Market Overview

February saw stock valuations retreat to where they were in June 2019.  Analysts believe that the pullback has helped identify several overvalued stocks. Valuations are considered to be more in line with historical standards relative to where they were at the beginning of the year. The final week of February saw all equity indices fall substantially.  All major indexes are now down ~20% from the highs seen a mere 2 weeks ago.

The pullback among all major equity indices has been one of the fiercest in market history, yet reigning in valuations that were considered lofty by many analysts. Fortunately, the stellar performance of the equity markets in 2019 is serving as a buffer for the dramatic pullback. 

When U.S. equity markets fell 14% over two months in 2003 during the SARS outbreak, rates were much higher, with the 10-year Treasury yielding over 3.5%. The yield on the 10-year Treasury on Feb 28th at 1.13% is lower than the current S&P 500 Index yield for stock dividends at 1.97% on Feb 28th. Analysts view the yield difference as a benefit for stocks for yield seeking investors. (Sources: S&P, Dow Jones, Nasdaq, Bloomberg, U.S. Treasury)

Treasury Bond Yields Drop To Historic Lows – Fixed Income Update

Treasury bond yields traded at record low levels, driven by global investors seeking safe haven assets. All Treasury maturities yielded well below 2% at the end of February, lower than the Fed’s inflation target of 2%. The dramatic drop in yields brought the 10-year Treasury bond yield to 1.13 % at the end of February, the lowest yield for the 10-year Treasury on record. An insatiable demand for global bonds brought yields lower across all bond sectors, elevating positive returns for bonds in nearly every sector thus far this year.

The Federal Reserve reduced the Fed Funds rate, a key monetary tool rate, following a rare emergency meeting. The rate reduction was made with hopes of stemming market uncertainty and shoring up liquidity for extended periods of volatility. The announcement triggered a drop in bond yields across various bond sectors. (Source: U.S. Treasury)

Economic Cost of The Flu – Domestic Economy

As a gauge of how a virus can affect the U.S. economy, the National Center for Biotechnology Information monitors and tracks the economic costs related to the flu every year.

The estimated average annual total economic burden of influenza, also known as the flu, to the healthcare system and society stands at $11.2 billion, which includes medical expenses such as hospitalization, physician visits, and vaccines.

A present concern with the coronavirus is the productivity costs associated with the loss of employee attendance, business travel restrictions, and amplified preventive measures. The flu virus has for decades inflicted companies in all industries with heightened productivity costs. (Source: https://www.ncbi.nlm.nih.gov/pubmed/29801998)

 
the SARs virus resulted in 774 deaths in 17 countries

U.S. Household Size Shrinks – Demographics

Family size is shrinking in the U.S., with only 2.52 members per household on average in 2019, making it the smallest size ever in the country’s history. Historical data tracked by the U.S. Census Bureau showed an average family size of 5 in 1880, double by today’s standards. The decline in family size is believed to be attributable to various economic and social changes over the decades.

Roughly 63% of households in the U.S. consist of two or fewer family members. The Census Bureau also tracks family size by state. Utah has the largest household size at 3.12 family members, while Maine has the lowest at 2.28 members.

Smaller households materialized over the past 60 years, with one-person households accounting for 28.4% of the U.S. total in 2019, up from 13.1% in 1960. Households of four or more decreased from 40.2% in 1960 to 22.1% in 2019, nearly dropping in half. (Sources: U.S. Census Bureau, Historical Statistics of the United States)

Past Pandemics & What Came Of Them – Health Overview

Over the decades, pandemics have evolved and lasted for varying periods of time, yet always culminating with the containment and/or elimination of a virus. Should history repeat itself, a vaccine will eventually emerge to combat the COVID-19 virus, thus alleviating the threat of further immediate contamination.

Even though scientists have not identified how to stop a virus outbreak before it starts, advancements in medical technology over the past 17 years have drastically reduced the time it takes to develop and implement a vaccine after a new virus emerges.

The current coronavirus outbreak has been preceded by two similar outbreaks since 2003, Severe Acute Respiratory Syndrome (SARS) and Middle East Respiratory Syndrome (MERS). SARs originated out of China in 2002, spread worldwide and was contained within a few months. The World Health Organization (WHO) tracks deaths related to pandemics globally. The organization found that the SARs virus resulted in 774 deaths in 17 countries. MERs, also known as the camel flu, resulted in 862 deaths.

Joint efforts among international governments and nonprofit research entities have allowed extended research on emerging infectious diseases worldwide. Several groups and scientists from various countries are already underway trying to develop a vaccine for COVID-19. (Sources: The National Center for Biotechnology Information, WHO)

 
China accounts for roughly 16.3% of global GDP

China’s Share In The Global Economy – Global Trade

The global spread of the coronavirus has affected consumers in countries across the globe, curtailing demand for products mainly manufactured in China. It is expected that as worldwide demand for Chinese products decreases, the country’s primary economic component, manufacturing, will abate, thus hindering the country’s economic expansion.

Based on 2019 data, the top five economies in terms of GDP are the U.S., China, Japan, Germany, and India. These five alone account for 55% of total global GDP of $86.31 trillion. China accounts for roughly 16.3% of global GDP. 
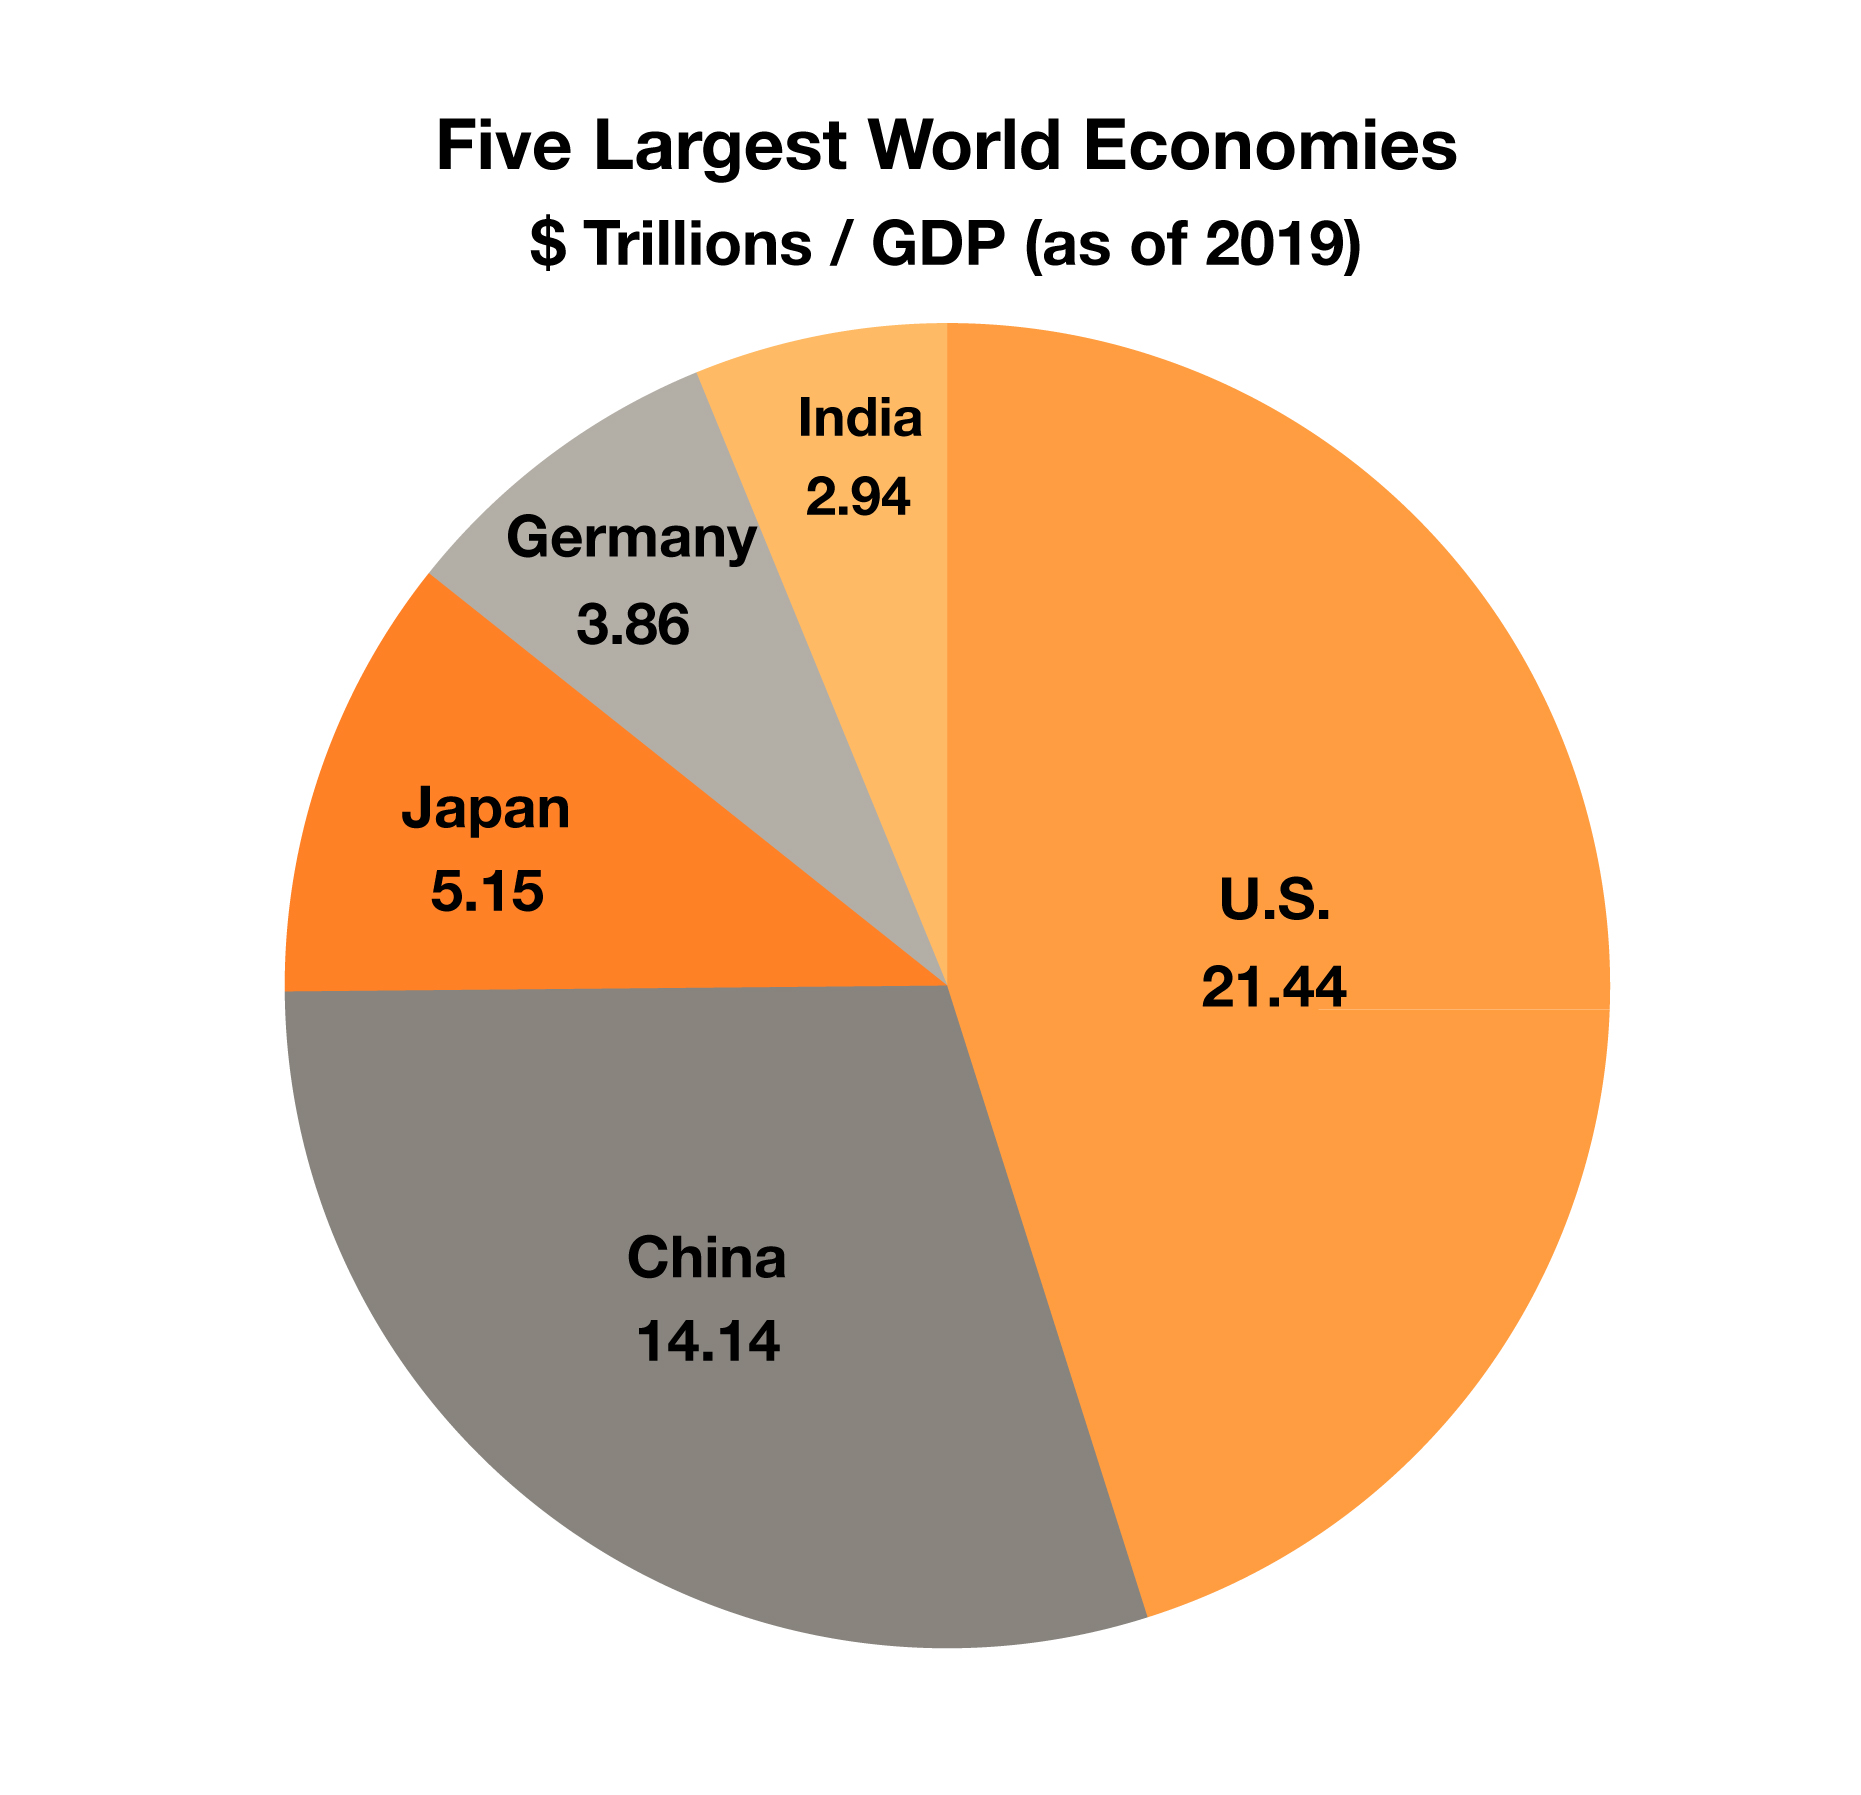
China is referred to as “the world’s factory,”producing a broad range of items from shoes and socks to hammers and computers. The country’s enormous manufacturing base allows it to export massive volumes of goods globally, meeting demand from nearly every consumer in the world. China has experienced exponential growth over the past few decades, from a GDP of $305 billion in 1980, to over $14 trillion this past year, making it the second largest economy after the United States. The difference in GDP between the two nations’ economies has been shrinking over the years, as Chinese economic growth has consistently outpaced that of the United States. (Source: World Bank)

Sudden Drop In Mortgage Rates Spurs Housing Buffer – Housing Market Update

The abrupt drop in interest rates has brought about a boost to the housing market in the form of lower mortgage rates. The rate for a conforming 30-year loan fell to 3.45% at the end of February, nearly a full percentage point from a year earlier. 

Falling interest rates have prompted an increase in mortgage activity as the cost to borrow for homebuyers has become less expensive. Mortgage rates fell in late February approaching the lows last seen in 2012, when the rate for a conforming 30-year loan was 3.37% in October 2012. The challenge for many homebuyers has been rising home prices and affordability throughout the country. Slow rising wages and stagnant incomes have, for the most part, not kept up with rising home prices. Even though mortgage rates have dropped, housing prices are still elevated to the levels that force many to wait or rent until housing prices drop.

Mortgages accounted for two-thirds of the $14 trillion in U.S. household debt in the last quarter of 2019. Because they are typically paid off over decades, mortgage rates tend to be correlated with 10-year Treasury bond yields rather than with the short-term rates controlled by the Federal Reserve.

Sources: Federal Reserve Bank of St. Louis, Freddie Mac

 
Fixed Income Update - Interest Rates

Interest Rates

A flight to safety sent bond prices sky-rocketing and rates across the curve to historic all-time lows.  The 30-year treasury increased in price 19 points in 5 trading days and yields plummeting from 1.72% on March 2nd to an astounding 0.97% on March 9th.  In 30-years of trading bonds we have never seen a move this dramatic.  Below is the one-month chart of of the 30-year treasury:

As the chart shows, the 30-year was trading slightly below $100 on Feb 20th and reached an incredible $135 on March 9th.  Investors began piling on the trade initially as a safe-haven and finally even risk averse investors began throwing in the towel looking to ride the train as the returns on the 30-year were simply too good to be missed.  It has become the greater fools theory in play as investors are taking a massive amount of risk for fear of missing out on one of the only places to get a positive return as stocks tumbled.  At one point the 30-year had returned over 30% in a matter of a couple of weeks.

 
Fixed Income Update - Yield Curve & Fed Funds

Yield Curve & Fed Funds

On March 3rd the Fed held an emergency meeting in which they cut the Fed Fund’s rate 50 basis points from 1.75% to 1.25%.  Initially, the yield curve widened but the massive rally in longer maturity treasuries quickly sent the yield curve to the tightest levels seen in months.  The chart below shows the 30’s to 5’s yield curve which for most of the last year had been the widest part of the curve. hovering between 30 and 50 basis points:

As the chart shows, the curve had been steady at around 30 basis points prior to the cut then moved dramatically wider reaching almost 50 basis points after the cut.  However, as the rush to safety sent investors purchasing longer treasuries, the curve quickly tightened and at one point was inside 10 basis points.  All the short to long maturity curves  (2’s to 30’s, 2’s to 10’s) saw similar action and are at multi-month tight levels.  This is likely to widen back out as the Fed is expected to make further cuts in the coming months.  This is important for investors that followed our yield curve steepening trade as many of the bonds with 25 basis points strikes or wider will see the coupons (at least temporarily) go back to zero.  We recommended moving out of that trade as the bonds were up 20% – 30% since we recommended them.  As we discussed in our recession report several months ago, these rate cuts illustrate the box the Fed has put itself in by keeping rates too low for too long.  They simply have very few effective bullets to fire and now any further recessionary pressures will have to be fought using less traditional tools by the Fed as well as Fiscal Policy. As we discussed, prior to previous recessions the absolute levels of interest rates were much higher – Fed Funds usually sat at over 5% prior to a recession making a cut from 5% or higher to 1% meaningful and we question how effective moving from this cycles high of 2.4% to 1.25% will actually be on stimulating loan demand and economic activity.

 
Fixed Income Update - Credit Spreads

Credit Spreads

As we have discussed for years, investors have been taking too much risk for a very small gain in yield by piling into high-yield bonds at historically low spreads over treasuries (this is the risk premium investors receive for taking the credit risk in these bonds).  We have cautioned investors on the coming corporate debt bubble and how they could face massive losses when these spreads move dramatically wider during the next recession or credit event.  Below is a 1-year chart of high yield credit spreads.

Going into this sell-off, investors were receiving a 3.38% premium for purchasing junk bonds, this quickly moved to over 5% as volatility picked up.  This is called credit spread widening and greatly affects the price of bonds that investors are currently holding.  To put this in dollar terms, if you owned a 10-year junk bond this 170 point spread widening would equate to a price drop of approximately 16 points (or $160,000 per $1mm).  During the Great Recession, junk bonds were trading at a spread of over 2000 basis points.  It is easy to imagine the price devastation which would occur if we actually enter another recession – even if spreads move from their current 500 basis points to merely 1000 basis points (remember we moved 170 in a couple of trading days) you are talking about price declines of 50%+ from current levels.  We have previously discussed that the spread between investment grade (IG) and junk was also historically tight which means investors were receiving a very low risk premium and cautioned investors to bite the bullet and accept the lower yield on IG.  The last week was proof of why this was a good strategy, while junk widened 170 basis points, IG paper widened less that 30 basis points meaning IG investors saw very small losses compared to junk bond investors.

 
Fixed Income Update - Volatility

Volatility

Our discussion of credit spreads would be incomplete without including the role volatility plays in the credit markets.  Credit spreads are basically a function of volatility – in a low volatility environment investors are willing to take on additional risk and demand less risk premium in the bond portfolios.  For years we have been in a low rate/low volatility environment and this combination has caused fixed income investors to chase bonds to the point where the spreads do not reflect the actual risk involved.  That all changed this week as the equity markets plummeted.  Below is a 1-year chart of the VIX which is the index of volatility:

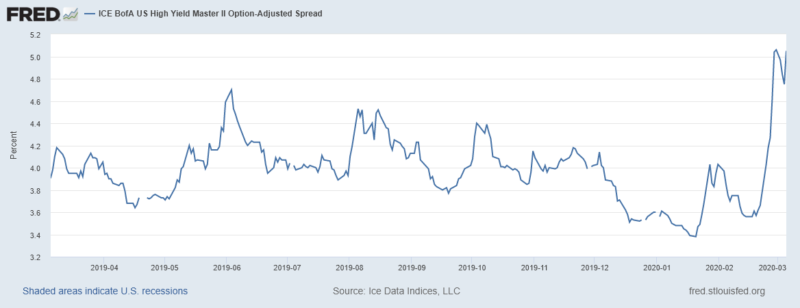
For the last several years the VIX has remained relatively muted hovering in the mid teens with a few short spikes above 20.  In one week the VIX spiked from 14 to almost 54, moving 11 points in a single day.  This is one of the largest moves in history and puts the VIX at a higher level than during the great recession.  When VIX moves higher bond investors begin to demand higher yields or back off entirely from buying.  The “risk off” trade becomes popular which is the reason for the rally in treasury bonds – everyone is rushing to safety.  This time it was so extreme that the returns on treasuries suddenly became so attractive that it brought in speculators looking to boost returns.  However, these investors are trading one type of risk (credit) for another type of risk – Duration risk. The longer a bond is the more sensitive the price becomes to changes in interest rates.  As we saw in the interest rate discussion, the long bond was up 35 points at on point for the month but these speculators are now taking a massive amount of duration (price) risk should rates move higher.

Interest rates, credit spreads and volatility all add up to the final risk we will discuss – liquidity which means something completely different for bond investors than for the general investing public and can ultimately create some of the best investment opportunities for those with cash to put to work.

 
Fixed Income Update - Liquidity

Liquidity

If you watch CNBC, you might think the markets have been orderly and “liquid” as most of the talking heads are discussing liquidity in terms of the equity markets or bank lending but in the bond market it is a very different story.  On March 9th, Bloomberg news reported “Bid-Ask Spreads Blow Out in Junk Market as Buyers Become Scarce”.  In the story they reported that the Bid-Ask spread in some junk names had widened to TEN POINTS.  That means the difference between what a buyer was willing to pay and a where a seller was willing to sell was, in some cases 10 points.  This is unheard of in the equity (or almost any other) markets where the bid ask is generally pennies.  At the moment Apple (AAPL) is quoted $273.03 by $273.10 – a difference of $.07 cents.  Imagine the dysfunction if AAPL was quoted $273 by $283 but in times of volatility that becomes common in the bond market where there is generally no “quoted” market and bonds trade by “appointment” meaning a buyer and seller have to come together and agree on a price.  We wrote about this a few months ago quoted the Fed on liquidity:

“There has been a growing concern as of late that liquidity conditions in even relatively liquid bond markets
have deteriorated in recent years. If this is so, then even modest events may trigger an unexpected and
undesirable disruption in financial markets. In the summer of 2013, for example, when Fed chair Ben
Bernanke hinted at a possible slowdown in the pace of Fed bond purchases, the bond market reacted
violently in what was described as a “taper tantrum.” Another example is the Oct. 15, 2014, “flash rally” in
which the 10-year on-the-run U.S. Treasury experienced an incredible 40 basis point movement in a single
day for no apparent reason. According to a report released by the U.S. Treasury Department, it seems that
for a brief period of time there were far more trades to buy Treasuries than trades to sell. That this
happened in the most liquid of all bond markets raises a concern with other less-liquid bond markets.
Might a modest increase in the Fed policy rate induce a “rush to the exits,” forcing a fire sale of bonds into
an illiquid market to meet redemption payments?”

It is important to understand, that this lack of liquidity and spread widening occurred when things were relatively “orderly” without the “forced” sellers that we will certainly see in the next credit event.  During the great recession, there was often NO bid for certain corporate and mortgage-backed bonds.  Sellers were forced to continuously lower their prices to find a buyer and it often took days.  This is a unique characteristic of the bond market and is a reason the bond market can offer fantastic bargains in times of extreme volatility.  Bond managers tend to get forced to sell a certain asset class or name in unison causing a “rush to the exits” scenario and is when investors with cash can step in and “steal” bonds at prices far below their intrinsic value.

 
Review and Conclusions

Review and Conclusions

Interest rates have fallen to historical lows with nearly every maturity trading below 1% which is lower than during the great recession. Credit spreads on junk bonds have blown out almost 200 basis points.  Liquidity (or lack thereof) has pushed bid/ask spreads as wide as 10 points on some junk bond issues.  There are almost no new issues getting priced in the market further illustrating the lack of liquidity.  Volatility has spiked to historic high’s.  The credit markets are spelling trouble and investors should pay attention.

While there are cracks beginning to show, the bottom has yet to fall out.  However, if this virus is not contained or worsens over the next 2-4 weeks we would expect to see the real damage begin.  Ratings agencies have already announced they expect to accelerate corporate bond downgrades and depending on the names and the number of downgrades this could be the catalyst that finally burst the credit bubble.  If it is not the beginning of the credit bubble and this is simply another correction in the longest and weakest bull market in history then there will be some real pain for the “follow the herd” crowd that has piled into the long treasury trade.  However, if this is the beginning of the next credit bubble then the pain for existing credit holders is going to be severe.

We have said for 2-years now that income investors should hold high quality short duration assets and wait for the coming opportunity.  Already there have been some opportunities to pick up IG rated 1-5 year bonds at attractive yields.  We recently purchased a large block of a BBB rated 5 year CMBS at over 7.5% that weeks ago would have traded in the 5% range and keep in mind that was after the treasury had rallied over 50 basis points meaning the spread to the treasury was even greater than it was pre-virus.

At the moment, we see no reason to rush into risk and would remain cautious and would wait for a better spot.  If this is the beginning of the credit rout there will be opportunities not seen since the great recession for fixed income investors to lock in much higher yields.