Ocean Park Capital Management

2503 Main Street

Santa Monica, CA 90405

Main: 310.392.7300

Daily Performance Line:  310.281.8577

February 2021
Market Update
(all values as of 04.30.2024)

Stock Indices:

Dow Jones 37,815
S&P 500 5,035
Nasdaq 15,657

Bond Sector Yields:

2 Yr Treasury 5.04%
10 Yr Treasury 4.69%
10 Yr Municipal 2.80%
High Yield 7.99%

YTD Market Returns:

Dow Jones 0.34%
S&P 500 5.57%
Nasdaq 4.31%
MSCI-EAFE 1.98%
MSCI-Europe 2.05%
MSCI-Pacific 1.82%
MSCI-Emg Mkt 2.17%
 
US Agg Bond 0.50%
US Corp Bond 0.56%
US Gov’t Bond 0.48%

Commodity Prices:

Gold 2,297
Silver 26.58
Oil (WTI) 81.13

Currencies:

Dollar / Euro 1.07
Dollar / Pound 1.25
Yen / Dollar 156.66
Canadian /Dollar 0.79
 

Portfolio Overview

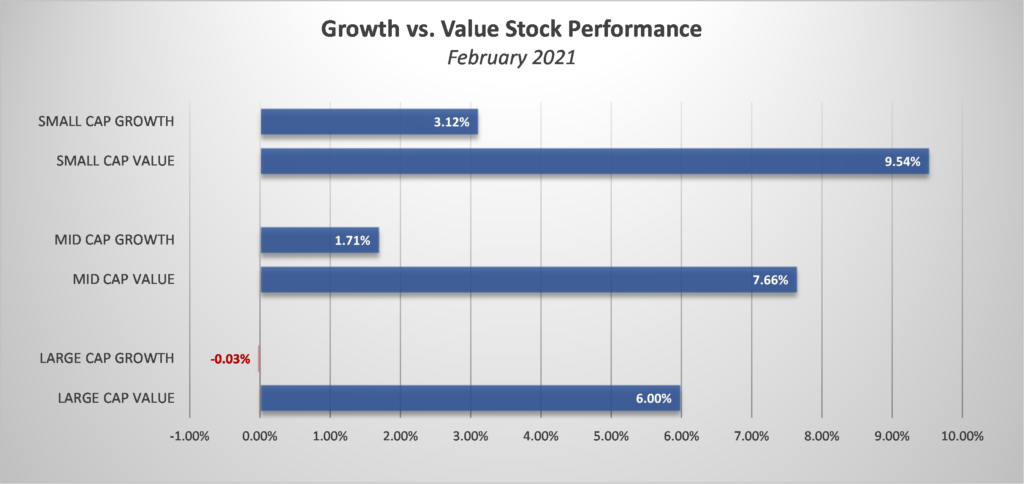
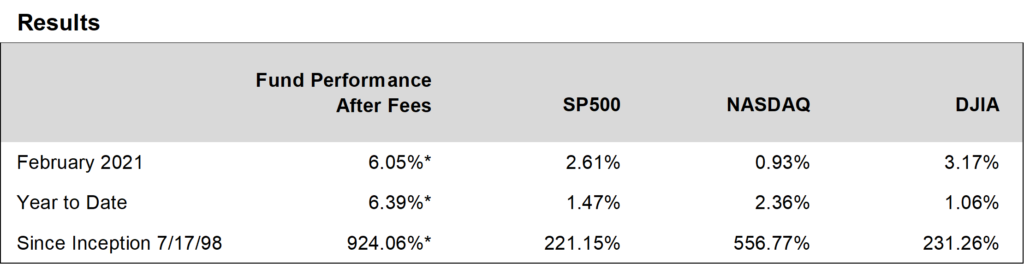
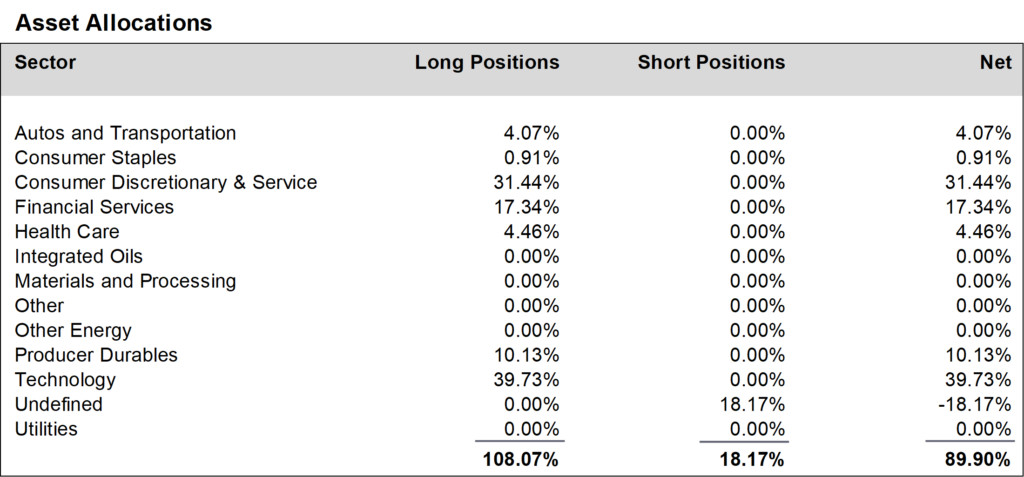
Ocean Park Investors Fund gained 6.05%* in February, beating the S&P 500 (up 2.61%), the NASDAQ Composite (up 0.93%), and the Dow (up 3.17%).  The fund also beat the HFRI Equity Hedge Index (up 4.99%).  In the November newsletter, we identified a market shift favoring value stocks over growth stocks.  Since then, we have been more sensitive to opportunities among the value group, particularly the financials.  This proved fortuitous as our financial stocks, comprising about 17% of the portfolio, generated almost 40% of our gain in February.  Among the outperforming financials were Silvergate Capital (up 37%), Wells Fargo (up 21%), and Morgan Stanley (up 15%).

During February, we reduced positions in the autos and transportation sector, the consumer discretionary and service sector, the producer durables sector, and the technology sector.  We offset these reductions by decreasing our short position in the QQQ ETF.  The result was that we finished the month at about 90% net long, down from about 94% in December.


Daily updates on our activity are available on our Results Line, at 310-281-8577, and current information is also maintained on our website at www.oceanparkcapital.com. To gain access to the site enter password opcap.

*These results are pro forma. Actual results for most investors will vary. See additional disclosures on page four. Past performance does not guarantee future results.

 
Equity Overview

Equity Overview

Stock market results were mixed in February, with most sectors gaining ground for the month.  Energy was again the best performer, for the third consecutive month. Utilities were the weakest.

Continuing the January trend, value stocks outpaced their growth counterparts.

Volatility was modest until month’s end, when the S&P 500 moved more than 1% in three of the last four trading days.

Meanwhile, 4th quarter earnings reported in February continued the trend of outstanding results reported in January.  With 96% of S&P 500 companies now reporting, the blended earnings growth rate for 4th quarter earnings is now positive 3.9%, significantly better than the consensus estimate of negative -9.2% at the end of December.  In addition, 79% of companies reporting beat consensus earnings estimates and 76% beat consensus revenue estimates, in both cases meaningfully above the one-year and five-year averages.  If the 79% earnings beat rate holds at the end of the reporting season, it will be the third highest since FactSet began tracking it in 2008.  Moreover, if the blended earnings growth rate holds at +3.9%, it will be the first quarter of year-over-year earnings growth since December 2019.


Macro Overview

Macro Overview

Pandemic news was favorable in February as the new administration implemented its national program for mass vaccination, leading to reductions in Covid-19 hospitalizations and deaths.

Economic data reported in February was also positive as manufacturing, factory orders, durable goods orders, retail sales, and housing all showed strength.  Reflecting the prospect of recovery the 10-year treasury note, which was well below 1% for much of 2020, climbed to 1.5%.

Notwithstanding the economic upheaval of the last year, personal savings are increasing at an astonishing pace:  $1.4-trillion in February 2020 rose to $2.35-trillion in December 2020 and $3.95-trillion in February 2021.  Analysts project that as the pandemic subsides and Americans start spending again, the impact on the economy will be dramatic.  Consensus estimates for GDP growth in 2021 are in the 6-7% range, a level not seen since 1984.


Additional Disclosures

Additional Disclosures

Performance data for OPI reflect the reinvestment of dividends and other earnings on the fund’s assets.  Performance data for the major indices reflect only changes in the value of those indices, and would be higher if dividends were included. However, the index data do not reflect fees that would be paid to index fund managers and transaction costs that would be incurred when their component stocks are bought or sold, while OPI’s data do reflect quarterly fees and expenses incurred by the fund.  The information provided is believed to be reliable, but its accuracy or completeness is not warranted. This material is not intended as an offer or solicitation for the purchase or sale of any stock, bond, mutual fund, or any other financial instrument. The views and strategies discussed herein may not be appropriate and/or suitable for all investors. This material is meant solely for informational purposes, and is not intended to suffice as any type of accounting, legal, tax, or estate planning advice. Any and all forecasts mentioned are for illustrative purposes only and should not be interpreted as investment recommendations.