Macro Overview – May 2016

Macro Overview – May 2016

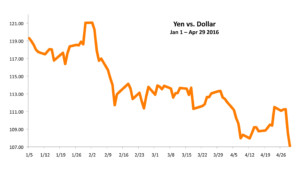
The prospect of a delayed tightening by the Fed, a weaker dollar, and a rebound in commodities helped stabilize equities in April. A falling U.S. dollar along with central banks in Europe and Asia trying to stem the rise of the euro and yen, is indicative of a currency war looming in the shadows. A weaker dollar makes U.S. products cheaper and the U.S. more competitive internationally, a concern to both European and Asian exporters.

Commodity related currencies from countries as Australia, Russia, Canada, and Brazil saw rebounds against the dollar in April, elevating assurances that a demand for commodities is still intact. Economists view this as a measure of a global economic revival.

Following years of debate and assistance, the IMF is considering letting its support for Greece go and cease participating in any further Greek bailouts. Such a possible move would force countries with dire fiscal constraints to reassess their financial policies.

The Labor Department reported that jobless claims for unemployment benefits fell to their lowest level since 1973, historically representative of a strong labor market. Employment data also revealed that there is a growing number of part-time workers rather than full-time workers encompassing the labor force. Various research reports have suggested that the implementation of the Affordable Care Act, whose major provisions were phased in by January 2014, encouraged employers to shift workers to more part-time positions in order to avoid having to cover them under the newly mandated health insurance requirements.

Records maintained and released by the IRS have identified a sharp rise in 1099 income filings as of 2014. 1099s are issued for any income generated over $600 during the tax year. Many economists believe that such dynamics is a validation of full-time employee positions being replaced by part-time independent contractors.

A strengthening Japanese yen over the past few weeks has led some analysts to believe that risk aversion may be a cause. A stronger yen and a weaker dollar has historically signaled less confidence in U.S. growth and a heightened attentiveness to global dynamics.

Sources: Labor Dept., IMF, IRS

Equity Update

Major domestic stock indices were essentially flat for the month of April after U.S. equities reached record levels not hit since July 2015, sending the Dow Jones Industrial Average to the 18,000 level.

Defensive stocks pulled back in April, a signal that buyers are less risk averse and leaning towards more aggressive growth company stocks. Other optimistic sector trends evolved in April as small caps, cyclicals, and multi-nationals outperformed more conservative large cap and defensive equities.

Some investors celebrated the seventh year of the bull market that began in March 2009. Even with the volatility and pullbacks over the 7-year period, it is still considered the second longest bull market in the market’s history.

Sources: Dow Jones, S&P, Bloomberg

 
New Fiduciary Rules Were Introduced In April 2016

Explanation Of The New Fiduciary Rules

A significant regulatory announcement was made in early April by the Department of Labor and the Securities & Exchange Commission about who can actually advise on retirement accounts. The accounts affected include IRAs, SEPs, pensions, and 401ks.

The new fiduciary ruling comes directly from the Department of Labor and is only affecting retirement accounts for the time being. What it exactly says is that any advisor providing investment directive or oversight to individuals who have retirement plan assets such as 401ks, profit sharing plans, and IRAs are obligated to put the best interests of the investor first. It also states that investment advisors must disclose any conflict of interest that might prevent the advisor from acting in the best interest of the individual. Implementation of the new mandates and requirements should have no new significant costs to the U.S. government. The rules are expected to save investors from hidden costs and fees in the retirement accounts according to a report released by the White House’s Council of Economic Advisers. The impact of higher costs and lower returns from conflicts of interest within retirement accounts has resulted in annual losses of about 1% for those investors affected.

When it comes to investment advice financial advisers are separated into two different categories, registered investment advisors and brokers. Registered investment advisors (RIAs) are required to act as a fiduciary and in the capacity of a fiduciary, meaning that all recommendations must be in the best interest of the investor. Brokers, however, adhere to what is called a suitability standard, which means that as long as the recommendation is suitable, it doesn’t have to be what the broker believes is best for the investor.

Because of the new rules, the future of managing and advising assets will change over the course of the next couple of years. Advisors that sell products with a commission will be severely limited effective January 2018 for all retirement related accounts. The government is essentially saying that products and commissions are not good for retirement investors, and advisors need to modify their skills to that of a registered investment advisor (RIA).

A registered investment advisor (RIA) is not a typical advisor. A typical advisor, or broker, is considered more of a sales person that sells investment products and earns a commission. A registered investment advisor acts in a fiduciary capacity, meaning that all investment recommendations must be in the best interest of the client while taking into consideration all of their short-term and long-term needs.

The view has been that commissions are a short-term incentive for advisors to “sell” an investor on, while the role and process of a registered investment advisor (RIA) is long term and perceived as more beneficial to investors.

Sources: Dept. of Labor, SEC, ERISA, White House’s Council of Economic Advisers


Currency Update

Japanese Yen Surges – Currency Update

The yen has risen over 10 percent against the dollar so far this year, with any additional gains intensifying speculation that the Bank of Japan would intervene sooner rather than later, as Japanese politicians have raised concerns about the yen’s run-up. Japan’s rising currency is making Japanese exports form cars to pens more expensive worldwide, stifling any stimulus efforts that had originally been enacted.

Japanese Prime Minister Shinzo Abe is scheduled to visit Italy and Germany in May where it is believed he will try to set the stage for a possible intervention in currency markets as Japan prepares to host a G7 meeting later in the month.

Some currency analysts expect a possible resurgence in a currency war should the yen and other major currencies continue to rally versus the U.S. dollar. Yen vs Dollar

Competitive devaluation of a nation’s currency, also known as a currency war, is a condition in international affairs where countries compete against each other to achieve a relatively low exchange rate for their own currency.

The benefits of a devaluing currency for a nation’s economy include an increase in exports, which may result in additional manufacturing and employment. A significant hindrance of a devaluing currency would be imports becoming more expensive, thus indirectly causing inflationary pressures within an economy.

Source: Federal Reserve Bank of New York

Tobacco: America’s 1st Cash Crop – Historical Note

An enterprising settler in Jamestown named John Rolf was curious whether or not the young colonies could possibly compete in the profitable tobacco business. The climate and soil of the colonies lent themselves well for the cultivation and harvesting of tobacco. Tobacco trade was a monopoly controlled by the Spanish, who grew and harvested the valuable plant throughout the Caribbean and South America.

From a few tender tobacco seeds, the settlers were able to develop fields of tobacco in the early 1600s, with most of it exported to England. Shipments grew steadily, from 20,000 pounds in 1617 to over 1.5 million pounds by the end of the decade.

Before the success with tobacco, the colonies had tried various crops, including timber, potash and wine. All of these failed due to inadequate growing conditions and price competition from other areas of the world.

As tobacco revenue grew, so did immigration, as additional settlers arrived to hopefully gain from the desirable new plant. The demand for tobacco was so great that nearly every field in the Virginia colony was planted with tobacco, not leaving much if any room for food crops such as wheat and corn. The extensive planting of tobacco led to a shortage of food, which prompted the colonial government in 1619 to pass a law requiring a certain amount of corn be planted for every tobacco plant.

By the revolutionary war, the colony of Virginia was growing 55 million pounds of tobacco per year making it the richest and most powerful of the 13 colonies. Today, tobacco is still one of the state’s top ten industries.

Source: Library of Congress

 
Federal Bankruptcy Protection of Retirement Plans

Federal Bankruptcy Protection of Retirement Plans

The Bankruptcy Abuse Prevention and Consumer Protection Act of 2005 clarified the rights of debtors and creditors regarding retirement plan assets. The Act provides an unlimited exemption for retirement plan assets for plans established under the following Internal Revenue Code sections:

• Section 401(a) – tax qualified retirement plans including profit sharing/401(k), money purchase and defined benefit plans. • Section 403 – tax sheltered annuity plans. • Section 457 – deferred compensation plans for tax exempt, state and local government employers. • SEP-IRA, SIMPLE IRA and rollover IRAs are afforded the same unlimited protection. • Traditional IRAs and Roth IRAs created by annual contributions have limited protection up to $1,000,000 for all of those plan types in the aggregate.

To take advantage of the unlimited protection for IRA rollover accounts, a/k/a conduit IRAs, the funds that are rolled over must be segregated from traditional IRA deposits which have only a limited amount of protection. Distributions made to a participant are protected to the extent that the distribution is an eligible rollover. Distributions to satisfy required minimum distributions or hardship distributions would not be considered eligible rollover distributions.

Title I of ERISA requires that a pension plan cannot assign or alienate a participant’s benefits. ERISA defines a pension plan as a retirement plan that provides retirement benefits to employees. If the plan only benefits an owner(s) it is not considered an ERISA Title I plan and could not invoke an ERISA anti alienation rule. A similar rule is provided in the Internal Revenue Code and Treasury regulations. The above bankruptcy act eliminates this exposure if the plan has a favorable ruling from the IRS, i.e. a current letter of determination, or is determined to have a tax exempt plan based upon substantial compliance with the Internal Revenue Code. Even if neither of these qualifications apply the plan may still be a tax exempt plan for purposes of bankruptcy protection if it is shown that the debtor is not materially responsible for the non compliance.

Specific exemptions to the anti alienation rules do exist including:

• A qualified domestic relations order (QDROs) – a court directed distribution due to a marital proceeding. • Up to 10% of any benefits being paid in the form of retirement benefits, e.g. monthly benefits in a defined benefit plan. • Federal tax levies and judgments by the IRS. • Criminal or civil judgments.

The above commentary is a brief summary of the bankruptcy rules governing retirement plan assets. The application of these rules should be discussed with competent counsel knowledgeable in this area of the law.

 
Evolution of the Minimum Wage – Demographics

Evolution of the Minimum Wage – Demographics

For over 74 years, workers in the United States have been granted a minimum wage level for their benefit. An initial attempt to establish a minimum level for wages occurred in 1933, when a depression era mandate set a wage minimum at 25 cents per hour ($4.10 in 2012 dollars). The National Industrial Recovery Act, which was the act that the initial wage evolved from, was declared unconstitutional by the Supreme Court in 1935.

State-Mim-Wages

In 1938, the minimum wage was re-established successfully under the Fair Labor Standards Act. The act held ground because the Supreme Court noted that Congress had the power under the Commerce Clause to regulate employment conditions. Since then, a minimum wage has always been in place and enforced nationally.

Currently, the federal minimum wage is $7.25 per hour, where it has been since the last increase in July 2009. Some states and municipalities have set minimum wage levels higher than that of the federal level. Of the states, Washington currently has the highest minimum wage at $9.19 per hour, while San Francisco has the highest wage as a city, at $10.55, making it the highest minimum wage in the country. San Francisco passed a minimum wage ordinance in 2012 that became effective January 2013.

On May 31st, the California Assembly passed a proposal to increase the state’s minimum wage from $8 to $9.25 per hour. Employers from other states will closely be following the proposal’s progress, to determine what influence California’s increase may have on other states.

Source: Department of Labor

(Astronomical) Cost of Living – By Bob Veres

The rule of thumb in financial planning circles is that you shouldn’t spend more than 25% of your income on housing costs. But if you live in certain cities, it might be a tad difficult to follow that rule. Pity New Yorkers, whose rent costs 63.1% of their income. And New York is cheap compared with other locations.

CA - 2016-5-3 - Expensive Cities
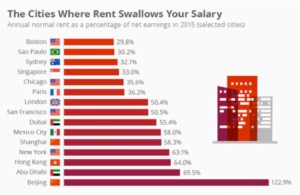
The accompanying chart compiles data from The Global Cities Business Alliance, which compared the average wage of workers in different cities around the world with the average rental cost, creating a percentage that is not favorable in places like Boston (29.8% on average), Sao Paulo, Brazil (30.2%) or Sydney, Australia (32.1%). But those cities are downright cheap compared with New York, Hong Kong (64.0%) Abu Dhabi (69.5%) or the outlier: Chinese capital Beijing, where rental housing costs 122.9% of the average worker’s income. If you lived in Beijing, you would have to pay every dollar you earned, plus borrow money each month, equivalent to a fifth of your total income, just to afford normal housing. From a financial planning perspective, we wouldn’t recommend it.

Source: http://www.forbes.com/sites/niallmccarthy/2016/04/26/the-cities-where-rent-swallows-your-salary-infographic/?utm_campaign=Forbes&utm_source=TWITTER&utm_medium=social&utm_channel


Big Vote in Europe - By Bob Veres

Big Vote in Europe – By Bob Veres

The big question in Europe this year is how the British people will vote on June 23. Will they vote to leave the European Union (what’s being called the “Brexit”) or decide to continue to be part of the 28-nation economic alliance?

What’s at stake? It’s hard to know, exactly. Great Britain already maintains its own currency, separate from the euro, so the vote will be about whether the country continues to pay into the EU budget and adhere to the eurozone’s regulations. Norway is also living outside the EU, yet it contributes to the budget, adheres to the regulations and seems to get most of the benefits of membership—and thereby offers a way for Britain to exit and still maintain all the trappings of membership. The uncertainty over the seven years that would be required to transition out of membership would be over how, exactly, a new relationship would be structured.

The eurozone is suffering from high unemployment, low economic growth and a disparity between the richer (UK, Germany, Skandinavia) and poorer (Greece, Spain) nations. All European Union members are governed by policies created by the European Commission and the European parliament, and subject to the dispute resolution powers of the European Court of Justice. British voters might decide they don’t like the shared sovereignty and ties to the economic problems.

Naturally, there is a lot of lobbying on both sides in the runup to the vote. Economists seem to be uniformly against a Brexit, pointing out the obvious: that it would be hard for London to continue its role the financial capitol of Europe if its nation is not actually a part of the European Union. They point out that, unlike Greece, Britain already controls its own currency, and it is not a part of the passport-free zone, which is shorthand for having control over its own policies in regard to the Middle Eastern refugee crisis.

Those in favor of Brexit say that Britain would be freer to enter into trade deals with other countries (think: China) than it is today, and of course there is a lot of nationalist sentiment about reducing foreign influence over British affairs.

Who will win? The most recent polls show 46% of British voters will cast a ballot to leave the EU, vs. 44% who will vote to remain—and 10% who say they don’t know how they’ll vote. A little more than a month from the actual Brexit election, there appears to be plenty of time for either side to continue pressing their case.

Sources:

http://www.ft.com/intl/cms/s/2/70d0bfd8-d1b3-11e5-831d-09f7778e7377.html#axzz40tXOLR6p

http://www.ft.com/intl/cms/s/2/e7b2d4d4-daea-11e5-98fd-06d75973fe09.html#axzz48O9tGx46

http://www.economist.com/node/21697253

http://www.express.co.uk/news/politics/668624/EU-referendum-ICM-poll-UK-on-course-for-Brexit-Europe-Day

 
Rent or Buy

Growing Number of People Are Renting, Not Buying

With loans difficult to obtain from banks, and with lower incomes than existed a few years ago, renting has become more prevalent for families across the U.S. Since the height of the housing market in 2004, homeownership rates have dropped to 65.2 percent, down from a high of 69.2 percent in 2004. From a historical perspective, homeownership rates are back to 46-year averages, as the housing bubble dissipated since its height in 2004.

Various factors account for changes in homeownership rates, such as employment, interest rates, home vacancies, aging trends, and family growth to mention a few. Even with incredibly high rates, and elevated unemployment in 1980, homeownership was still 65.5% then, not far from current levels. The 46-year average is 65.4%.

As investors have been buying properties to rent, a growing number of renters continue to seek rentals, a benefit for rental owners. Some believe that as the employment markets improve and wages rise, home ownership will increase, while demand for rentals will decrease.

Source: Current Population Survey/Housing Vacancy Survey, Series H-111 Reports, Bureau of the Census

Euro’s Purpose & Challenges – Currency Markets

Since the introduction of the euro to the financial markets in 1999, the intent was to integrate all of the banking activity among countries sharing the newly created currency. This would provide credit to smaller countries, while allowing larger country banks to diversify their loan exposure among various European countries. This process would reduce lending risks and increase liquidity across the region.

By 2009, European banks were the most international in the world, with over 50% of their banking business derived from outside their home country, compared with 28% for U.S. banks in 2009.

The opposite has been occurring for the past few years, where “fragmentation” is becoming an issue. This is when the larger healthier banks are not willing to lend to the smaller banks in less desirable economies, thus dramatically decreasing the access to cheap credit for smaller economies. This unraveling of the cross-border integration of European banks is what has threaten southern and eastern European countries of credit availability.

Cognizant of tight credit availability, the IMF, ECB, and EU members established procedures to better accommodate such dynamics when circumstances dictated it. Thus, Greece was granted generous assistance in 2010 with the onslaught of over 100 billion euros. Since the implementation of IMF support for Greece in 2010, the EU has been preparing for a “Grexit”. Because of carefully monitored capital structures, the EU today is more stable and economically sound than it was in 2010.

Sources: IMF, CIA Factbook

 
The Fed & Inflation

What The Fed Owns & What It Will Sell

The Fed’s current balance sheet is now in excess of $3.8 trillion, made up of various financial instruments. Of these instruments, the largest components include U.S. Treasuries, U.S. Agency Securities, and Mortgage Back Securities (MBS).

The Fed’s bond buying program, also known as quantitative easing (Q.E.), has been buying $85 billion of treasury & mortgage bonds per month in the market. This equates to over $1 trillion in purchases per year.

Because of the importance of the housing market on the overall economy, the Fed closely monitors its progress. The good news for mortgage rates and the housing market remains the support provided by the Feds bond-buying program. With its monthly purchases continuing at a rate of $45 billion in treasury bonds and $40 billion of mortgage bonds, the mortgage rate environment will continue to benefit. However, the concern is what will happen when the Fed starts selling its enormous inventory of bonds. To alleviate fears of a dramatic increase in mortgage yields, the Fed has stated that it intends to hold on to its mortgage bond inventory until they mature. The Fed currently holds $1.4 trillion in mortgage bonds, with bonds maturing as far out as 2040. Interestingly enough, the Federal Reserve funds its operations with interest income from this enormous portfolio. Even by 2025, the Fed will have over $400 billion in bonds on its balance sheet.

Source: Federal Reserve

What’s Getting Expensive – Inflation Review

The Bureau of Labor Statistics closely follows the price of thousands of goods, products, and services that consumers buy each month.

In its most recent release, the Bureau noted that prices have increased roughly 1.5% in the past year, March 2013 to March 2014. The gauge that the Bureau uses to identify price increases and decreases is the Consumer Price Index (CPI). Even though the index shows that inflation is still low relative to its 50-year annual average of 4.1%, there are certain products and services where prices have increased considerably.

Over the past year, household utilities and services have increased the most. The cost to heat homes has increased as propane and firewood costs have risen by over 18% in the past year. Gas utilities for homes and businesses have also risen over 16%.

The government does note that food and energy prices are the most volatile within the index. However, many believe that stripping out food and energy is not an accurate assessment of where prices are headed. When it comes to the heightened price of gas utilities, it’s not the actual cost of the (product) gas, but the cost of delivery. New Environmental Protection Agency (EPA) regulations have also added costs to gas distribution over the past year.

Grocery store visits have also become more expensive, as the cost of milk, eggs, meats, and citrus fruits have all increased in the past year.

Many anticipate that college fees and hospital service fees will rise further as growing demand for education and medical services continues, yet with limited availability.

Conversely, the cost of televisions and cameras have dropped over 10% in the past year, as retailers have aggressively marked down prices along with an increase of inexpensive products on the market.

Sources: Bureau of Labor Statistics, EPA, U.S. Energy Dept., Dept. of Education, Dept. of Health

 
Cash is Here to Stay

Why Cash Isn’t Going Away Anytime Soon – Market Fact

With the onslaught of popular electronic payment methods including bitcoin, Apple Pay and Google Wallet, cash still continues to be the payment method of choice.

The average person still uses cash for transactions every month, and in some cases will only use cash for certain purchases, according to an analysis by the San Francisco Federal Reserve Bank.

Various benefits for cash still exists, where credit cards or electronic payment forms just can’t compete. The most compelling reason to use cash is the fact that it is anonymous, meaning that the person spending the money is invisible, relative to making a payment with a credit card or electronic method that can be tracked and identify who’s spending. 100 Dollar Bill Image

The San Francisco Fed study found that the average person pays with cash about 23 times a month, more often than credit cards and electronic payment forms. Most cash transactions are used for purchases of under $25. The study also identified 18-24 year olds preferring cash to other payment forms, maybe due to the lack of credit card access available to younger consumers and students.

Of the various U.S. currency denominations in circulation, the 100 dollar bill is by far the most popular and the single most printed note. For the past two years (2012 & 2013) the 100 dollar bill has been the most produced note by the U.S. Bureau of Engraving & Printing, with over 3 billion individual 100 dollar bills printed in 2012, and over 4.4 billion 100 dollar bills in 2013.

Over 90 percent of currency printed by the U.S. Bureau of Engraving & Printing goes to replacing old and tattered bills already in circulation. So interestingly enough, rather than replacing old bills with new electronic payment forms, cash continues to be king.

Sources: San Francisco Fed, U.S. Bureau of Engraving & Printing

Net Migration Rates – Global Demographics

Recent debate surrounding immigration policies in the United States has prompted a considerable amount of controversy. Immigration is currently an international issue as well as an ongoing dynamic that has existed for hundreds of years when considered from a historic perspective.

For centuries, wars, disease, and famine have jettisoned inhabitants of countries to other countries in search of safety, food, and work. This dynamic continues today as people from countries in precariously chaotic conditions leave in search of peace and a sense of security. The countries in unstable regions due to political unrest, religious debate, and civil combat are among the largest losers of people such as Syria, Pakistan and Senegal. Conversely, neighboring countries have been experiencing dramatic inflows of fleeing immigrants, such as Lebanon, Jordan, and Libya.

An excess of persons entering the country is referred to as net immigration, while an excess of persons leaving the country as net emigration. The net migration rate indicates the contribution of migration to the overall level of population change. The net migration rate does not distinguish between economic migrants, refugees, and other types of migrants nor does it distinguish between lawful migrants and unlawful migrants.

In addition to fleeing for food and peace, the modern day we live in now compels wealthy inhabitants to seek countries where low taxes and safety of assets is the objective, also known as tax havens. In recent decades, the tax haven countries of Luxemburg, Cyprus, Cayman Islands, and the British Virgin Islands have all seen a growing inflow of immigrants, representing some of the largest net migration levels worldwide.

As the third most populous country, the United States has a current net migration rate that is similar to the United Kingdom and Israel, luring immigrants in search of jobs, safety, and political stability.

Japan’s stringent immigration policies in addition to a lack of Japanese leaving the country, has positioned it with a net zero migration rate, meaning that Japan essentially has no one coming in or leaving.

Source: CIA WorldFactbook

 
From the Editor

Recently, I became a member of the Ed Slott Elite IRA Advisory group. Ed Slott was named “The Best Source for IRA Advice” by the Wall EliteLogo2011Street Journal and called “America’s IRA Expert” by Mutual Funds Magazine. He is a nationally recognized IRA-distribution expert, a professional speaker, and the creator of several public television specials, including the most recent, Ed Slott’s Retirement Rescue!
Members of Ed Slott’s Elite IRA Advisor GroupSM train with Ed Slott and Company on a continuous basis, have completed requisite training, passed a background check, attend required workshops and complete mandatory exams. They are immediately notified of changes to the tax code and updates on retirement planning, so you can be sure your retirement dollars are safe from unnecessary taxes and fees.

To celebrate our new affiliation, we decided to offer something new – we call it The IRA TuneupTM. It might be good enough to do a 29 point IRA Wrenchservice check on your car but that’s not rigorous enough when it comes to your IRA. So, we introduced The IRA TuneupTM to evaluate 135 points that can affect the operation and continued tax advantages of your IRA. And, if you have special circumstances such as minor children, trusts as beneficiaries, or have been divorced, we have 50 additional “modules” we can use to make sure your IRA runs smoothly. Once we complete The IRA TuneupTM we will provide you a To Do list of things to will help ensure your IRA will provide the retirement security you’ve come to expect. Best of all, The IRA TuneupTM is free for existing asset management clients of Wayne Firebaugh, Inc., so just call us to set a time that you’d like to meet and begin.

If you would like to see some of the other new things we are doing, please check out our completely redesigned WayneFirebaugh.com website. There you will find an ever-increasing number of knowledge resources:

In addition to the knowledge resources, you’ll also find a variety of self-help aids including our Scenario Builders and questionnaires. Check out the Four Questions of Life survey. It’s my personal favorite. Worried about your IRA but not ready to commit to The IRA TuneupTM then test your knowledge about IRAs and retirement accounts with our Retirement Account Taxes & Traps survey.