May 2016

A Note from Dusty & Will – May 2016

Spring has arrived in most of the nation. As we enter this new season, we have recently seen a break from the significant volatility we experienced in the first two months of the year. However, although there is increased clarity on several issues that cast a cloud of uncertainty over financial markets in January and February, we cannot forget that heightened volatility is likely not gone for good.

We have just emerged from a historic first quarter for the market. After being down more than 10% at its lows, the S&P 500 bounced back in March and finished the quarter positive. The S&P 500 hasn’t erased a 10% quarterly loss to finish positive since the Great Depression. Experiencing market volatility like this is not easy; yet witnessing this kind of reversal reminds us of the importance of maintaining a long-term perspective.

So, what changed between January and February and today to help calm markets? The mid-winter market malaise was multifaceted and years in the making, but largely revolved around the Federal Reserve (Fed), China, oil, corporate profits, and the U.S. dollar. The market was concerned that the four 25 basis point (0.25%) rate hikes the Fed projected for 2016 would lead to a recession and exacerbate the imbalances emerging in the global economy. These imbalances stemmed from a series of missteps by Chinese policymakers, the oversupply of oil, weak corporate profits, and unprecedented strength in the U.S. dollar.

In the past couple of months, many of these issues have started to resolve. At its March policy meeting, the Fed changed its tune slightly from the December 2015 meeting and reduced its forecast for rate hikes this year from four to just two, citing concerns around global imbalances and economic growth. China, which said or did all the wrong things managing its currency, economy, and financial markets during the second half of 2015 and again in early 2016, has mostly turned that around recently. The weaker dollar, soothing words from China, and the rebound in oil prices helped to renew a slightly more positive corporate profit outlook and sparked an impressive market rebound.

After the market dips, reversals, and dramatic shifts in investor sentiment, what can we expect as we look ahead? In our view, the second quarter of 2016—and the rest of the year—may look a lot like the first quarter, as many of the areas of concern we faced—Fed rate hikes, oil prices, earnings declines—remain in the background.

Although we foresee a continuation of this heightened volatility throughout the rest of 2016, we continue to expect stocks to deliver mid-single-digit returns in 2016 as the U.S. economic expansion continues. And through this, we emphasize the importance of maintaining a long-term perspective and staying committed to a well-formulated investment plan.

From a planning perspective, we received tremendous feedback on one of our latest e-books we published last month titled “What You Need to Know About Social Security.” Click here to download your free copy.

As always, if you have questions, please contact our team at the office. More next month…
 
Seven States Have No State Income Tax

Macro Overview – May 2016

The prospect of a delayed tightening by the Fed, a weaker dollar, and a rebound in commodities helped stabilize equities in April. A falling U.S. dollar along with central banks in Europe and Asia trying to stem the rise of the euro and yen, is indicative of a currency war looming in the shadows. A weaker dollar makes U.S. products cheaper and the U.S. more competitive internationally, a concern to both European and Asian exporters.

Following years of debate and assistance, the IMF is considering letting its support for Greece go and cease participating in any further Greek bailouts. Such a possible move would force countries with dire fiscal constraints to reassess their financial policies.

The Labor Department reported that jobless claims for unemployment benefits fell to their lowest level since 1973, historically representative of a strong labor market. Employment data also revealed that there is a growing number of part-time workers rather than full-time workers encompassing the labor force. Various research reports have suggested that the implementation of the Affordable Care Act, whose major provisions were phased in by January 2014, encouraged employers to shift workers to more part-time positions in order to avoid having to cover them under the newly mandated health insurance requirements.

Records maintained and released by the IRS have identified a sharp rise in 1099 income filings as of 2014. 1099s are issued for any income generated over $600 during the tax year. Many economists believe that such dynamics is a validation of full-time employee positions being replaced by part-time independent contractors.

Sources: Labor Dept., IMF, IRS

State Income Tax Rates – Tax Planning

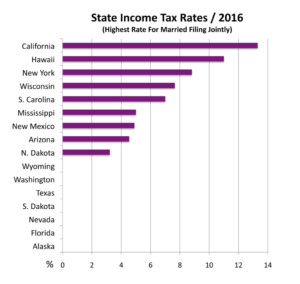
Individual state income taxes are a major source of revenue for states, accounting for nearly 35% of state tax collections nationwide. Forty-three states currently impose a state income tax, in addition to a Federal income tax, with only seven states imposing no state tax at all.

As state and municipal finances have experienced unforeseen fiscal duress, many states have levied and plan to levy higher tax rates on their residents. The non-partisan, non-profit Tax Foundation founded in 1937 provides unbiased research and data on taxes imposed throughout the United States.State-Tax-Rates-1024x970

Individual state income tax rates not only affect individuals but also affect companies. As companies grow and hire staff for new locations, state tax rates can deter some companies from hiring in higher rate states. Some companies can pay less since an employee’s take-home pay might be higher should there be no state income tax.

Retirees also consider state tax rates when planning for retirement and reducing expenses. It’s no surprise that the seven states that have no state income tax are also popular living destinations for retirees.

Source: Tax Foundation

 
Wealthy Folks Tend To Have Better Health

Rich Are Healthier

Researchers at the Urban Institute and Virginia Commonwealth University released a report in April examining the links between health, wealth, and income.

For years poverty has often been associated with poor health, while the wealthiest have been thought of having fewer illnesses.

To confirm these perceptions, the report analyzed various health problems for which the Centers for Disease Control (CDC) has recorded prevalence by family income. In every case, the wealthy are better off.

Speeding running shoe icons in four color variations with a trainer, sneaker or sports shoe with speed and motion trails, vector silhouette on white

How health and money are related is complex. For both rich and poor, the two attributes likely reinforce one another. “Health and income affect each other in both directions: not only does higher income facilitate better health, but poor health and disabilities can make it harder for someone to succeed in school or to secure and retain a high-paying job,” the Urban authors write.

Living in poverty often means less access to nutritious food or neighborhoods safe for outdoor exercise. Low-income people are more likely to smoke or be obese. White-collar jobs are less physically demanding, and people who have them can afford to take a day off for a doctor’s visit or to get a gym membership. They’re also probably not working the night shift, which is linked to cancer and other health problems.

Sources: Centers for Disease Control, Urban Institute & Virginia Commonwealth University

Fixed Income Update – Global Bond Markets

The ECB disclosed additional details in April about its bond buying program, stating that it will purchase government and corporate debt with maturities of 6 months to 30 years. Effectively, this strategy will provide cheap loans to global corporations operating in Europe, leading to a possible surge in debt issuance as companies take advantage of the ECB’s plan.

So far this year, corporate bonds have outperformed most government bond sectors, including Treasuries and mortgage-backed debt. High-yield corporate debt has seen the most appreciation of all corporate debt. Historically, high-yield bonds tend to correlate with equity markets due to factors as improving earnings and credit ratings.

Some analysts believe that the Fed’s stance on keeping rates stable for now and the ECB’s stimulus program in Europe of buying corporate debt has prompted domestic bond values to rise.

Sources: ECB, Bloomberg, Federal Reserve

 
The Federal Governement Took In Over $3.2 Trillion In 2015 Tax Payments

Japanese Yen Surges – Currency Update

The yen has risen over 10 percent against the dollar so far this year, with any additional gains intensifying speculation that the Bank of Japan would intervene sooner rather than later, as Japanese politicians have raised concerns about the yen’s run-up. Japan’s rising currency is making Japanese exports form cars to pens more expensive worldwide, stifling any stimulus efforts that had originally been enacted.

Japanese Prime Minister Shinzo Abe is scheduled to visit Italy and Germany in May where it is believed he will try to set the stage for a possible intervention in currency markets as Japan prepares to host a G7 meeting later in the month.

Some currency analysts expect a possible resurgence in a currency war should the yen and other major currencies continue to rally versus the U.S. dollar.

Competitive devaluation of a nation’s currency, also known as a currency war, is a condition in international affairs where countries compete against each other to achieve a relatively low exchange rate for their own currency.

The benefits of a devaluing currency for a nation’s economy include an increase in exports, which may result in additional manufacturing and employment. A significant hindrance of a devaluing currency would be imports becoming more expensive, thus indirectly causing inflationary pressures within an economy.

Source: Federal Reserve Bank of New York

Where Our Tax Dollars Go To – Fiscal Overview

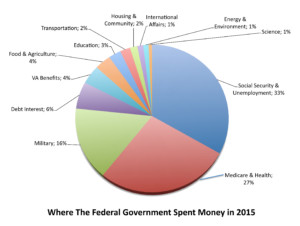
For fiscal 2015, the federal government took in over $3.2 trillion in tax payments, a record year compared to previous fiscal years. The federal budget for fiscal year 2015 ran from October 1, 2014, to September 30, 2015. The total figure amounts to approximately $21,833 for every person in the United States.

Taxpayers often wonder, where does all their tax money go. The Office of Management & Budget breaks down where tax payments go each year, allowing Americans to see what they’re getting.

Source: Office of Management & BudgetFederal Spending 2015