May 2017
Market Update
(all values as of 04.30.2024)

Stock Indices:

Dow Jones 37,815
S&P 500 5,035
Nasdaq 15,657

Bond Sector Yields:

2 Yr Treasury 5.04%
10 Yr Treasury 4.69%
10 Yr Municipal 2.80%
High Yield 7.99%

YTD Market Returns:

Dow Jones 0.34%
S&P 500 5.57%
Nasdaq 4.31%
MSCI-EAFE 1.98%
MSCI-Europe 2.05%
MSCI-Pacific 1.82%
MSCI-Emg Mkt 2.17%
 
US Agg Bond 0.50%
US Corp Bond 0.56%
US Gov’t Bond 0.48%

Commodity Prices:

Gold 2,297
Silver 26.58
Oil (WTI) 81.13

Currencies:

Dollar / Euro 1.07
Dollar / Pound 1.25
Yen / Dollar 156.66
Canadian /Dollar 0.79
 

Macro Overview – May 2017

Fiscal policy has taken center stage as President Trump’s tax proposals will begin a drawn out process for legislative approval. Individuals, small businesses, and large corporations are expected to benefit from the various proposals.

Geopolitical risks weighed on global financial markets during early April as investors sought fixed income. Regardless, global equity markets achieved higher levels as confidence returned.

Mexico and Canada breathed a sigh of relief as President Trump suggested that perhaps the U.S. could renegotiate NAFTA rather than abandoning it. Trade has been a leading agenda item for the President as suggestions to impose tariffs on imports has raised anger among U.S. trading partners.

Contrary to popular belief, the U.S. dollar has actually fallen after recent Fed rate hikes. Some economists see this as a signal that rates may actually stay close to where they are and not rise much until stronger economic numbers are in.

The Fed gave no indication of slowing tightening plans this year, even though U.S. economic growth slowed to 0.7% in the first quarter of 2017, the slowest quarter in three years. Consumer sentiment, though, remained at elevated levels in April as the University of Michigan’s Consumer Sentiment Index rose again. It is up 9% from April 2016 to April 2017.

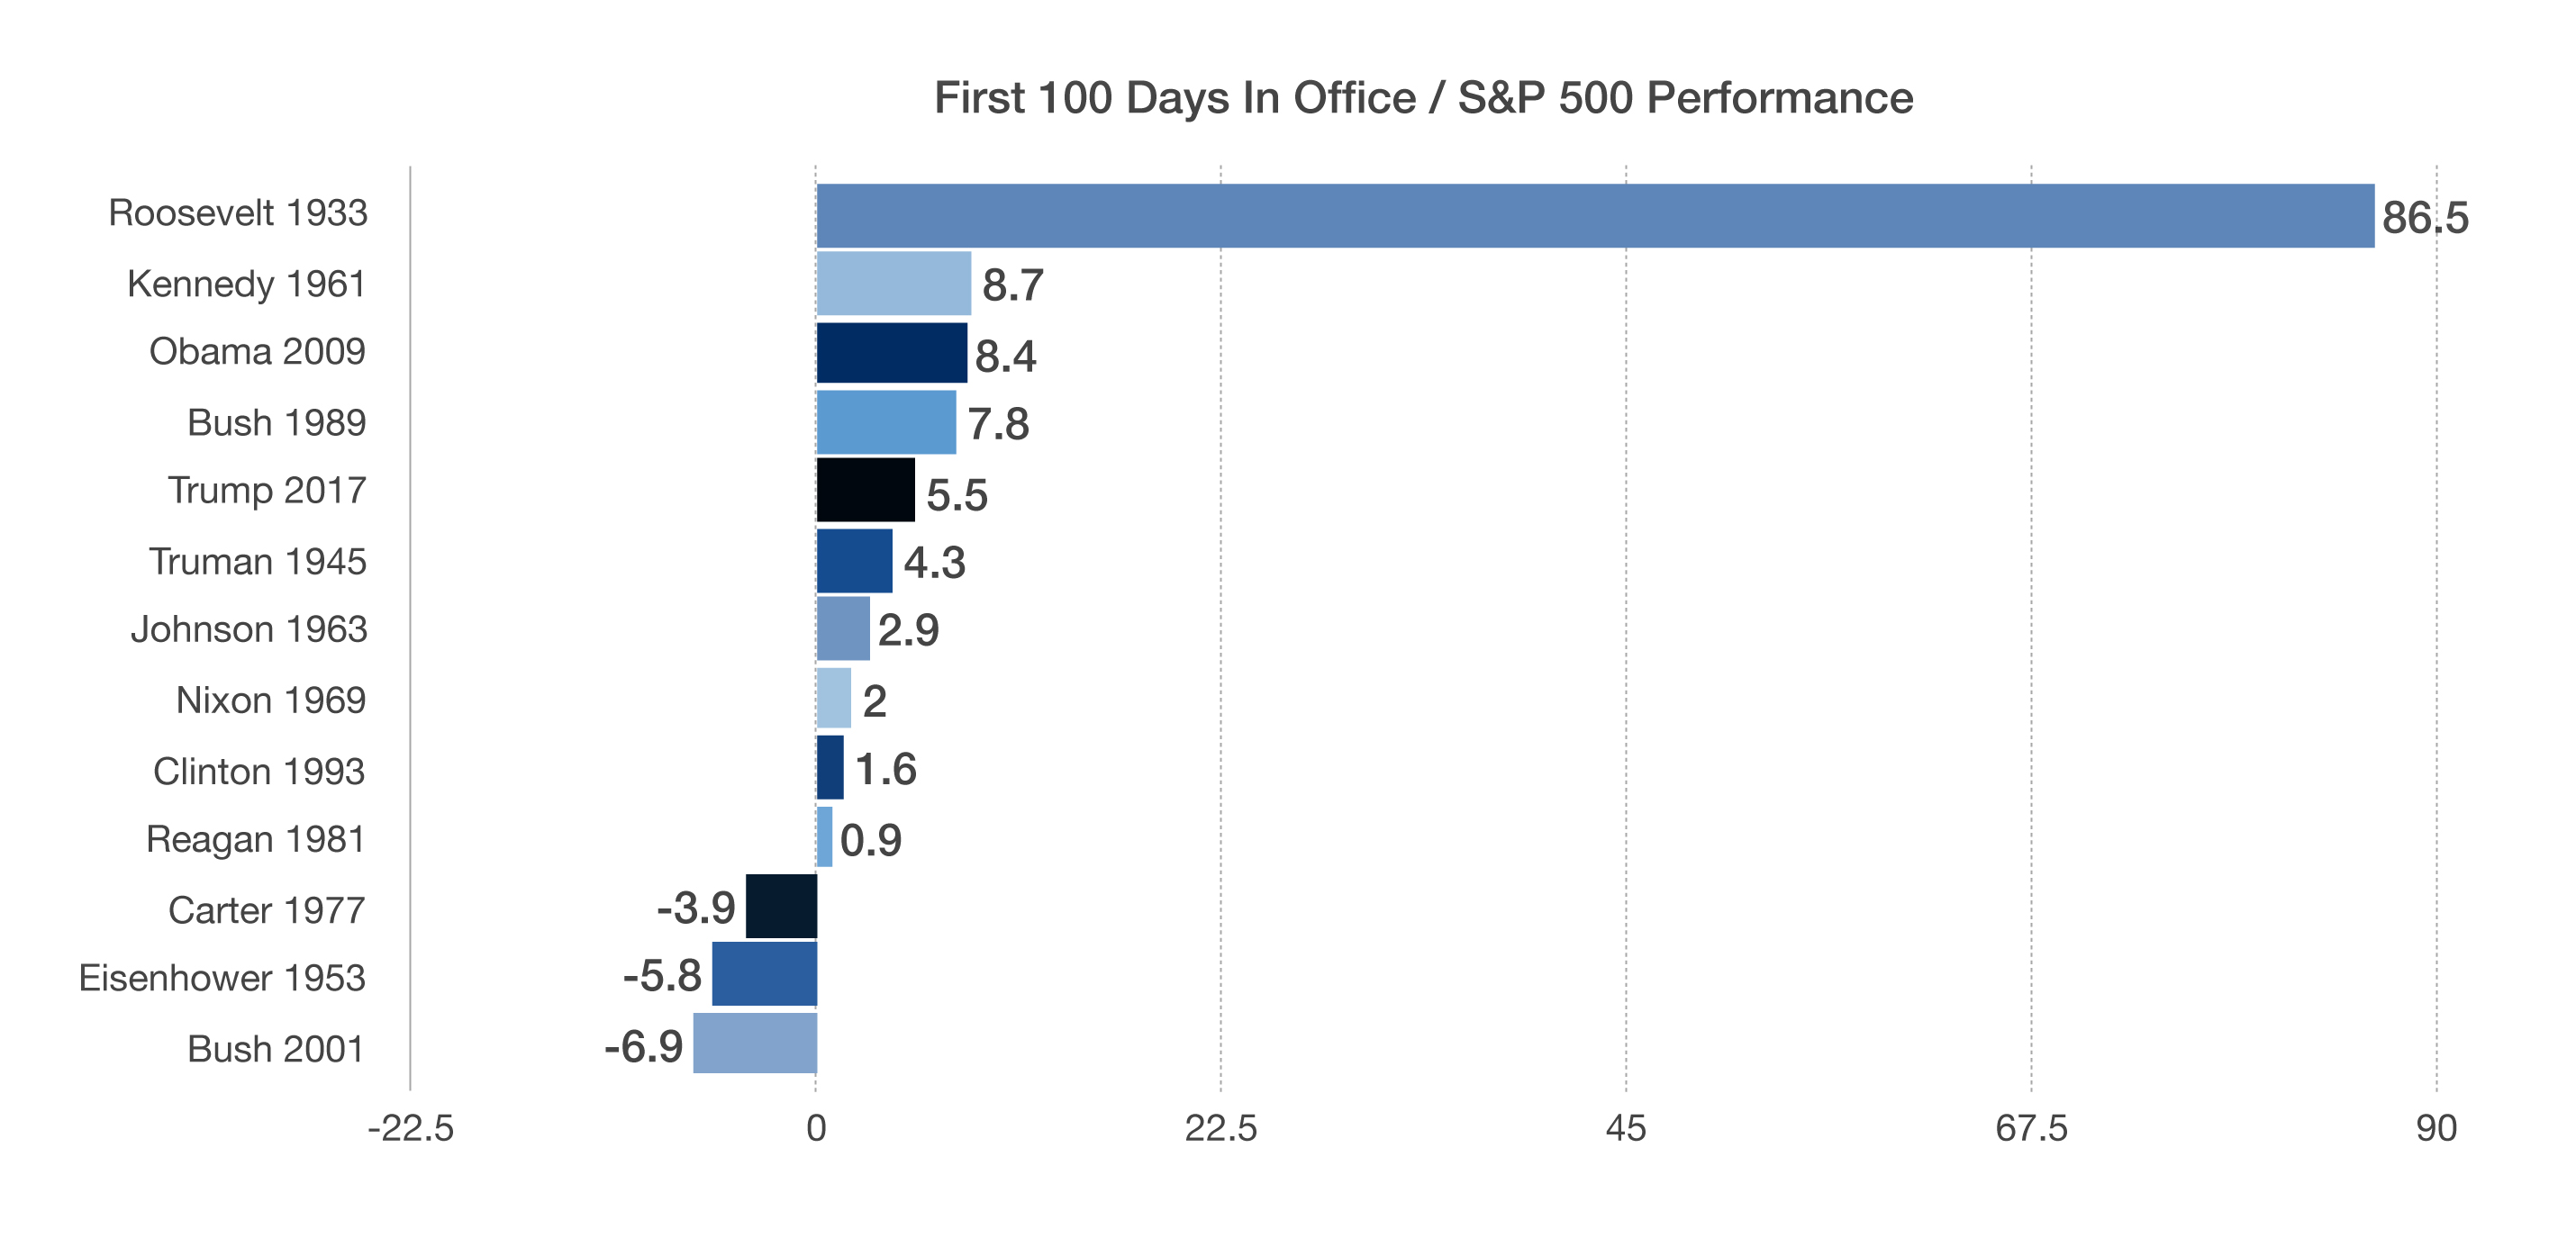
The S&P 500 Index finished up 5.5% during President Trump’s first 100 days in office. Timing has become a must when achieving an attractive first 100 days. Roosevelt began his term in the midst of the depression with a rebounding market from collapse in 1933, while Bush saw his first 100 days during the middle of the dot-com bust. (Sources: Eurostat, S&P, Bloomberg, Fed, Univ. of Michigan)

 
Reasons to be Bullish

Reasons to be Bullish

We wish we had a dollar for every time we’ve heard that the bull market in equities is only due to loose money.  We have consistently disagreed, arguing that although the Federal Reserve is loose, the bull market is primarily a function of the rebound in profits after the disaster in 2008-09.

The government’s economy-wide measure of profits – the one’s it releases with the GDP reports – was $2.15 trillion at an annual rate in the fourth quarter of 2016, up 9.3% from the prior year and very close to a record high.  In turn, given the strong statistical link between the S&P measure of profits and the government’s measure, as well as the robust gains in S&P profits reported so far for the first quarter, we wouldn’t be surprised at all if the economy-wide measure of profits is hitting a record high in Q1.

The gains in profits are a testament to the enduring ability of entrepreneurs in the face of what has been a bipartisan movement toward more government involvement in the economy dating back to the latter couple of years of the Clinton Administration.  These include more government spending, new entitlements, and much heavier regulation.

Now it looks like government policy stands a solid chance of becoming a tailwind to growth rather than a headwind, with less regulation on the energy sector paired with respectable prospects for major reforms of Medicaid and Obamacare as well as supply-side tax cuts.

These changes will sustain the growth of corporate profits even in the face of an acceleration of wage gains as the unemployment rate declines.  Notice the lack of a negative equity reaction to Wednesday’s Fed statement that sent a clear signal a June rate hike was on the way.  Supply-side policies are the way policymakers can break through the Keynesian mindset that labor and capital have to battle it out for the upper hand and that a “tight” labor market must mean weakening profits.

Meanwhile, it looks like France, and, in turn, the EU can continue on a bullish path. Emmanuel Macron, France’s incoming president, has proposed curbs on France’s wealth tax, wants to decentralize corporate bargaining with unions, plans to cut the corporate tax rate to 25% from 33%, and wants to reduce government jobs (through attrition).

The European Union is in dire need of economic reform, to move toward free-market capitalism rather than (democratic) socialism.  But the best way to do this is for major countries in the EU, like France, to reform their economies themselves.

If some countries move toward freer markets, other countries will have to follow or capital will move toward more freedom, leaving the others behind.  Now it looks like one of those countries is on its way.

Brian S. Wesbury – Chief Economist
Robert Stein, CFA – Deputy Chief Economist


Prepare for Q2 GDP Surge

Prepare for Q2 GDP Surge

Economic data is volatile.  Weather, seasonal adjustments, calendar flukes, and measurement errors all affect the data.  Nonetheless, those with a political axe to grind, or an economic forecast of recession or boom, will grab one piece of data and act as if they have discovered the Holy Grail.

This happened with Q1 real GDP, which grew just 0.7%.  Pessimists went into a tizzy, but they shouldn’t have.  We think the Plow Horse economy, with all its features, both good and bad, is still fully intact.

Despite the soft Q1 report, real GDP was up 1.9% from a year ago, very close to the trend.  The pace of inventory accumulation fell, pulling down the number.  This is unlikely to continue.  “Core” GDP, which excludes inventories, government spending, and trade with the rest of the world – none of which can be counted on for sustainable growth – grew at a 2.2% pace in Q1 and is up 2.8% from a year ago.

In fact, there were some key signs of a pick-up in growth ahead.  Business fixed investment soared in the first quarter, growing at a 9.4% annual rate, the fastest pace for any quarter since 2013.  And corporate profits are accelerating.  With roughly 60% of the S&P 500 having reported for Q1 so far, earnings are up about 15.6% from a year ago.

Meanwhile, home building grew at a 13.7% annual rate in Q1, the fastest pace for any quarter since 2015.  Although the recovery in home building is about seven years old, we expect gains in housing to continue for at least the next couple for years as builders battle pent-up demand from population growth, scrappage, and years of under-building.

Yes, consumer spending grew at only a 0.3% annual rate in Q1, but a few extenuating circumstances suggest a hearty rebound in Q2.  First, autos sales were unusually weak in Q1, in part a reflection of an unusually late March snowstorm in the East. (We get April auto sales data tomorrow, and we expect a pickup in pace.)  Second, unusually warm weather in January and February suppressed utility (heating) output.  Third, that same warm weather may have suppressed winter clothing sales.

As these patterns reverse, growth will bounce.  Although it’s still early, we are looking for real GDP to grow at a 3.5% annual rate in Q2.  That would put the first half of the year at a growth rate of 2.1%, right at the Plow Horse trend.

Even more important, the Trump Administration looks serious about supply-side tax cuts that will boost the economy’s long-term growth potential.  If and when these policies get enacted, that’s when GDP will finally accelerate.

Brian S. Wesbury – Chief Economist
Robert Stein, CFA – Deputy Chief Economist


Credit Card Debt Grew 6.2% In The Past Year......To Over One Trillion Dollars

Consumer Credit Card Debt Hits $1 Trillion – Consumer Finance

As consumer confidence has risen over the past couple of years, so has the appeal to hold debt. Federal Reserve data shows that U.S. consumers now have over $1 trillion on credit cards alone, up 6.2% from a year ago, and is currently the highest amount of consumer credit card debt since January 2009.

The recent data makes credit card debt the third largest consumer lending category in the industry following auto loans and student loans.

Two variables that economists look at closely are employment and interest rates, which directly affect the ability for consumers to borrow. Economists believe that loosening underwriting standards in various loan categories along with a strengthening employment market could very well offset any interest rate increases.

The credit card business remains among the most profitable in banking as banks can charge much higher interest rates than other loan types, with average credit card rates between 12% and 14%.

Yet, as credit card debt levels have risen, so have reserves for losses as banks anticipate delinquencies to rise. Financially savvy consumers that pay their balances down each month avoid hefty interest charges, but those that don’t, known as “revolvers,” pay average rates of between 12% to 14% and significantly more if they are considered higher risk. (Sources: Federal Reserve)

The Tax Benefits Of Homeownership May Change – Tax Planning

As President Trump’s tax proposals are being unveiled, homeowners are carefully following the possible effects on home ownership. The current tax code provides a number of benefits for taxpayers that own their homes rather than rent. Homeowners have the ability to deduct both mortgage interest and property tax payments from their federal income tax. The possibility of eliminating the deduction of property tax payments may alter the benefits of home ownership for some.

The tax code also allows for the exclusion of capital gains on home sales. Currently the exclusion from taxable income on the appreciation of homes when sold is $250,000 for individuals and $500,000 for joint filers. In order for the exclusion to be effective, the homeowner must live in the home as their principal residence for two of the preceding five years. In addition, homeowners may not have claimed the capital gains exclusion for the sale of another home during the previous two years.

The benefit of property tax and mortgage interest deductions as well as capital gains exclusions tend to benefit higher income earners more. The deductions and exclusions available to all homeowners are essentially worth more to taxpayers in the higher income tax brackets than those in lower income tax brackets. (Sources: Tax Policy Center, IRS)