Ocean Park Capital Management

2503 Main Street

Santa Monica, CA 90405

Main: 310.392.7300

Daily Performance Line:  310.281.8577

April 2017
Market Update
(all values as of 04.30.2024)

Stock Indices:

Dow Jones 37,815
S&P 500 5,035
Nasdaq 15,657

Bond Sector Yields:

2 Yr Treasury 5.04%
10 Yr Treasury 4.69%
10 Yr Municipal 2.80%
High Yield 7.99%

YTD Market Returns:

Dow Jones 0.34%
S&P 500 5.57%
Nasdaq 4.31%
MSCI-EAFE 1.98%
MSCI-Europe 2.05%
MSCI-Pacific 1.82%
MSCI-Emg Mkt 2.17%
 
US Agg Bond 0.50%
US Corp Bond 0.56%
US Gov’t Bond 0.48%

Commodity Prices:

Gold 2,297
Silver 26.58
Oil (WTI) 81.13

Currencies:

Dollar / Euro 1.07
Dollar / Pound 1.25
Yen / Dollar 156.66
Canadian /Dollar 0.79
 

Fund Overview 

Equities rose modestly in April, as did the Ocean Park funds.  Portfolio holdings in health care and consumer discretionary stocks provided substantial gains, but semiconductor stocks, which had trended higher since the November election, experienced a mild correction.  As a result, we trailed the major indices slightly for the month.  However, the funds remain solidly ahead of most of the major indices for the year to date.

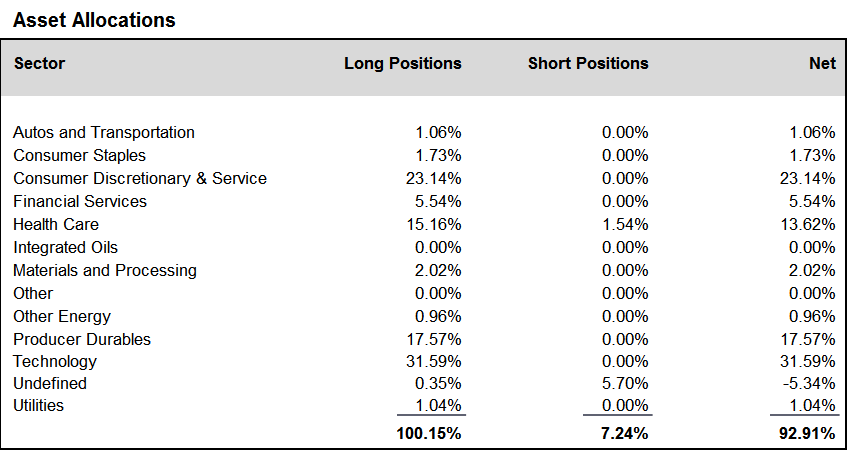
During the month of April, we increased positions in the consumer discretionary and service and producer durables sectors, and reduced positions in the technology, financial services, and health care sectors.  We finished the month at about 93% net long, up from about 90% at the end of March.

A schedule showing the performance of the Investors Fund is included below, along with our Asset Allocation Chart. Daily updates on our activity are available on our Results Line, at
310-281-8577, and current information is also maintained on our website at www.oceanparkcapital.com. To gain access to the site enter password opcap.


*These results are pro forma. Actual results for most investors will vary. See additional disclosures on page 4.
Past performance does not guarantee future results.

 
Equity Over View - April 2017

Equity Overview 

Notwithstanding the decline in semiconductor stocks, the tech-heavy NASDAQ reached new highs in April, crossing the 6,000 threshold for the first time. Other major indices remained below their March peaks.

Consistent with the recent trend, growth stocks outpaced value stocks, and earnings surprises continued to drive superior stock performance. Most sectors in the S&P 500 recorded gains, except for energy stocks which fell with the price of oil.

First quarter earnings reported in April provided reason for optimism. With 58% of S&P 500 companies reporting, the blended growth rate for Q1 earnings was 12.5%, well above the 9% rate projected at the beginning of the quarter and the best result in five years. In addition, 77% of companies reporting beat consensus earnings expectations, compared with the 70% one-year average. And perhaps most encouraging, 68% of companies reporting beat consensus revenue estimates, compared with the 53% one-year average. In recent years, earnings beats have often been driven by cost-cutting and automation rather than by increased sales, so the significant revenue gains in the first quarter are particularly noteworthy.


Macro Overview - April 2017

Macro Overview 

Economic data reported in April were mixed.  On the positive side, unemployment remained at historically low levels, manufacturing expanded, and consumer confidence remained high.  However, the Commerce Department reported that its initial estimate of annualized first quarter growth was only 0.7%, anemic by any standard.  The disappointing result reflected an increase of only 0.3% in consumer spending, which comprises about 2/3 of economic activity in the U.S.  This was the slowest increase in consumer spending in 7 years, but economists generally treated it as an anomaly.  They attributed it to a mild winter (diminishing spending on heat and utilities) and delays in tax refunds resulting from government efforts to combat fraud.

The domestic economic agenda continued in gridlock mode, with no meaningful progress on tax reform or infrastructure investment.  The administration did release a single page of bullet points on tax reform, but it contained no cost estimates and was widely derided as insubstantial.  Similarly, no details emerged about the president’s campaign promises for a $1-trillion infrastructure plan.

International news focused on the U.S. airstrikes in Syria and deepening tensions with North Korea, but neither of these had meaningful impact on the markets.  More constructively, prospects for the health of the European Union advanced significantly with the victory of Emmanuel Macron in the first round of the French presidential election.  Macron is an ardent internationalist, as compared with the ultra nationalist Marine Le Pen, his right-wing opponent.


Additional Disclosures - April 2017

Additional Disclosures

Performance data for OPI reflect the reinvestment of dividends and other earnings on the fund’s assets.  Performance data for the major indices reflect only changes in the value of those indices, and would be higher if dividends were included. However, the index data do not reflect fees that would be paid to index fund managers and transaction costs that would be incurred when their component stocks are bought or sold, while OPI’s data do reflect quarterly fees and expenses incurred by the fund.  The information provided is believed to be reliable, but its accuracy or completeness is not warranted. This material is not intended as an offer or solicitation for the purchase or sale of any stock, bond, mutual fund, or any other financial instrument. The views and strategies discussed herein may not be appropriate and/or suitable for all investors. This material is meant solely for informational purposes, and is not intended to suffice as any type of accounting, legal, tax, or estate planning advice. Any and all forecasts mentioned are for illustrative purposes only and should not be interpreted as investment recommendations.