April 2018 Market Update
Market Update
(all values as of 05.30.2025)

Stock Indices:

Dow Jones 42,270
S&P 500 5,911
Nasdaq 19,113

Bond Sector Yields:

2 Yr Treasury 3.89%
10 Yr Treasury 4.41%
10 Yr Municipal 3.31%
High Yield 7.26%

YTD Market Returns:

Dow Jones -0.64%
S&P 500 0.51%
Nasdaq -1.02%
MSCI-EAFE 17.30%
MSCI-Europe 21.20%
MSCI-Pacific 10.50%
MSCI-Emg Mkt 8.90%
 
US Agg Bond 2.45%
US Corp Bond 2.26%
US Gov’t Bond 2.44%

Commodity Prices:

Gold 3,313
Silver 33.07
Oil (WTI) 60.79

Currencies:

Dollar / Euro 1.13
Dollar / Pound 1.34
Yen / Dollar 144.85
Canadian /Dollar 0.72
 

Macro Overview

Markets continued on a volatile course in April following announcements regarding tariffs, rising rates, and geopolitical tensions, yet some economists and analysts expect that a tax cut driven rebound is possible.

The 10-year Treasury bond yield reached 3% for the first time since January 2, 2014, elevating inflationary fears and the onslaught of rising loan costs. The 3% mark represents a psychological hurdle that influences the dynamics of various fixed income sectors.

The market is concerned that the Fed and other central banks may need to take additional actions in order to alleviate a rapid rise in prices and wages should it materialize. Federal Reserve members voted not to raise rates during their May 1-2 meeting, yet are still on track to raise rates in June and perhaps twice more before year end.

Stocks have been trading in what traders call a trading range, meaning that prices move down and up but stay within certain levels. The release of earnings has become a key determinant of prices as the market looks for fundamental validations for pricing stocks. Company earnings in certain sectors have increased the most since 2010 while the environment for selecting stocks has become tactical and very selective, shying some investors away from the major indices.

The U.S. Treasury issued $488 billion in government bonds for the first quarter of 2018, the most since 2008. The issuance is in anticipation of a drop in tax revenue from the recent tax cuts. Some economists believe that the benefits of the tax plan have not been realized yet as it may take months for visible benefits to appear.

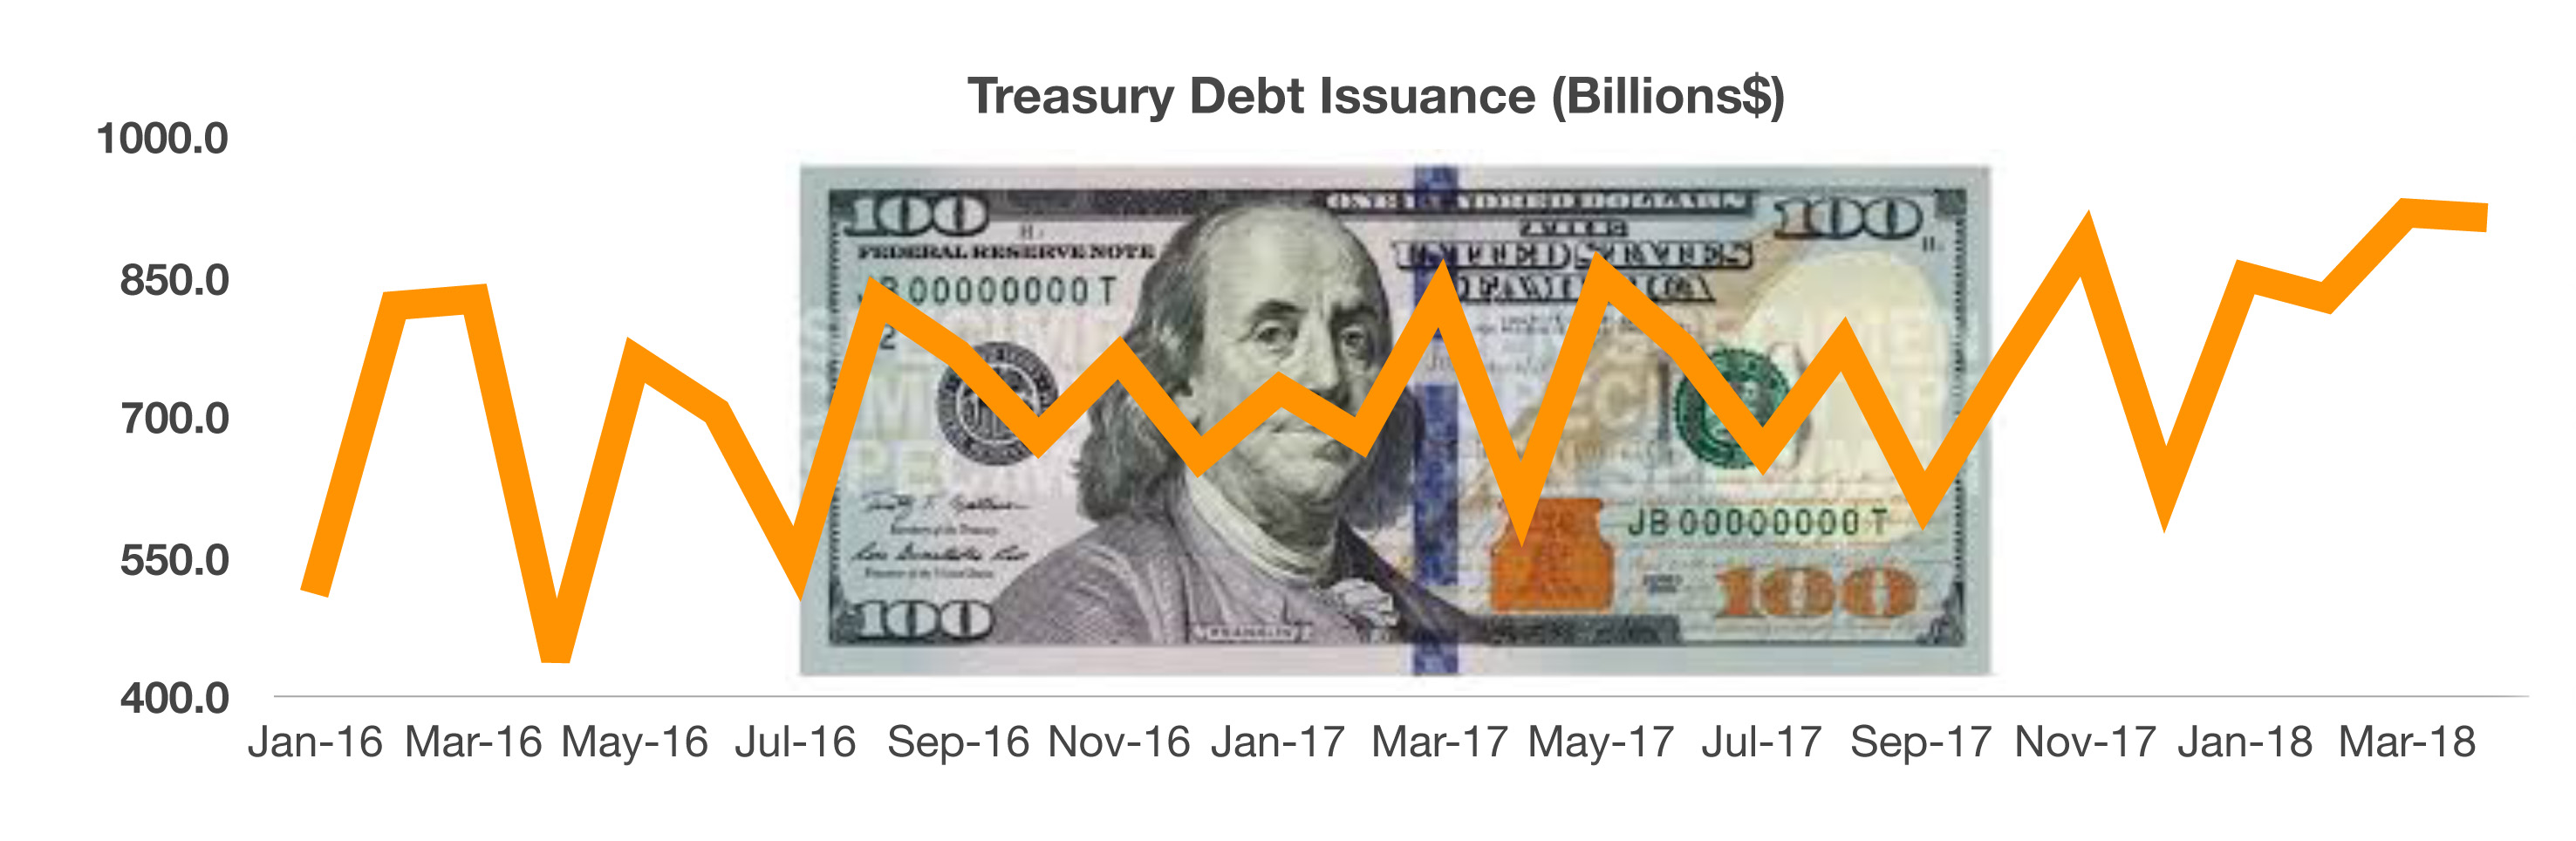
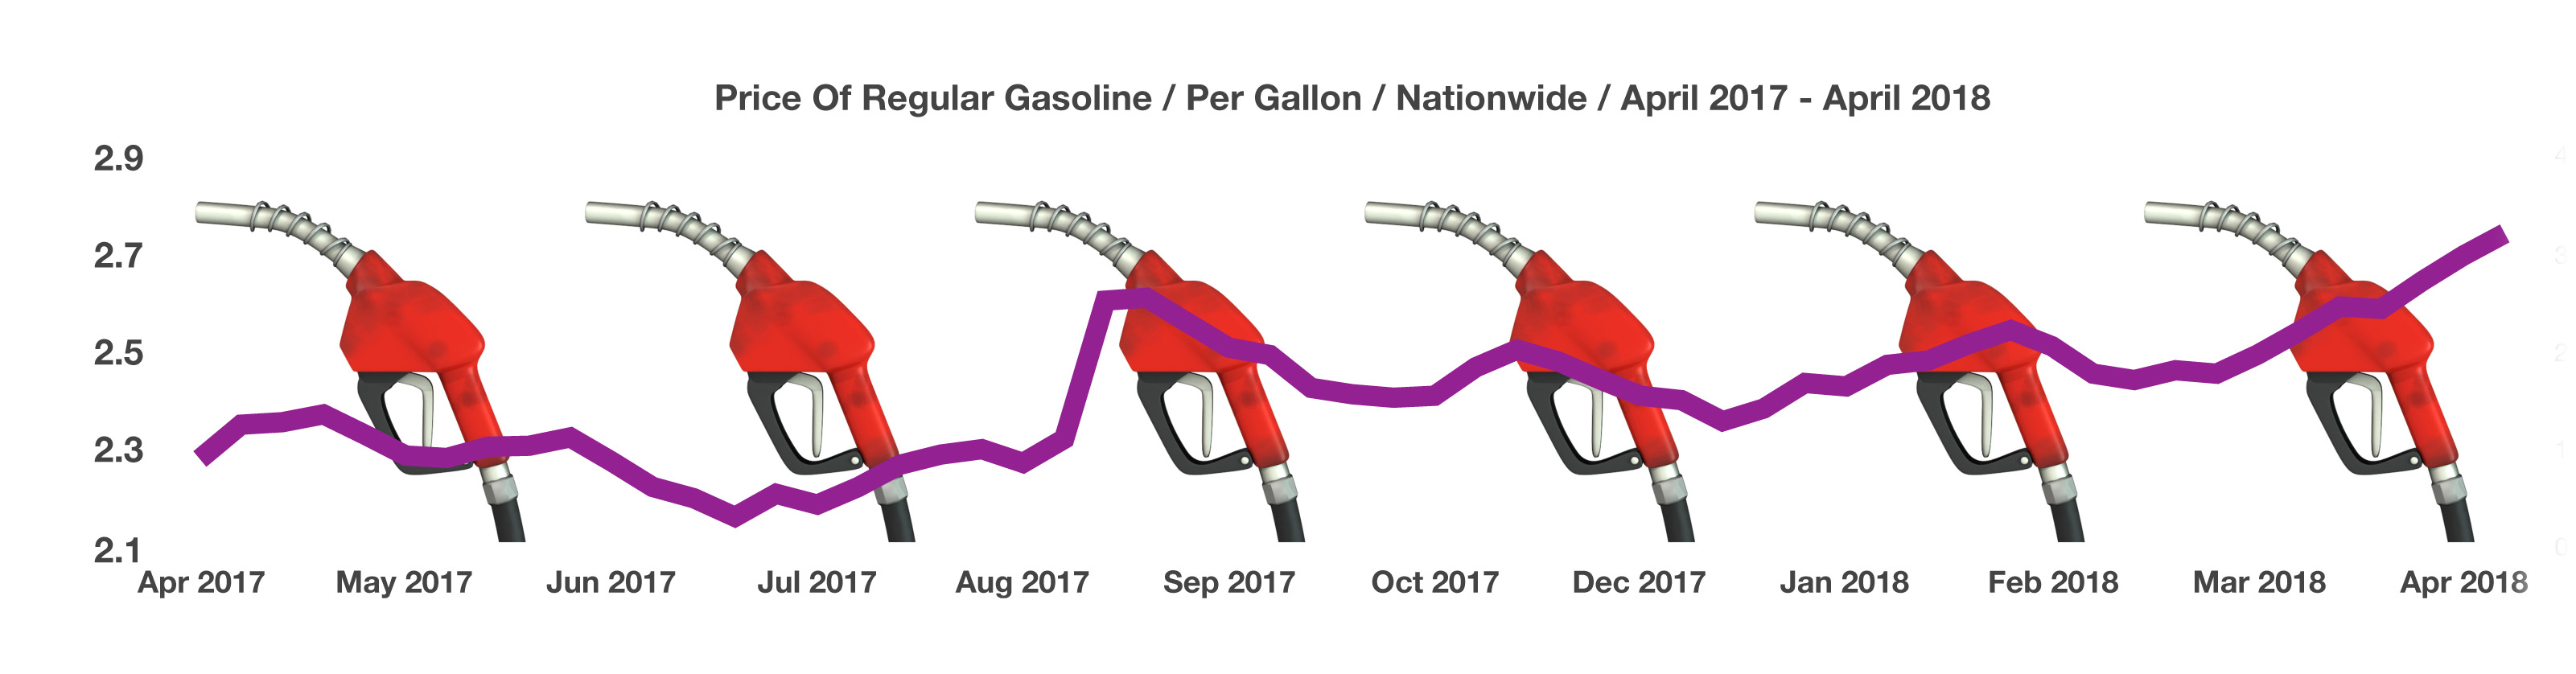
Oil prices reached their highest levels in more than three years as geopolitical tensions drove uncertainty. Shrinking supplies and the approaching summer driving season are expected to heighten gasoline prices across the country.

The most recent data from the Department of Commerce revealed that GDP grew at an annual rate of 2.3% for the first quarter of 2018, a deceleration from the 3% growth that occurred in the final 9 months of 2017. Encouraging data released by the University of Michigan reveals that consumer sentiment rose in April driven by favorable views on personal finances and incomes.      (Sources: Dept. of Commerce, Fed, U.S. Treasury, BLS)

 
10-year Treasury bond yield reached 3%, a psychological level for the bond market

Stocks Enter A Trading Range – Equity Markets Update

Markets rebounded in April as fundamental factors drove prices higher. Among the factors influencing the markets were global expansion, positive domestic activity, increasing earnings, and capital spending increases.

Stocks traded sideways, with the S&P 500 temporarily trading below its 200-day moving average in early April and then bouncing back toward the middle of its recent trading range. This technical narrative is essentially positive, meaning that the market bounced from a low upward towards possible new highs.

Market watchers have termed the drop in equity prices in early February as a “shock drop”, resembling reactions driven by human behavioral activity. Since the initial down turn in February, there have been several intermediate-term downturns, alluding to fundamental weaknesses that have not materialized.

Correlations among various equity sectors has diminished as specific industries and companies are sought after rather than the broad indices. Analysts refer to this as a “stock picker’s market”.

Analysts raised their 2018 forecasts for revenue growth for S&P 500 companies to 7.2%, up from 5.4% in 2017. Financial and industrial stocks historically have seen earnings improvements during rising inflation and rising rate environments.          (Sources: S&P, Bloomberg, Reuters)

10 Year Treasury Bond Hits 3% – Fixed Income Overview

The 10-year Treasury bond yield reached 3%, a psychological level for the bond market. Breaching the 3% mark is expected to pose lending constraints for businesses and consumers as loan costs rise.

The drop in bond prices has placed bonds as a more attractive option for income seeking investors since bonds are favored during periods of market volatility due to traditionally experiencing less volatility than stocks.

Short-term rates and long-term rates are coming closer together, known as a flattening yield curve. Short-term rates are rising faster, which are highly influenced by the Federal Reserve’s rate increases. Long-term rates are established by the market as well as the expectation of economic growth and inflation. 

The issuance of corporate debt by companies is increasing before rising rates heighten the cost to borrow above current levels. A demand for fixed income globally continues to fuel the issuance of new bond issues as well. Consumers and homeowners with loans tied to rising short-term rates, such as the Libor and Fed Funds rates, are expected to feel the effects of rising rates the most.     (Sources: Bloomberg, U.S. Treasury, Federal Reserve)

 
the personal savings rate increased to 3.1% of disposable income as of March

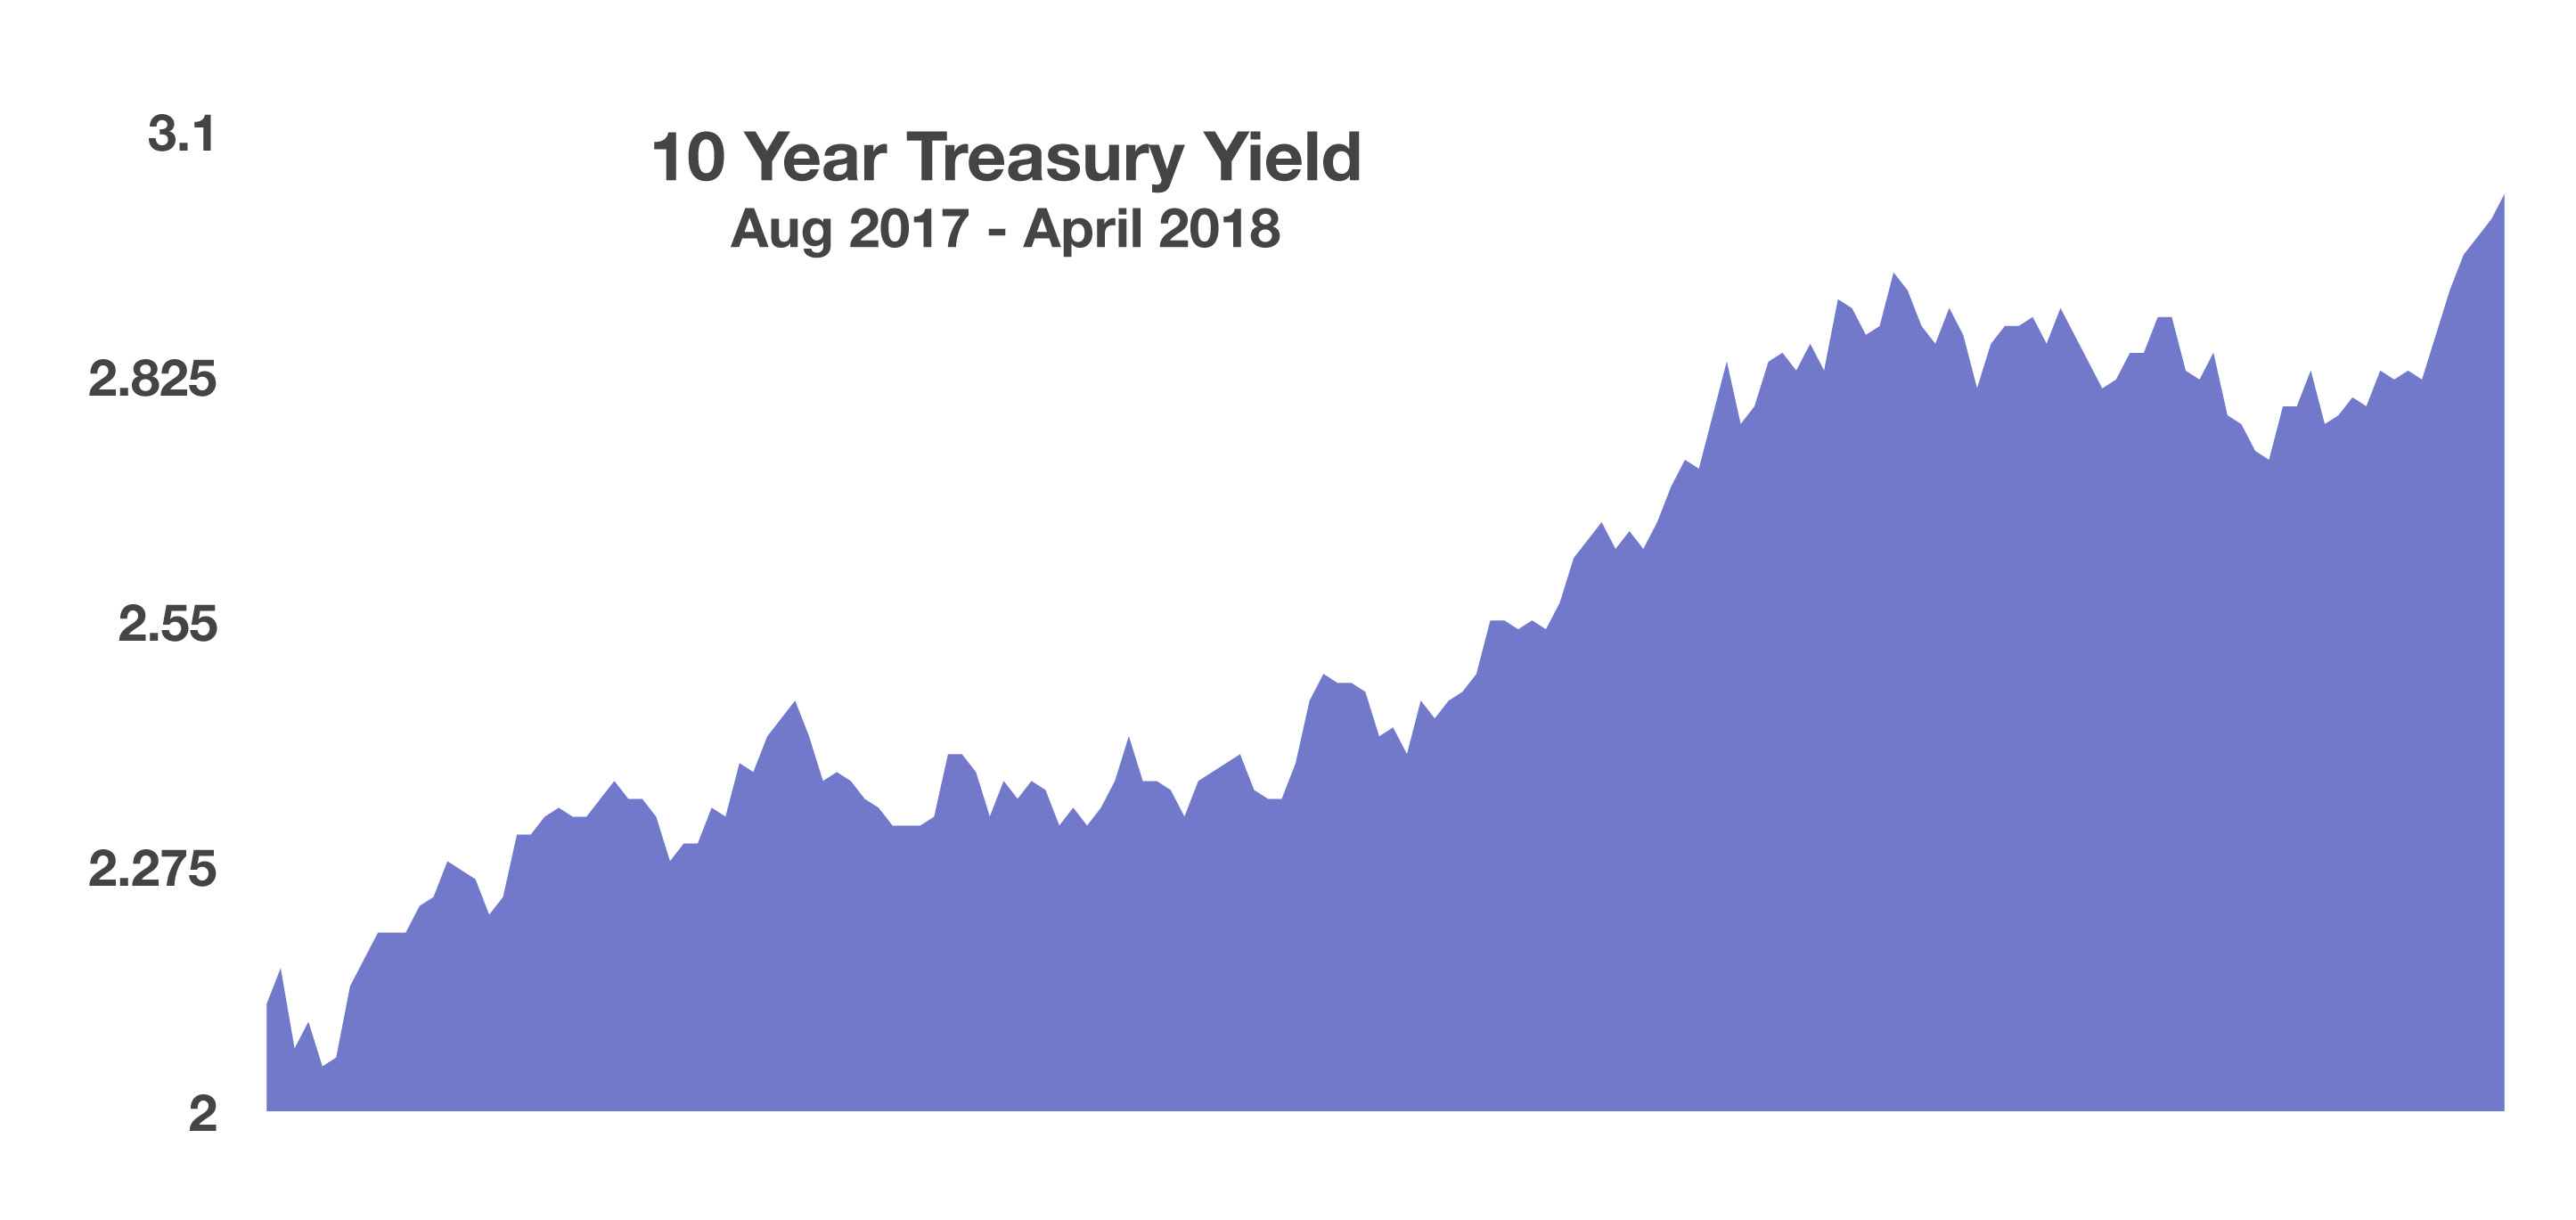
Cash is king (again)…

Money-market funds, often used as a cash equivalent in some investors’ portfolios, fell out of favor after the 2008-09 financial crisis, with yields dropping to 0.1 percent in many cases. But the Federal Reserve’s interest-rate hikes, which began in December 2015, have changed the equation for the better.  The Crane 100 Money Fund Index, which measures the average yield of the 100 largest taxable funds, registered a yield of 1.55 percent as of April 30.

Prior to the financial crisis, in 2007, many money-market funds yielded 5 percent or more. But the crash of the banking industry led the Fed to push short-term interest rates to almost zero.  Now things are different. The Fed has raised rates six times over the last two-plus years, most recently in March, leaving the federal funds rate target at 1.5 to 1.75 percent. And Fed officials indicate another two to three rate increases are likely this year which would push money-market fund yields to 2 percent by the end of the year.

It is important to understand that even though money-market funds are historically safe and new regulations should make them even safer, there is still some risk; they don’t have iron-clad guarantees from FDIC insurance like savings accounts do.  During the financial crisis in 2008 some funds broke the buck—reduced its share price below $1—because of its exposure to Lehman Brothers debt securities.

The FDIC insurance may be protection well worth obtaining, even though it sometimes means giving up yield, there’s not much sacrifice in opting for an online savings account.  Since several bank deposits and saving accounts yield 1.75 percent or more, currently it is hard to make a case for money-market funds over FDIC-insured accounts.  (Source:  wealthmanagement.com)

Personal Savings Rate Indicates Consumer Sentiment – Consumer Behavior

Federal Reserve data show that the average consumer checking account balance, a measure of consumer personal savings, has increased in 23 of the past 30 quarters. Recent data from December 2017 through March 2018, illustrates an increase in the savings rate to 3.1% of disposable personal income as of March 2018. Economists view this increase as a possible pause in economic growth until consumers feel more confident about spending.

Historically, Americans tend to save more as economic times become more difficult, and tend to spend during prosperous periods. Past slow downs such as in the mid 1970s and the early 1980s saw an increase in the savings rate, a barometer of consumer sentiment. The expansion during the mid-to-late 1990s saw a gradual drop in savings, as consumers spent more confidently as their incomes rose.     (Sources: https://fred.stlouisfed.org/series/PSAVERT)


over 1 million trucking companies cover over 164,000 U.S. highway miles

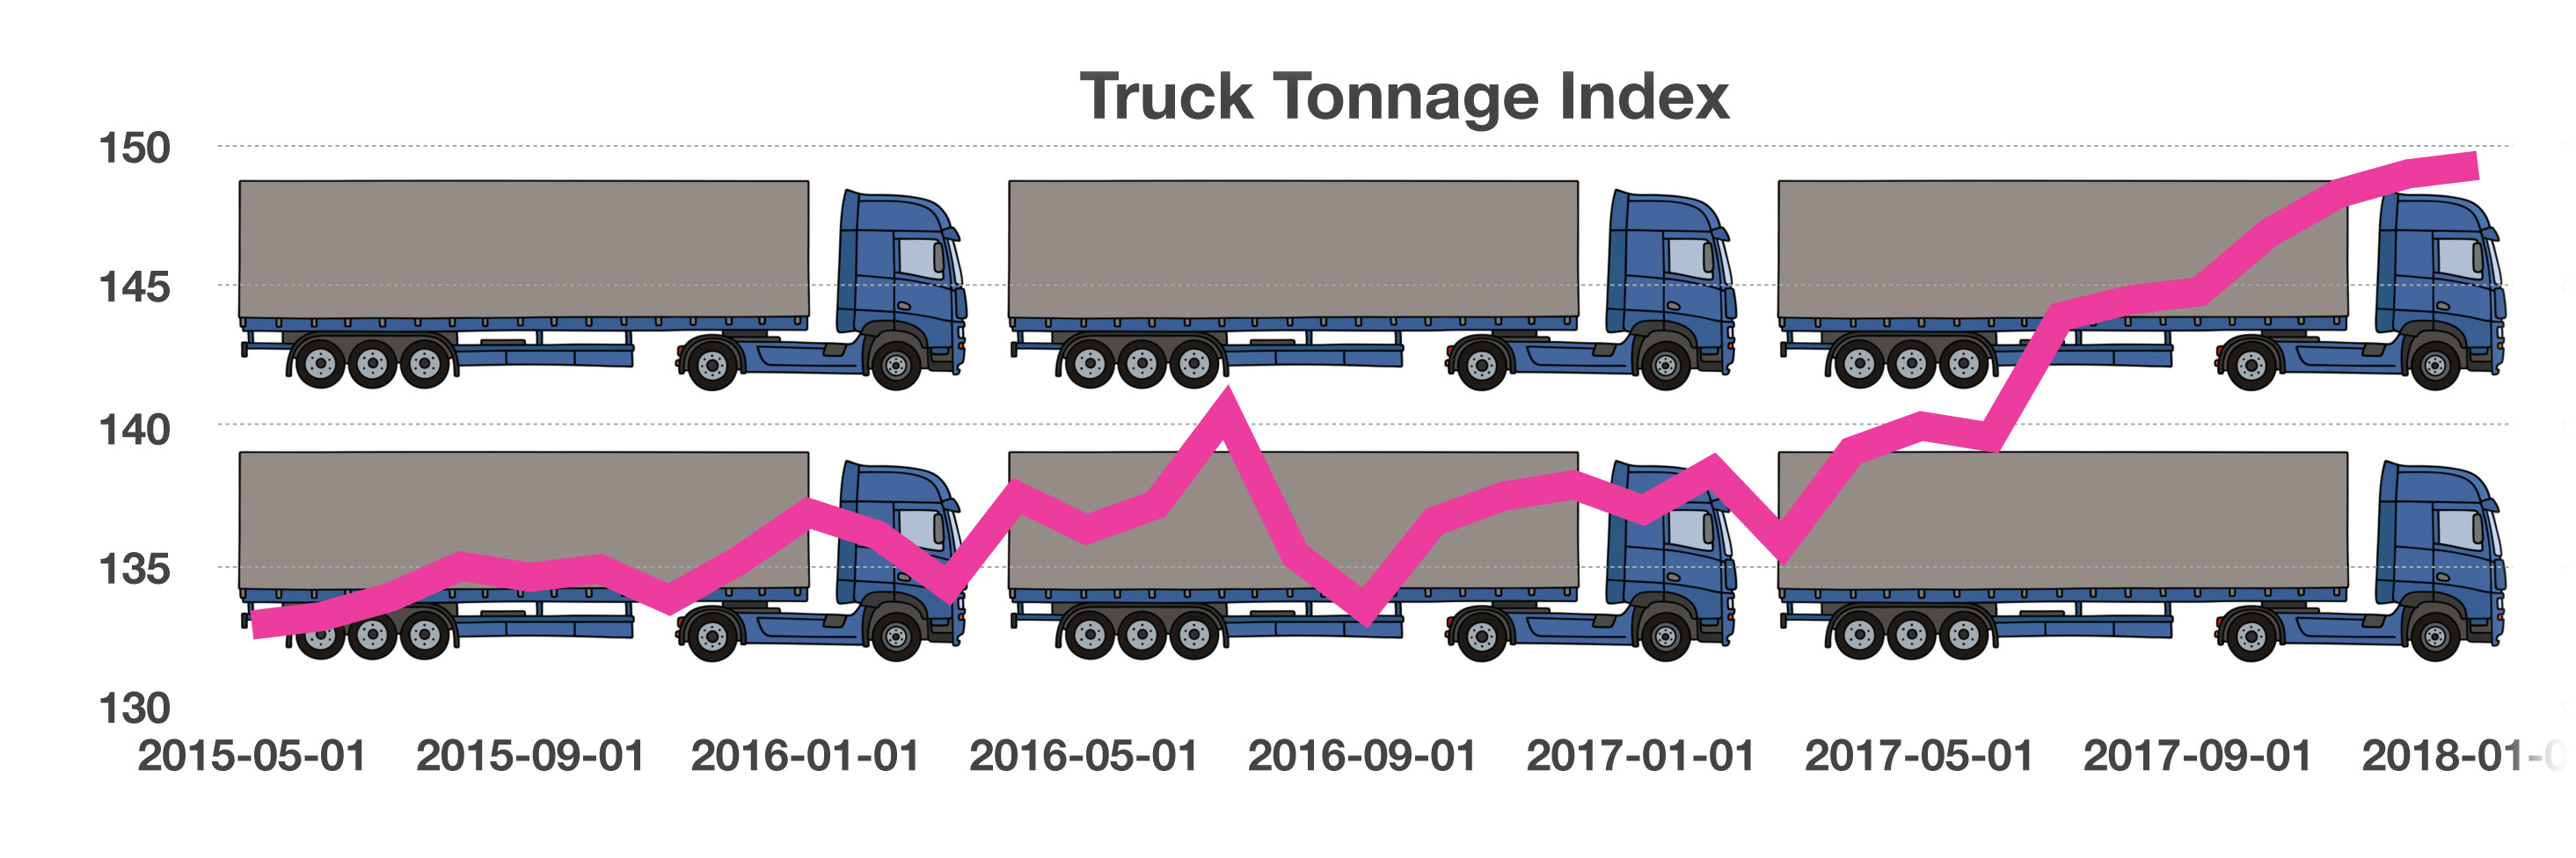
Trucks Delivering More – Economic Dynamics

A critical component of the economy proving fluid movement between companies and consumers are logistics and shipping services provided by the trucking industry. Trucks provide some of the most ample delivery logistics in the country, delivering packages and goods from Alaska to Florida spanning over 164,000 miles of highways nationwide.

There are over 1 million trucking companies spanning the country, from California and Hawaii to Alaska and Florida, transporting everything imaginable from food and milk to gasoline, cars and mail.

As a vital component of the labor market, the trucking industry employs roughly 7.3 million people, with 3.5 million of them as truck drivers. Economic growth also creates more shipping activity throughout the country, as companies ship products to other businesses and consumers. The Federal Reserve carefully tracks the amount of cargo shipped by trucks, viewed as a gauge of economic activity throughout the nation. Data is compiled as the Truck Tonnage Index, representing all shipments via trucks in the country. The index has been steadily increasing over the past 18 months, reaching a high of 149.3 in January 2018.   (Sources: trucking.org, Dept. of Transportation, Federal Reserve)

Gasoline Prices Heading Higher This Summer – Commodities Update

Crude oil prices have been trending higher over the past few months, resulting in higher gasoline prices. Geopolitical events have prompted supply disruptions in regions of the globe that have jolted energy markets. The anticipation of rising demand during the approaching summer months has also levied additional stress on the markets both domestically and internationally. The average cost for a gallon of regular grade gasoline nationwide as of April 30th was $2.84, already above the EIAs summer estimate of $2.74 per gallon.

Sporadic and infrequent occurrences, such as a major storm, can reduce gasoline supplies in parts of the country leading to short-term price “spikes.” Labor strikes and shortages may also cause production reductions and supply issues.   (Source: U.S. Energy Information Administration)