Ocean Park Capital Management
2503 Main Street
Santa Monica, CA 90405
Main: 310.392.7300
Daily Performance Line: 310.281.8577
Dow Jones | 42,270 |
S&P 500 | 5,911 |
Nasdaq | 19,113 |
2 Yr Treasury | 3.89% |
10 Yr Treasury | 4.41% |
10 Yr Municipal | 3.31% |
High Yield | 7.26% |
Dow Jones | -0.64% |
S&P 500 | 0.51% |
Nasdaq | -1.02% |
MSCI-EAFE | 17.30% |
MSCI-Europe | 21.20% |
MSCI-Pacific | 10.50% |
MSCI-Emg Mkt | 8.90% |
US Agg Bond | 2.45% |
US Corp Bond | 2.26% |
US Gov’t Bond | 2.44% |
Gold | 3,313 |
Silver | 33.07 |
Oil (WTI) | 60.79 |
Dollar / Euro | 1.13 |
Dollar / Pound | 1.34 |
Yen / Dollar | 144.85 |
Canadian /Dollar | 0.72 |
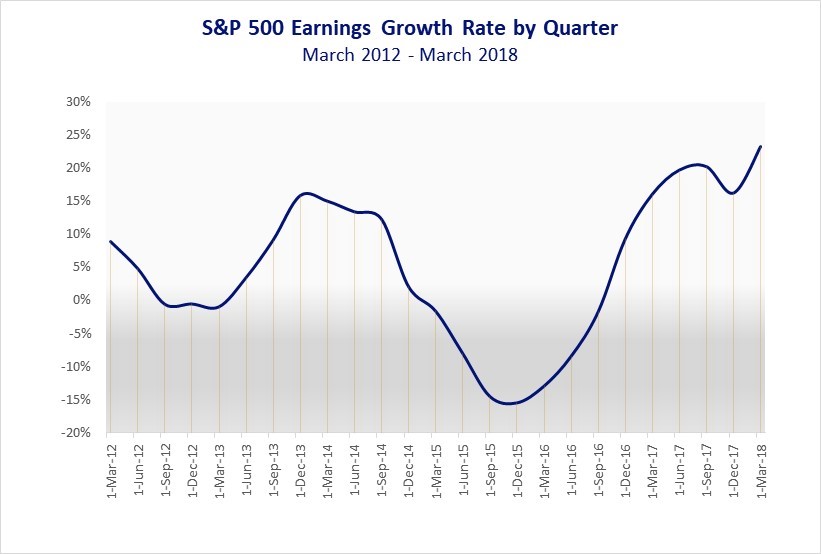
Equities generated fractional gains in April, while the Ocean Park Funds sustained fractional losses. The modest divergence flowed from our asset allocation which overweights semiconductor stocks (which were relatively weak) and underweights energy stocks (which were strong due to oil prices reaching their highest level in 3 years). Nonetheless, the funds remained well ahead of the major indices for the year to date.
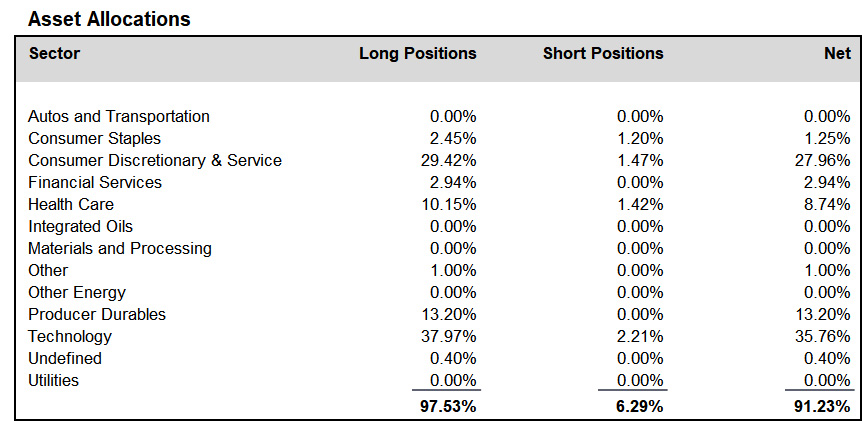
During April, we added to positions in the consumer discretionary and service and technology sectors, and reduced positions in the health care and producer durables sectors. We finished the month at about 91% net long, up from about 86% at the end of March.
A schedule showing the performance of the Investors Fund is included below, along with our Asset Allocation Chart. Daily updates on our activity are available on our Results Line, at
310-281-8577, and current information is also maintained on our website at www.oceanparkcapital.com. To gain access to the site enter password opcap.
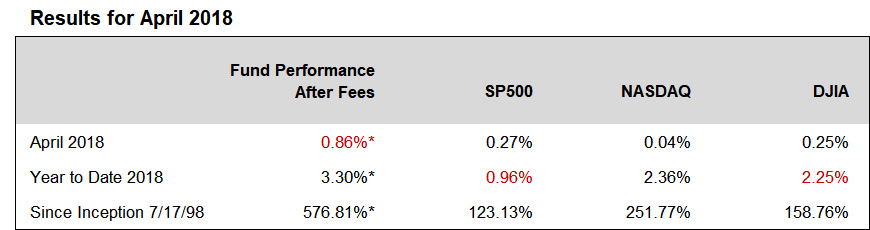
*These results are pro forma. Actual results for most investors will vary. See additional disclosures on page 4.
Past performance does not guarantee future results.
Apart from the energy sector, stocks moved generally sideways in April. The consumer discretionary sector rose modestly while industrials and consumer staples declined. Small cap stocks outperformed large cap stocks, which analysts attributed to the likelihood that they would gain more from the corporate tax cut. The theory is that large caps already have somewhat lower tax rates resulting from substantial international operations, meaning that the tax cut would have relatively less impact. On the other hand, small caps generate most of their revenue from the U.S., meaning that their tax rates are higher and the tax cut would therefore be more significant.
1st quarter earnings reported in April were outstanding. With 53% of S&P 500 companies reporting, the blended growth rate for earnings was 23.2%, significantly higher than the 11.3% projected at the start of the quarter. If this pace continues through earnings season, it will be the highest growth rate since Factset began tracking this statistic in 2008. In addition, 79% of companies beat consensus earnings estimates and 74% beat consensus revenue estimates, both numbers higher than the 1-year and 5-year averages.
Potential trade wars continued to dominate the headlines. After the U. S. imposed tariffs on China, the Chinese responded in kind. They announced 25% tariffs on about $50-billion in American products, covering a wide range of items including automobiles, soybeans and other foodstuffs, tobacco, and whiskey. This led to an immediate sell-off in stocks, followed by a rapid recovery. It is unclear when, or whether, any of the tariffs will actually be implemented. Market sentiment seems to assume that the administration’s trade policy is largely bluster and that the end result will be some sort of benign deal.
Meanwhile, economic data in April were generally positive. Indices tracking manufacturing and services showed continued growth. Unemployment remained low at 4.1%. The housing market was strong. Consumer sentiment rose. Interest rates continued to move higher, as the 10-year Treasury bond touched 3% for the first time in 4 years.
Performance data for OPI reflect the reinvestment of dividends and other earnings on the fund’s assets. Performance data for the major indices reflect only changes in the value of those indices, and would be higher if dividends were included. However, the index data do not reflect fees that would be paid to index fund managers and transaction costs that would be incurred when their component stocks are bought or sold, while OPI’s data do reflect quarterly fees and expenses incurred by the fund. The information provided is believed to be reliable, but its accuracy or completeness is not warranted. This material is not intended as an offer or solicitation for the purchase or sale of any stock, bond, mutual fund, or any other financial instrument. The views and strategies discussed herein may not be appropriate and/or suitable for all investors. This material is meant solely for informational purposes, and is not intended to suffice as any type of accounting, legal, tax, or estate planning advice. Any and all forecasts mentioned are for illustrative purposes only and should not be interpreted as investment recommendations.