May 2019
Market Update
(all values as of 04.30.2024)

Stock Indices:

Dow Jones 37,815
S&P 500 5,035
Nasdaq 15,657

Bond Sector Yields:

2 Yr Treasury 5.04%
10 Yr Treasury 4.69%
10 Yr Municipal 2.80%
High Yield 7.99%

YTD Market Returns:

Dow Jones 0.34%
S&P 500 5.57%
Nasdaq 4.31%
MSCI-EAFE 1.98%
MSCI-Europe 2.05%
MSCI-Pacific 1.82%
MSCI-Emg Mkt 2.17%
 
US Agg Bond 0.50%
US Corp Bond 0.56%
US Gov’t Bond 0.48%

Commodity Prices:

Gold 2,297
Silver 26.58
Oil (WTI) 81.13

Currencies:

Dollar / Euro 1.07
Dollar / Pound 1.25
Yen / Dollar 156.66
Canadian /Dollar 0.79
 

Macro Overview

Tranquility that fell upon markets as volatility receded in April was interrupted by a return of uncertainty surrounding trade negotiations between China and the United States.

Incomplete trade discussions with China are still a threat to global markets as an agreement regarding tariffs and intellectual property rights has yet to be finalized. U.S. government revenues from tariffs already in place on Chinese imports stand at about $5 billion per month.

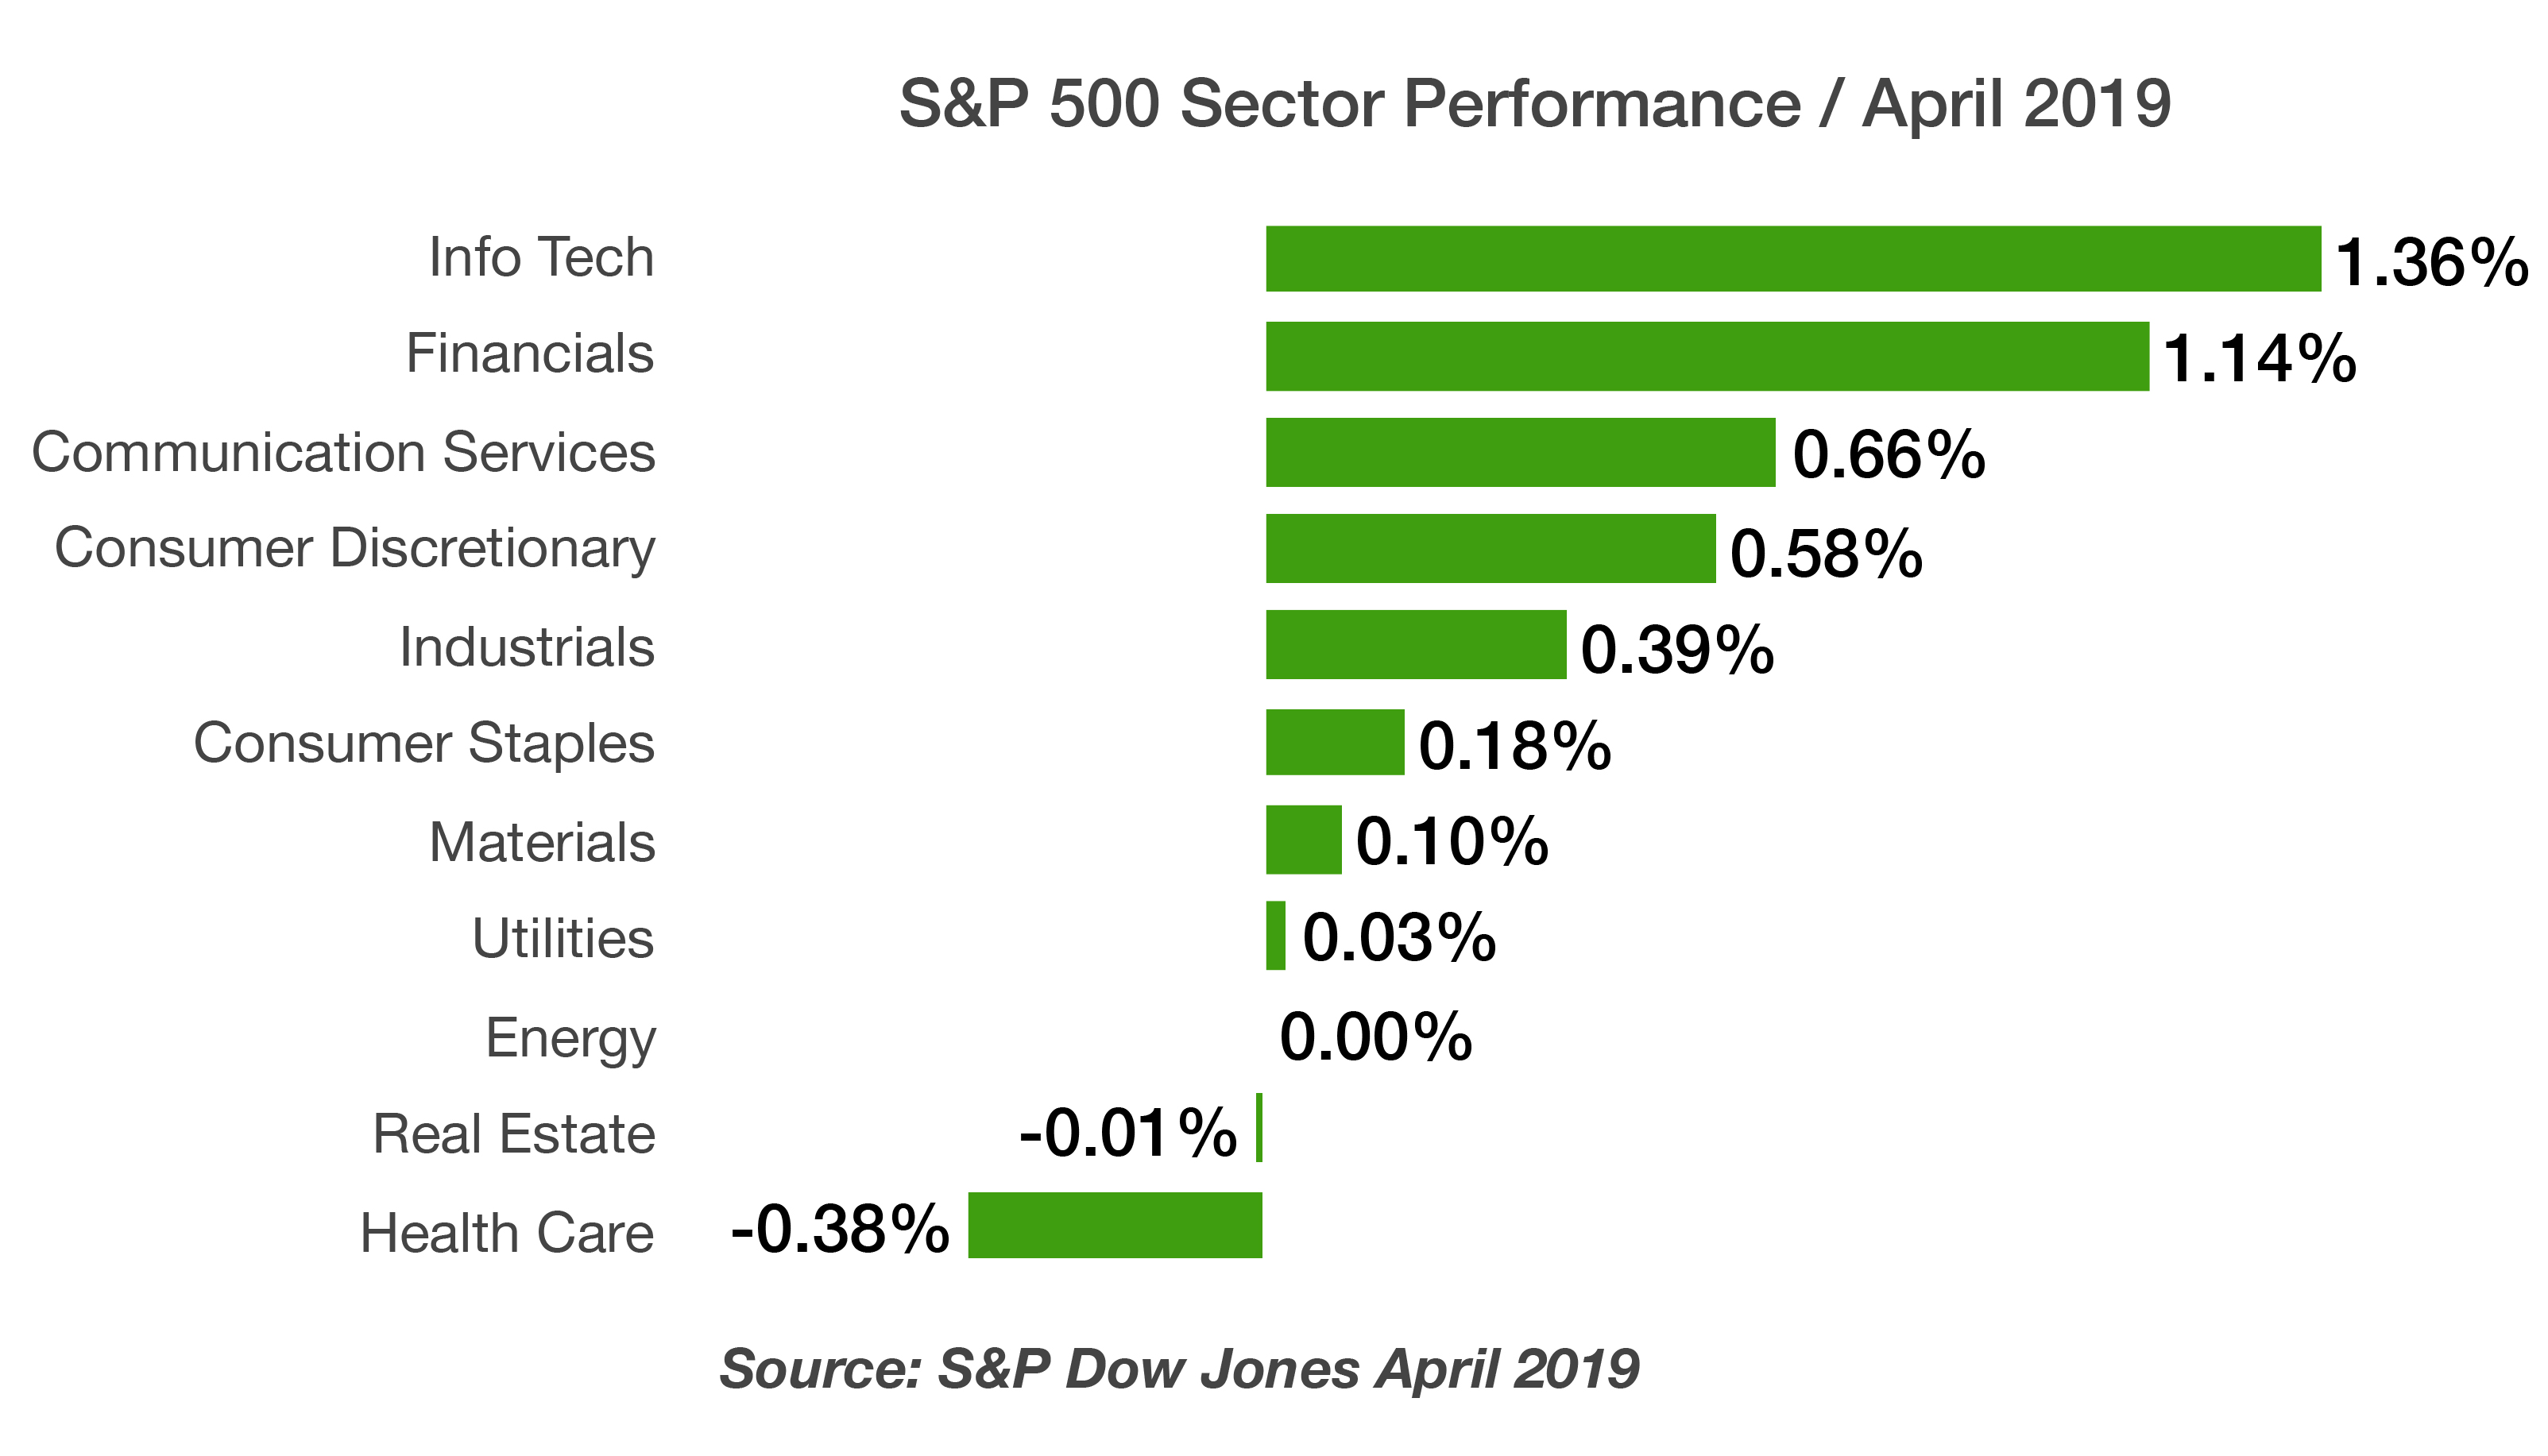
Equity markets reached higher levels in April as trade fears ebbed and rising rate expectations remained modest. The Federal Reserve signaled that it would be patient in raising rates further, which instilled a calm over financial markets. Markets have become increasingly data sensitive trying to decipher what reaction the Fed may have following the release of economic data.

Data released by the Bureau of Economic Analysis (BEA) showed a slowdown in consumption since the beginning of the year, attributable to the government shutdown, poor weather, and market volatility in December.

Oil prices reacted when the U.S. eliminated a waiver for countries buying oil from Iran, which had sanctions imposed this past year. Domestic crude oil, priced as West Texas Intermediate (WTI) surpassed $66 per barrel in April, among the highest levels in 8 months.

Market analysts and economists attribute low inflation and a low probability of recession as the reasons behind persistent slow economic growth. This dynamic is known as secular stagnation, a condition of negligible or no economic growth in a market-based economy.

During a hearing before the House Committee on Oversight & Government Reform, the Postmaster General said that the USPS is considering reducing mail delivery to 5 days per week. A decline in first class mail volume has created a financial burden for the USPS, which ended fiscal 2018 with a $3.9 billion loss.

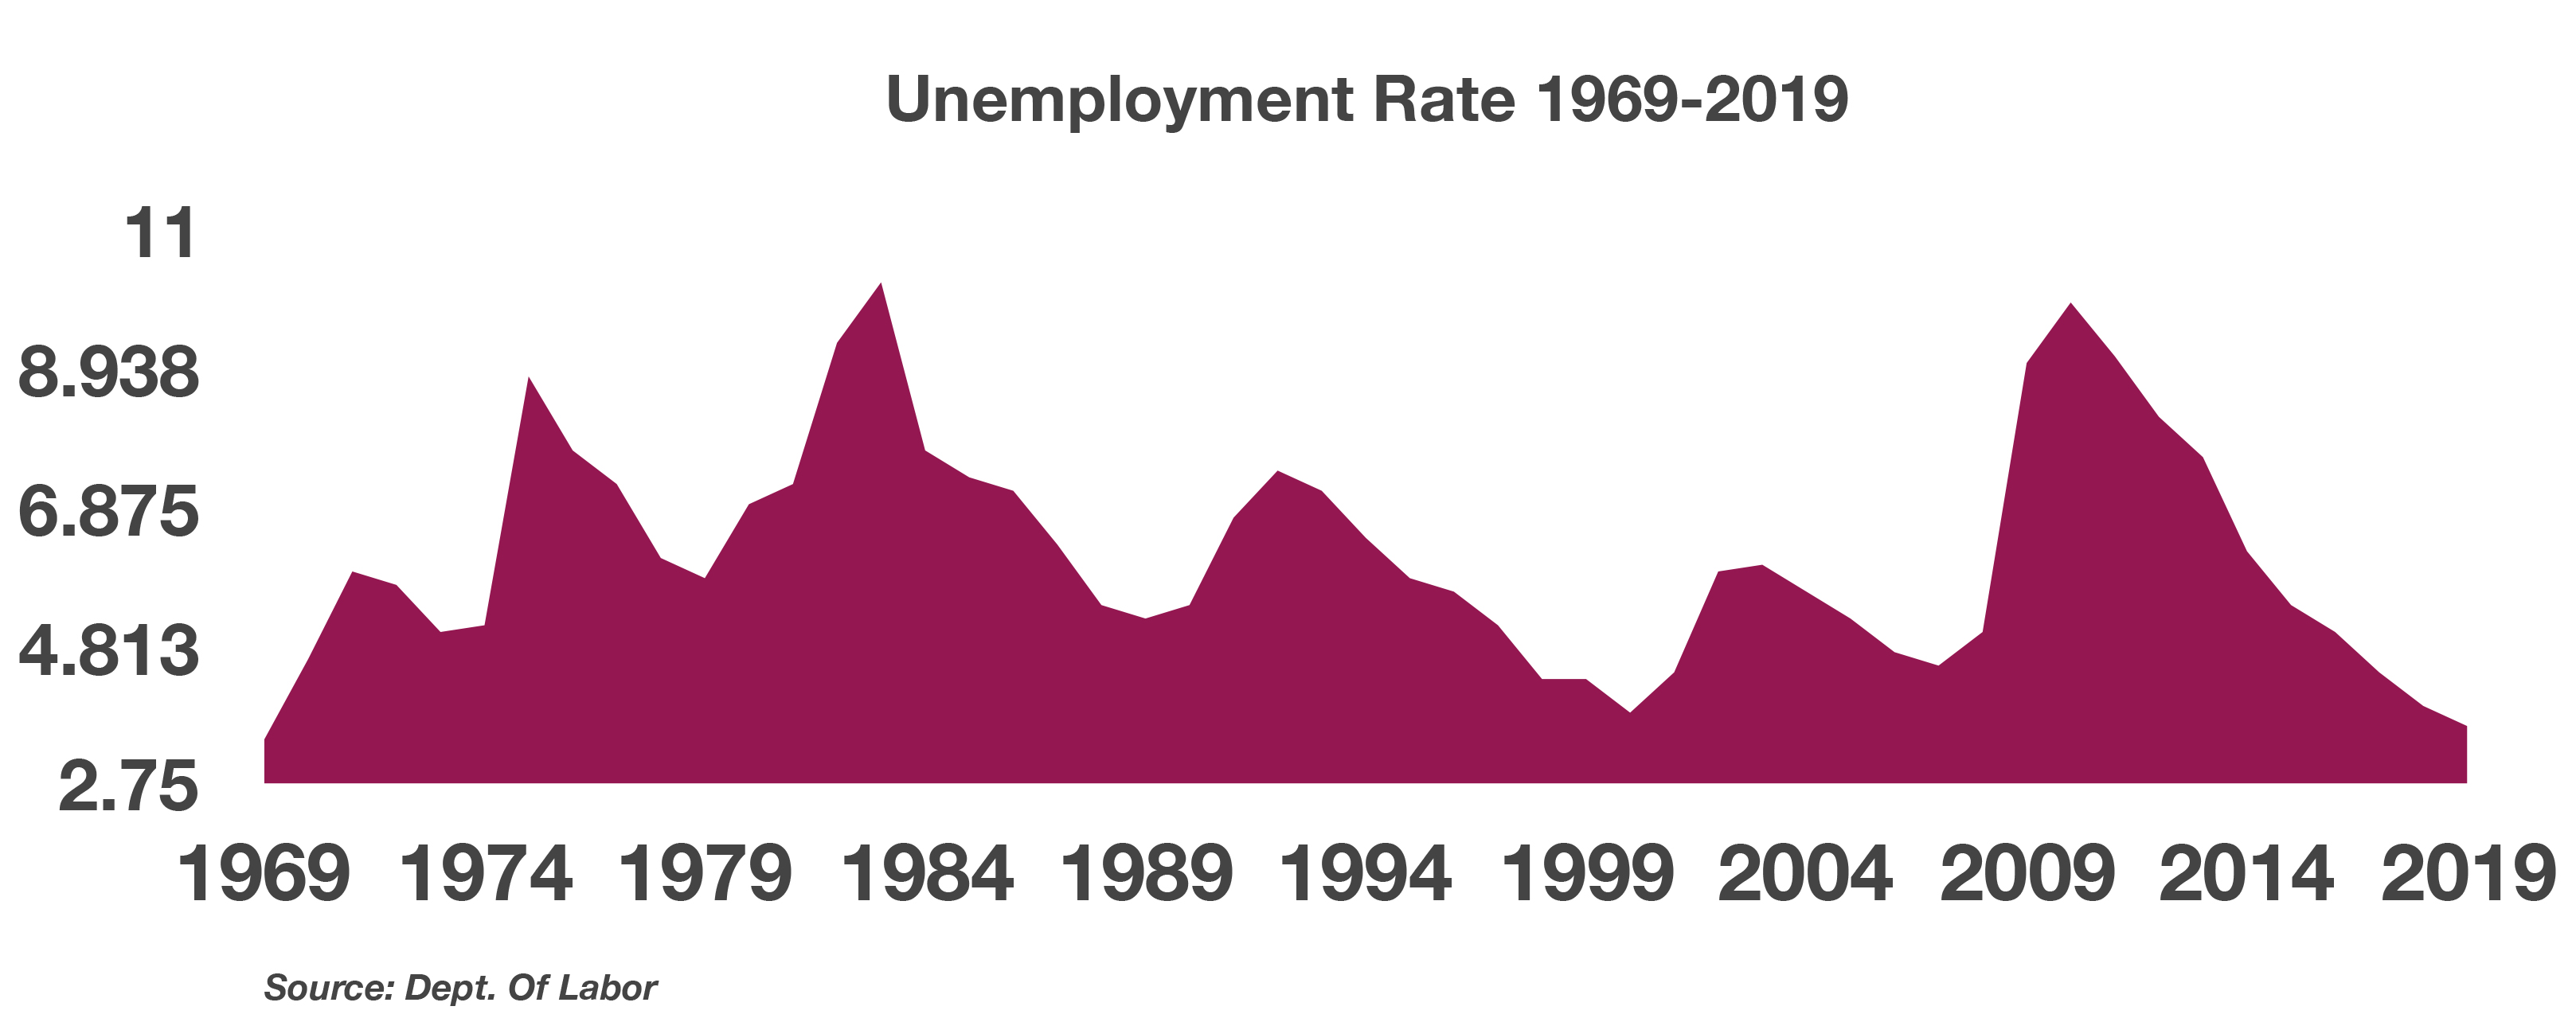
The unemployment rate fell to a 50-year low of 3.6% in April, the lowest since 1969. Even with such low unemployment, wage growth is still weak with some blaming a shrinking pool of qualified workers and an older aged work force demanding less pay increases than their younger counterparts. (Source: Federal Reserve Bank of St. Louis, Dept. of Commerce, USPS, Labor Dept)


30 year mortgage rates fell to 4.14% in april

Technology & Financials Lead In April – Equity Update

Domestic and foreign equity indices rose in April as rates stabilized and earnings for most companies were as expected or better. Some analysts were perplexed as the leading sectors in April were information technologies and financials, contributing over half of the S&P 500 Index 4.05% return for April. Earnings and optimism surrounding the trade discussions helped elevate shares across all sectors.

Optimistically, even though equity analysts are expecting a slowdown in corporate earnings, they are not seeing a slowdown in revenue growth. This is interpreted as underlying economic growth, which may eventually fuel an increase in earnings.

The S&P 500 Index at the end of April was trading at roughly 17 times forward earnings, where it was at the peak in September 2018. A rapid rise in equity and fixed income prices since the steep drop in the fall of 2018 was unexpected by many.

(Sources: S&P, Bloomberg, Reuters)


Rates Remain Stable – Fixed Income Update

Rates stabilized in April as government and corporate sectors saw a gradual increase in yields. Analysts and economists view a slight increase in rates following a sharp decrease in yields, as a form of stabilization in the fixed income markets. The Fed consoled markets with a hold-and-wait stance as it announced no change in short-term rates. Deflation and stagnate growth remains an issue validated by rates at near zero or below in Japan and Germany, two primary global economic barometers. Such an environment continues to make U.S. government bond yields attractive relative to other developed nations’ debt.

The rate for a conforming 30-year mortgage fell to 4.14% in April, down from 4.55% in April of 2018, which may bode well for the housing market heading into the summer selling season. The difference in rates from a year ago is equal to a mortgage payment reduction of roughly $75 per month on a $307,700, 30-year mortgage, which is the average sales price for a home nationwide as of this past month. (Sources: U.S. Treasury, Federal Reserve, Bloomberg)

45% of Americans Pay No Federal Income Tax – Fiscal Policy

An estimated 76.4 million Americans, identified as households, paid no federal income tax for tax 2018. The non-partisan, non-profit tax group known as The Tax Policy Center released income tax data it analyzed for 2018 and found that nearly half, about 44.4% of American households, paid no federal income tax last year. The Tax Policy Center estimates that the number of Americans that did not pay income tax for tax year 2018 increased from 72.6 million in 2016, before the Tax Cuts & Jobs Act became effective.

According to the data, the top 0.1% of taxpayers pay the equivalent of 39.2% of all taxes while the bottom 20% pay no taxes and receive tax refunds in the form of refundable tax credits. The ultra wealthy, also know as the top 1% of taxpayers, with annual incomes of about $2 million, pay about 40% of all of the federal income taxes in the U.S. (Source: Tax Policy Center/Washington D.C.)

 
the average tax refund so far this tax season is $2,725

How To Check On Your Refund Status – Tax Planning

According to the IRS, as of April 19th, the agency had issued over 95 million tax refunds worth more than $260 billion. The average refund so far through mid-April is $2,863, slightly less than the average refund from last year.

The majority of taxpayers getting a refund are doing so through direct deposit, which accounts for almost 88% of refunds so far this year. The IRS had received 137 million tax returns by mid-April, of which more than 126 million were filed electronically. The IRS also noted that more taxpayers are visiting its website, IRS.gov, in order to get tax help and information.

The IRS site allows taxpayers to check the status of a refund, access transcripts of their tax returns, request electronic filing of Personal Identification Numbers, find answers to tax law questions, and check the status of amended returns. Usage of the tool to check the status of a refund “Where’s My Refund?” was the most visited U.S. government website at the end of March.

(Source: IRS, www.irs.gov/Refunds, www.analytics.usa.gov/)

Oil & Retirees Drive Population Growth – Demographics

Recently released Census data revealed that the fastest growing cities in terms of population growth have been driven by the oil industry and retirees. The Census report documented population growth from July 2017 to July 2018, identifying ten of the fastest growing cities nationwide. Half of the fastest growing cities are being driven by retirees migrating in and the other half attributable to new oil industry jobs.

Midland and Odessa Texas were among the fastest growing cities, with numerous oil industry jobs attracting people from all over the country. Midland saw a 4.2% population gain for the annual period ending July 2018, as the region’s rich petroleum and natural gas deposits boosted the economy and drew workers in seeking new jobs.

Retirement communities including Myrtle Beach, St. George and The Villages, all saw an influx of retirees. These communities have become attractive for seniors providing essential services and amenities all within a single location.

Various factors have historically affected population growth throughout the United States including demographics, local industry and the economy. An aging baby boom generation along with job development in the oil sector has been the primary driver of growth for the nation’s fastest growing cities. (Source: Census Bureau)

 
the social security trust fund will be depleted by 2034

Social Security Falls Short On Projections – Retirement Planning

Social Security costs will exceed its income in 2020 for the first time since 1982, forcing the program to dip into it’s trust fund, which is currently just under $3 trillion. Social Security is funded by two trust funds, one for retiree benefits and another for disability benefits. Disability applications have actually been declining since 2010, with a decreasing number of workers receiving disability benefits since 2014.

The latest annual report issued by the trustees of Social Security and Medicare revealed that by 2034, the program’s trust fund will be depleted. Depletion means that Social Security recipients will no longer be receiving full scheduled benefits. Recipients would receive about three-quarters of their scheduled benefits after 2034. Congress can eventually act to fortify the program’s finances, but it may be years before it actually takes effect and funds.

Social Security’s largest costs are attributable to Medicare, which represents over 76% of Social Security benefits. The report also mentioned that Medicare’s hospital insurance fund would be depleted in 2026. The trustees noted that the aging population of the country has placed additional pressure on both the Social Security and Medicare programs. A decade ago, roughly 12% of Americans were age 65 or older, today 16% of Americans have already surpassed 65, the eligibility age for Medicare.


The Social Security Administration considers various factors in projecting its estimates, including fertility, immigration, wages, health, and economic growth. A recent drop in U.S. birthrates along with stagnant wages has placed additional burden on the viability of future benefit payments.

Sources: https://www.ssa.gov/oact/TR/2019/index.html

 
US stock market has delivered an average annual return of around 10% since 1926

Financial TIP: The Uncommon Average

“I have found that the importance of having an investment philosophy—one that is robust and that you can stick with— cannot be overstated.” —David Booth

The US stock market has delivered an average annual return of around 10% since 1926.[1] But short-term results may vary, and in any given period stock returns can be positive, negative, or flat. When setting expectations, it’s helpful to see the range of outcomes experienced by investors historically. For example, how often have the stock market’s annual returns actually aligned with its long-term average?

Exhibit 1 shows calendar year returns for the S&P 500 Index since 1926. The shaded band marks the historical average of 10%, plus or minus 2 percentage points. The S&P 500 Index had a return within this range in only six of the past 93 calendar years. In most years, the index’s return was outside of the range—often above or below by a wide margin—with no obvious pattern. For investors, the data highlight the importance of looking beyond average returns and being aware of the range of potential outcomes.


Exhibit 1.       S&P 500 Index Annual Returns 1926–2018

In US dollars. S&P data © S&P Dow Jones Indices LLC, a division of S&P Global. Indices are not available for direct investment. Index returns are not representative of actual portfolios and do not reflect costs and fees associated with an actual investment. Past performance is no guarantee of future results. Actual returns may be lower.


[1]. As measured by the S&P 500 Index from 1926–2018.

 
chance of having a positive outcome improve over longer time horizons

Financial TIP: The Uncommon Average (continued)


TUNING IN TO DIFFERENT FREQUENCIES

Despite the year-to-year volatility, investors can potentially increase their chances of having a positive outcome by maintaining a long-term focus. Exhibit 2 documents the historical frequency of positive returns over rolling periods of one, five, and 10 years in the US market. The data show that, while positive performance is never assured, investors’ odds improve over longer time horizons.


Exhibit 2.       Frequency of Positive Returns in the S&P 500 Index

Overlapping Periods: 1926–2018

In US dollars. From January 1926–December 2018, there are 997 overlapping 10-year periods, 1,057 overlapping 5-year periods, and 1,105 overlapping 1-year periods. The first period starts in January 1926, the second period starts in February 1926, the third in March 1926, and so on. S&P data © S&P Dow Jones Indices LLC, a division of S&P Global. Indices are not available for direct investment. Index returns are not representative of actual portfolios and do not reflect costs and fees associated with an actual investment. Past performance is no guarantee of future results. Actual returns may be lower.

 Conclusion

While some investors might find it easy to stay the course in years with above average returns, periods of disappointing results may test an investor’s faith in equity markets. Being aware of the range of potential outcomes can help investors remain disciplined, which in the long term can increase the odds of a successful investment experience. What can help investors endure the ups and downs? While there is no silver bullet, understanding how markets work and trusting market prices are good starting points. An asset allocation that aligns with personal risk tolerances and investment goals is also valuable. By thoughtfully considering these and other issues, investors may be better prepared to stay focused on their long-term goals during different market environments.


There is no guarantee investment strategies will be successful. Investing involves risks, including possible loss of principal. Diversification does not eliminate the risk of market loss.  All expressions of opinion are subject to change. This article is distributed for informational purposes, and it is not to be construed as an offer, solicitation, recommendation, or endorsement of any particular security, products, or services.