Ocean Park Capital Management

2503 Main Street

Santa Monica, CA 90405

Main: 310.392.7300

Daily Performance Line:  310.281.8577

April 2020
Market Update
(all values as of 04.30.2024)

Stock Indices:

Dow Jones 37,815
S&P 500 5,035
Nasdaq 15,657

Bond Sector Yields:

2 Yr Treasury 5.04%
10 Yr Treasury 4.69%
10 Yr Municipal 2.80%
High Yield 7.99%

YTD Market Returns:

Dow Jones 0.34%
S&P 500 5.57%
Nasdaq 4.31%
MSCI-EAFE 1.98%
MSCI-Europe 2.05%
MSCI-Pacific 1.82%
MSCI-Emg Mkt 2.17%
 
US Agg Bond 0.50%
US Corp Bond 0.56%
US Gov’t Bond 0.48%

Commodity Prices:

Gold 2,297
Silver 26.58
Oil (WTI) 81.13

Currencies:

Dollar / Euro 1.07
Dollar / Pound 1.25
Yen / Dollar 156.66
Canadian /Dollar 0.79
 

Portfolio Overview

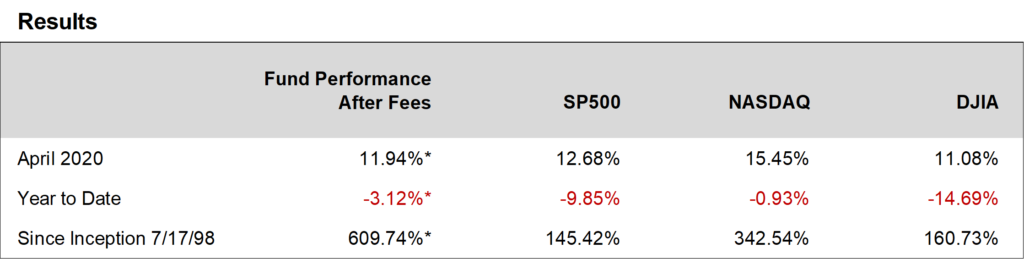
The Ocean Park funds rebounded sharply in April.  We ended the month down 3.12%* for the year, significantly outperforming most of the major indices as well as the HFRI Equity Hedge Index, which was down 8.08%.  Our performance is largely the result of a decision we made to keep the bulk of our portfolio intact, despite analysts broadly lowering estimates due to the shutdown of the economy.  We determined that the first quarter consensus earnings bar had been set low enough that most of our stocks were still likely to surprise to the upside.  In addition, we determined that the market had already gone down far enough that equities would not be punished for missing expectations by small margins.  As a result, we avoided selling at the market bottom.

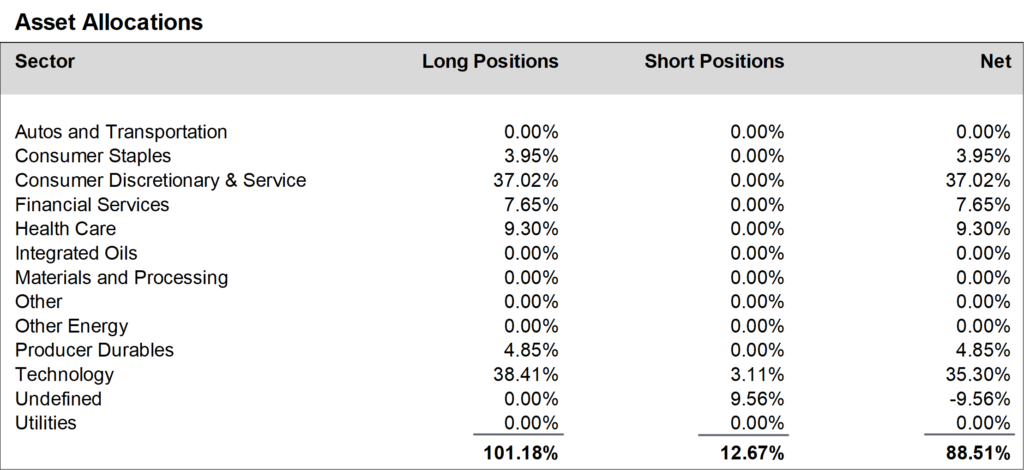
Going forward however, we have chosen to be more cautious because the market has rebounded substantially and there are red flags that we feel the market has not yet absorbed.  Consequently, we initiated a substantial hedge by shorting SPYs and QQQs, which is reflected in the Asset Allocation chart in the Undefined category.

During April, we reduced positions in the technology sector and added to positions in the consumer discretionary and service sector.  We finished the month at about 89% net long, down from about 95% at the end of March.

Daily updates on our activity are available on our Results Line, at 310-281-8577, and current information is also maintained on our website at www.oceanparkcapital.com. To gain access to the site enter password opcap.

*These results are pro forma. Actual results for most investors will vary. See additional disclosures on page 4.
Past performance does not guarantee future results.

 
Equity Overview - April 2020

 Equity Overview

All sectors gained ground in April.  Energy, which was the worst sector in March, was the best sector in April.  Growth stocks outperformed value stocks.  Volatility declined from the historic levels reached in March.

First quarter corporate earnings reported in April were mixed.  With 55% of S&P 500 companies reporting, the blended growth rate was negative at -13.7%.  However, 65% of companies beat consensus earnings estimates — below the one-year and five-year averages but still impressive given economic conditions.  And 63% beat consensus revenue estimates, which was better than the one-year and five-year averages.  Notably, according to FactSet, the market rewarded both earnings beats and misses in April.  During the period from two days before their earnings report to two days after the report, companies that beat consensus earnings estimates generated an average price increase of 1.6%.  Remarkably, during the same period, companies that missed consensus earnings estimates generated an average price increase of 0.3% — far better than the average decrease of -2.8% sustained by such companies in the previous 20 quarters.


Macro Overview - April 2020

Macro Overview

Economic data reported in April was almost uniformly negative. The Commerce Department initial estimate of first quarter GDP was -4.8%, the lowest since the financial crisis of 2008. The worst component was personal consumption which registered a decline of 7.6%, the worst since 1980. The Department of Labor reported that unemployment rose to 30 million, effectively wiping out all of the jobs gained since 2009. Manufacturing and retail sales plunged. Consumer confidence as measured by the Conference Board registered its largest decline since 1973.

In the face of these dire statistics, stocks generated historic gains. How was this possible? There were at least two significant countervailing events in April. The first was the agreement between OPEC and Russia on production cuts to support the price of oil, which lent stability to the world economy. The second, and more significant, was action by the Federal Reserve. Chairman Powell stated, essentially, that the Fed would do whatever was necessary for as long as necessary to support the U.S. economy. This meant keeping interest rates near zero and injecting record amounts of liquidity — by some estimates in the neighborhood of $4-trillion — into a wide variety of bond markets including Treasurys and mortgage-backed securities, as well as unprecedented purchases of municipal bonds and “high-yield” a.k.a junk bonds. This provided an important psychological — and actual — backstop, and brought the classic maxim of “Don’t fight the Fed” into play. Stocks reacted accordingly.


Additional Disclosures

Additional Disclosures

Performance data for OPI reflect the reinvestment of dividends and other earnings on the fund’s assets.  Performance data for the major indices reflect only changes in the value of those indices, and would be higher if dividends were included. However, the index data do not reflect fees that would be paid to index fund managers and transaction costs that would be incurred when their component stocks are bought or sold, while OPI’s data do reflect quarterly fees and expenses incurred by the fund.  The information provided is believed to be reliable, but its accuracy or completeness is not warranted. This material is not intended as an offer or solicitation for the purchase or sale of any stock, bond, mutual fund, or any other financial instrument. The views and strategies discussed herein may not be appropriate and/or suitable for all investors. This material is meant solely for informational purposes, and is not intended to suffice as any type of accounting, legal, tax, or estate planning advice. Any and all forecasts mentioned are for illustrative purposes only and should not be interpreted as investment recommendations.