Tradition Asset Management

129 Summit Avenue

Summit, NJ  07901

908.598.0909

traditioncm.com

Review of May Markets and Economy
Market Update
(all values as of 08.30.2024)

Stock Indices:

Dow Jones 41,563
S&P 500 5,648
Nasdaq 17,713

Bond Sector Yields:

2 Yr Treasury 3.91%
10 Yr Treasury 3.91%
10 Yr Municipal 2.70%
High Yield 6.92%

YTD Market Returns:

Dow Jones 10.28%
S&P 500 18.42%
Nasdaq 18.00%
MSCI-EAFE 9.72%
MSCI-Europe 9.81%
MSCI-Pacific 9.34%
MSCI-Emg Mkt 7.44%
 
US Agg Bond 3.07%
US Corp Bond 3.49%
US Gov’t Bond 2.95%

Commodity Prices:

Gold 2,535
Silver 29.24
Oil (WTI) 73.65

Currencies:

Dollar / Euro 1.10
Dollar / Pound 1.31
Yen / Dollar 144.79
Canadian /Dollar 0.74

Macro Overview 

A resurgence of sporadic economic activity emerged in May as stay at home bans were eased and some businesses slowly reopened. Virus resurgence fears are still a concern as uncertainty surrounding the availability of a vaccine lingers. Following April’s rebound for U.S. equities, May continued to post recaptured gains for all major stock indices. Slow re-openings by states and cities have allowed a gradual reactivation of economic activity benefiting nearly all sectors of the equity markets.

Unemployment hit 14.7%, the highest since the great depression era, when unemployment was 25%. Income and education levels were profoundly affected, with over 40 million applying for unemployment claims since the middle of March. The extent of the lock down for businesses nationwide is being blamed for a vast amount of small business bankruptcies that may prohibit the re-hiring of millions of workers in numerous industries.

Retail sales in April saw their largest decline on record, the result of mandatory store closings and stay at home requirements. Industrial and manufacturing activity also fell in April, an indicator of a slower economic environment. Economic damage may not be fully recognized for months as lagging data tracked by various government agencies trickle into the headlines and financial markets. Consumer confidence, as measured by the University of Michigan CC Index, improved in May as consumers sought hope from the gradual easing of the virus quarantine. Inflation expectations also increased as scarce goods demanded higher prices across the country. State and local government budgets nationwide are starting to see budget deficits as tax revenues have fallen significantly due to business closures and dramatic increases in unemployment.

Economists and analysts are curious as to how the millions of unemployed workers will sustain themselves when their unemployment benefits expire. The $600 weekly unemployment benefit provided by the federal government expires on July 31st, unless extended by Congress. Individual state benefits vary on maximum weekly amounts, duration, and extension qualifications. A study compiled by the Chicago Federal Reserve revealed that consumers spent nearly half of their federal stimulus checks within two weeks, then reverting to their prior spending habits. Economists expect that the economic effects of the one-time payments will be short lived.

Congress is expected to extend the period of time allotted for small businesses to use funds provided by the Paycheck Protection Program (PPP) from 8 weeks to 24 weeks. The additional time allows businesses to apply funds to approved expenses including payroll, rent, and utilities. Higher income workers tend to have work at home opportunities more available to them than lower income workers, worsening the situation for low income earners.

Federal unemployment benefits skyrocketed to $430 billion in April, the single largest monthly increase ever. Monthly unemployment benefits had been averaging $29.5 billion per month over the last five years, prior to the initial payout in benefits starting in March 2020 following the virus outbreak. (Sources: Federal Reserve, Dept. of Labor, Commerce Dept., Bloomberg (Market Update))

 
Equity markets continued to move higher in May

Equities Rebound In May – Domestic Stock Market Review

Equity markets continued to move higher in May despite lower earnings expectations and dismal economic data releases. The disparity with economic data and equity markets rebounding are perplexing to some economists and analysts.

A Congressional vote has slated Chinese companies listed on U.S. stock exchanges to be delisted should required financial disclosures not be honored. The Senate said that Chinese companies have disregarded U.S. reporting standards thus misleading U.S. investors.

The rebound in equities over the past two months, was not anticipated by many analysts and economists, as fiscal and monetary stimulus efforts were not expected to produce much benefits until later in the year. (Sources: congress.gov, Bloomberg)


Increase In Income Data May Be Misleading – Government Statistics Review

Data released by the Commerce Department showed that consumer spending collapsed by a record 13.6% in April, the steepest drop since 1959. Stay home orders and store closures kept consumers from spending in addition to the sudden loss of jobs nationwide. What consumers spend in the economy represents over 70% of Gross Domestic Product (GDP), a critical component to the vitality of the U.S. economy.

The Commerce Department also released personal income data for April, which showed a 10.5% increase for the month of April. The data is considered misleading by many because it includes the one-time stimulus payments and enhanced unemployment benefits. Data actually revealed that the $1200 stimulus payments and the $500 per child payments accounted for the bulk of the personal income gains in April. Economists expect the bump up in personal income for April to be short lived as stimulus payments and unemployment benefits start to fade away. (Sources:  BEA, Labor Department, Commerce Department)


Where Unemployment Is Hitting The Hardest – Labor Market Demographics

The nation’s unemployment rate skyrocketed to 14.7% in April, representing the largest percentage of unemployed workers since the great depression, when the rate reached 25% in 1933. The pandemic’s affect on the labor force has been extensive and rapid, resulting in a dramatic increase in the unemployment rate.

What has truly made this spike in unemployment unique is the fact that all sectors of the economy have been affected, along with all income and education levels. Data compiled by the Department of Labor show that all income and education levels fell considerably in April 2020. Unemployment has historically been highest for non-high school graduates and recent high school graduates, relative to those with bachelor and masters degrees who traditionally see the lowest unemployment rates.

Unemployment for non-high school grads rose to over 20% in April, up from 5.2% in April 2019, while workers with a bachelors degree and higher experienced 8.2% unemployment in April. The surprise with the latest unemployment numbers for higher educated workers was the exponential increase from a year earlier, when only 1.9% were unemployed. We believe that economists view this as a validation of the profound effect the pandemic has had on the labor market. (Source: Department of Labor)

 
March PCE saw a 7.5% decline in consumer expenditures

Over Half of Unemployed Making More Than When Employed  

The National Bureau of Economic Research released findings of a study examining the amount of unemployment benefits recipients are being paid. The study found that roughly 68% of jobless workers are bringing home more than what their job was paying them. The combination of state and federal unemployment benefits have been extremely generous with the passage of the $2.2 trillion CAREs Act.

Unemployment benefit payments replaced an average of 134% of lost wages for the average jobless worker. State unemployment benefits vary as to how long they last, however the federal unemployment benefits of $600 per week are due to expire at the end of July. Findings from the study show that lower income workers have benefited the most from the enhanced unemployment payments, whose jobs may not be there when they return to work, due to the industries affected employing lower wage workers. (Source: National Bureau of Economic Research)


Consumers Spending Much Less – Consumer Behavior

Recovery to the economy has become hinged on the ability of the American consumer to regain confidence and start spending again. What consumers spend on goods and services represents roughy 70% of Gross Domestic Product (GDP)

The Commerce Department, which tracks what consumers spend money on and how much they spend each month, reported the largest monthly drop in Personal Consumption Expenditures (PCE) since data tracking began in 1959. March PCE saw a 7.5% decline in consumer expenditures, as the pandemic restrained discretionary spending leading to a drop in over $1.1 billon in expenditures. Expenditures composing the PCE Index include automobiles, food, housing, furniture, health care, and clothing.

Consumer behavior has been altered since the pandemic began, with a drop for certain items such as cars, furniture, and clothing, yet with an increase in food purchases at grocery stores. Many believe that it may be months before a better gauge of what consumers will be buying and where the demand may be. (Source: U.S. Commerce Department)


Interest rates held steady in May

States Lose Valuable Tax Revenue – Municipalities Update

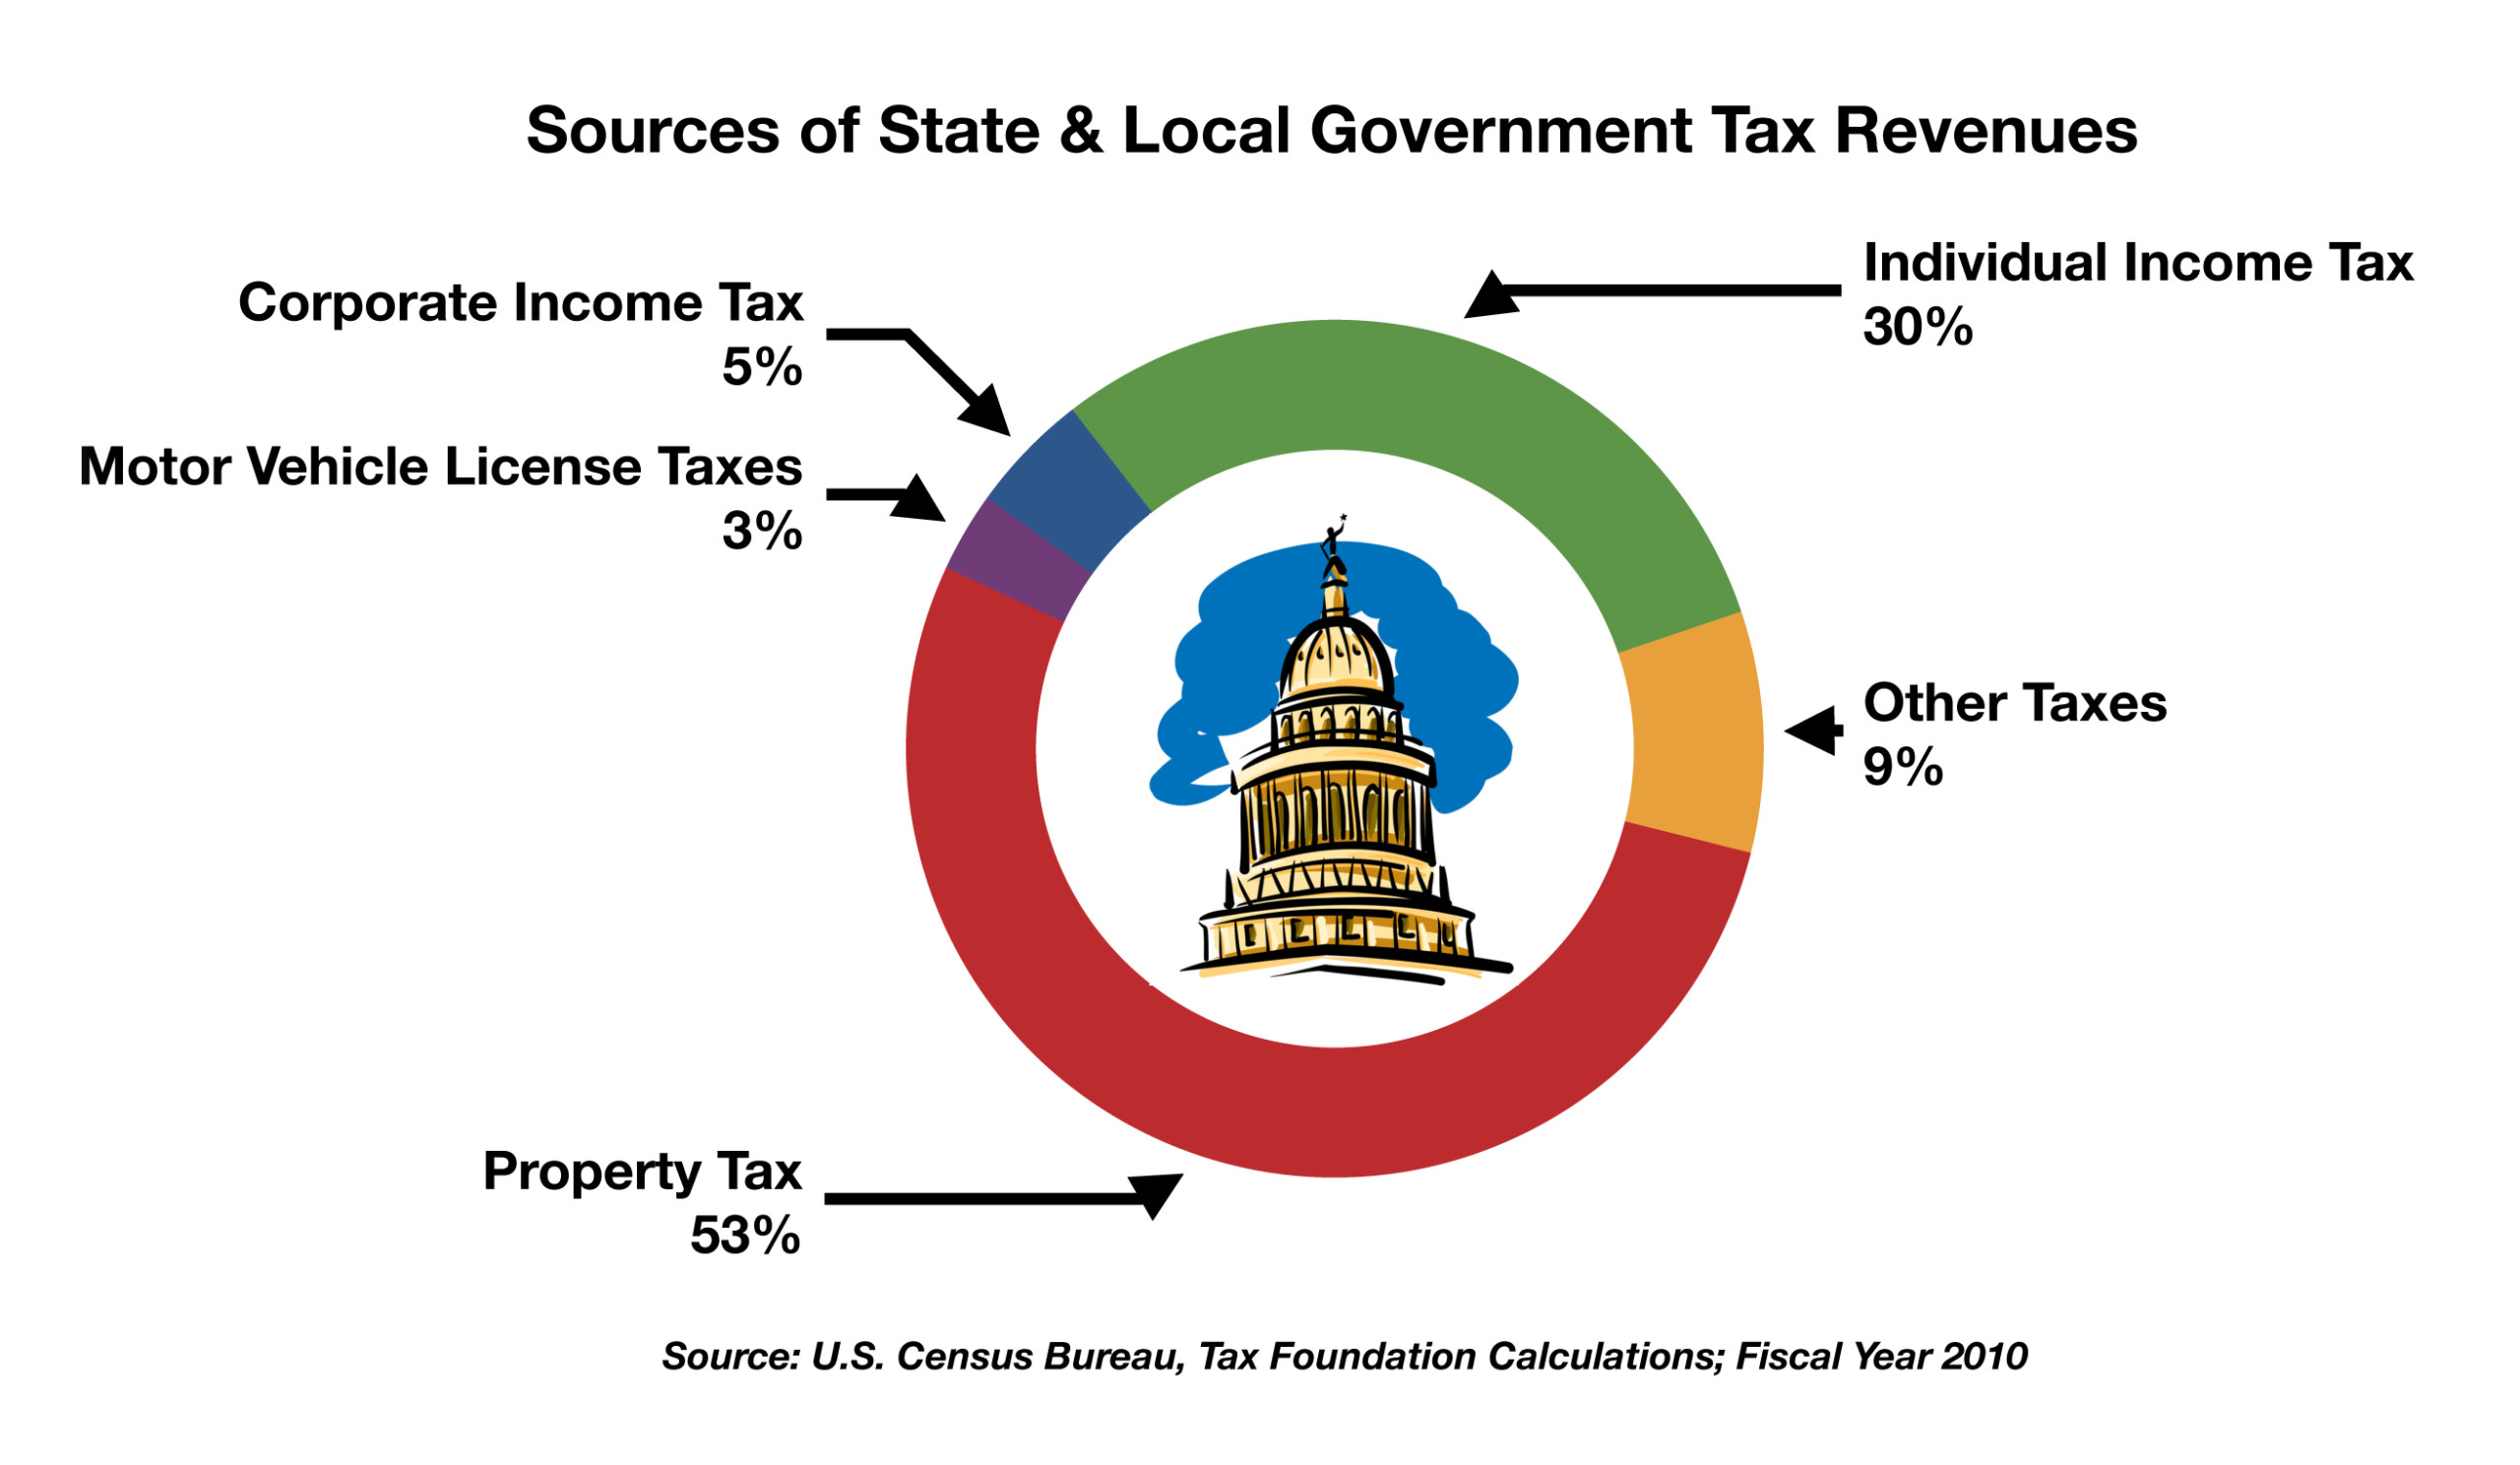
States and local government entities are struggling with a dramatic and rapid drop in tax revenues following business closures and quarantines that were set into place nearly three months ago. Stay at home mandates forced consumers to abandon retail shopping, dining out, and visiting hair salons leading numerous small businesses to close doors and layoff employees. The result has been a historical increase in unemployment leaving states with billions of dollars lost in payroll and income taxes.

The dramatic loss of jobs has also led to mortgages and property taxes not being paid as homeowners struggle to meet ends. Data collected by the U.S. Census Bureau and the Tax Foundation identify that over 50 percent of state and local government revenues have come from property taxes over the past decade. Individual income taxes are significant, representing 30% of tax revenues while corporate income taxes make up roughly 5%. That’s why the dramatic increase in unemployment is so critical to state and local economies. (Sources: U.S. Census Bureau, The Tax Foundation)

Low Rates Supplement Economy – Fixed Income Update

Interest rates held steady in May, with the benchmark 10-year Treasury bond yielding 0.65% at the end of May. The continued low-rate environment is helping to sustain certain industries in the form of low loan rates, such as for autos and homes. Talk of negative rates in the U.S. became more commonplace as other developed economies continued to drive their rates to near zero and below with the objective of stimulating economic activity. The Fed chair reiterated the central bank’s stance on negative rates, stating that it was not a target for the time being. The Fed is opposed to negative rates because of the detrimental effects it imposes on money market funds, government funding calculations and banks.

Investment grade bond issuance surpassed $1 trillion worth of new debt since the beginning of the year, an amount that wasn’t reached last year until November. The Fed’s announcement to purchase $750 billion of corporate debt as part of its stimulus program has stimulated new activity as demand has increased. (Sources: Treasury Dept., Federal Reserve Bank)

Market Returns: All data is indicative of total return which includes capital gain/loss and reinvested dividends for noted period. Index data sources; MSCI, DJ-UBSCI, WTI, IDC, S&P. The information provided is believed to be reliable, but its accuracy or completeness is not warranted. This material is not intended as an offer or solicitation for the purchase or sale of any stock, bond, mutual fund, or any other financial instrument. The views and strategies discussed herein may not be appropriate and/or suitable for all investors. This material is meant solely for informational purposes, and is not intended to suffice as any type of accounting, legal, tax, or estate planning advice. Any and all forecasts mentioned are for illustrative purposes only and should not be interpreted as investment recommendations.