Ocean Park Capital Management

2503 Main Street

Santa Monica, CA 90405

Main: 310.392.7300

Daily Performance Line:  310.281.8577

April 2022
Market Update
(all values as of 04.30.2024)

Stock Indices:

Dow Jones 37,815
S&P 500 5,035
Nasdaq 15,657

Bond Sector Yields:

2 Yr Treasury 5.04%
10 Yr Treasury 4.69%
10 Yr Municipal 2.80%
High Yield 7.99%

YTD Market Returns:

Dow Jones 0.34%
S&P 500 5.57%
Nasdaq 4.31%
MSCI-EAFE 1.98%
MSCI-Europe 2.05%
MSCI-Pacific 1.82%
MSCI-Emg Mkt 2.17%
 
US Agg Bond 0.50%
US Corp Bond 0.56%
US Gov’t Bond 0.48%

Commodity Prices:

Gold 2,297
Silver 26.58
Oil (WTI) 81.13

Currencies:

Dollar / Euro 1.07
Dollar / Pound 1.25
Yen / Dollar 156.66
Canadian /Dollar 0.79
 

Portfolio Overview

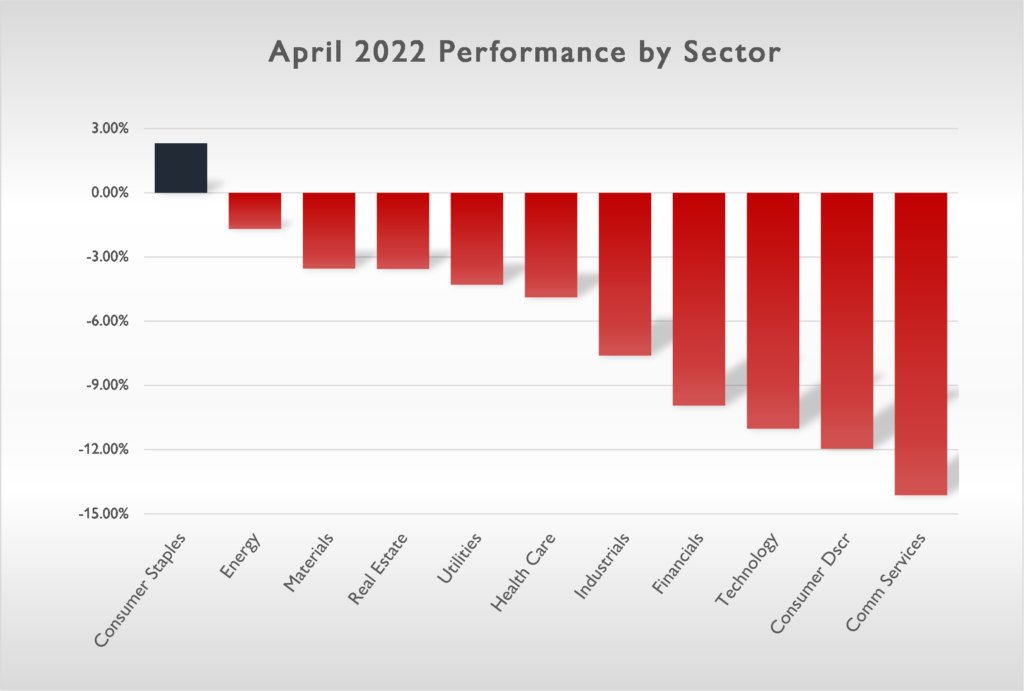
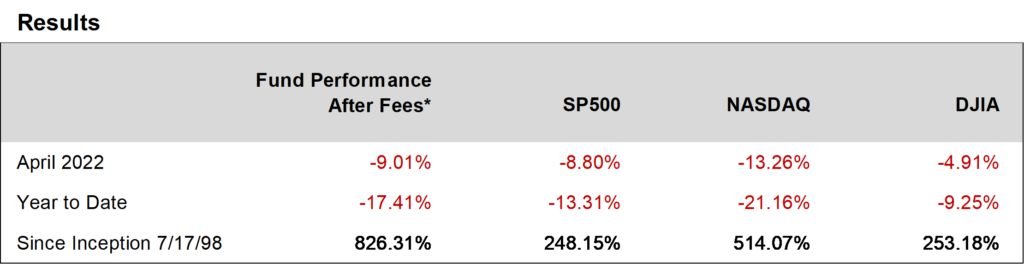
Ocean Park Investors Fund fell 9.01%* in April, while the S&P 500 fell 8.8% and the NASDAQ Composite fell 13.26%.  High inflation, interest rate hikes, slowing economic growth, the war in Ukraine, and Covid shutdowns in China formed a perfect storm that swamped markets.  Consumer and technology stocks, which have provided the greatest long-term gains for the portfolio, were particularly hard-hit.

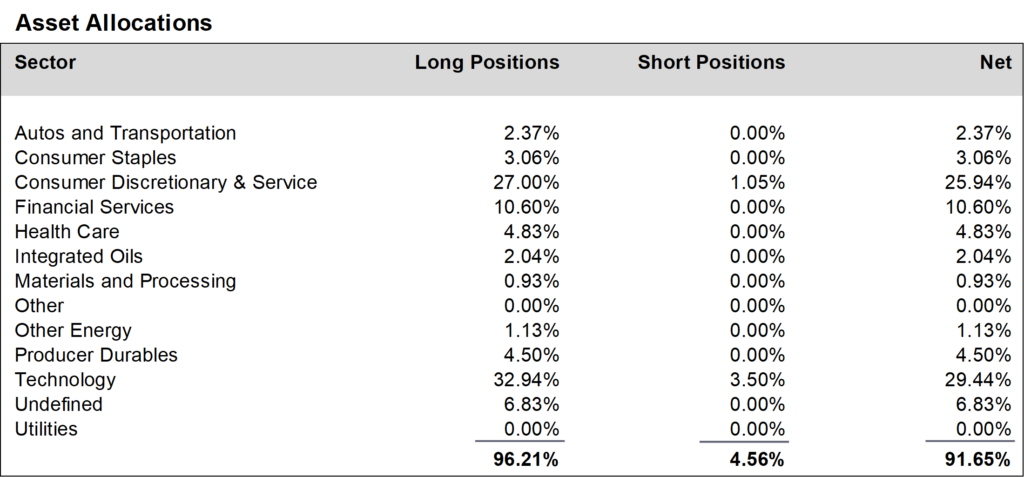
During April, we reduced positions in the technology sector and the consumer discretionary and service sector and increased exposure to the SPY ETF.  More significantly, during the decline we maintained our 92% net long exposure, unchanged from March.  We recognize that the downturn in the market is painful.  However, we view it as transitory and therefore believe it is important to stick to our discipline of identifying stocks with better-than-expected earnings potential which have historically generated strong returns over the long run.


Daily updates on our activity are available on our Results Line, at 310-281-8577, and current information is also maintained on our website at www.oceanparkcapital.com. To gain access to the site enter password opcap.

*These results are pro forma. Actual results for most investors will vary. See additional disclosures on page 4. Past performance does not guarantee future results.

 
Equity Overview

Equity Overview

All sectors declined except consumer staples.  All investment styles (e.g. value, growth, momentum, etc.) declined except volatility plays, as the S&P 500 moved more than 1% on 10 of 20 trading days.  Growth stocks bore the brunt of the downturn as they sustained double-digit losses at all capitalization levels.

Notwithstanding stock price performance, first quarter earnings reported in April were strong.  With 55% of S&P 500 companies reporting, 80% beat consensus earnings expectations and 72% beat consensus revenue expectations (in both cases, above the five-year average but below the one-year average).  However, the market rewarded beats less than usual and punished misses more severely.


Macro Overview

Macro Overview

Economic data reported in April was mixed.  Employment was strong as U.S. employers added 431,000 jobs and the unemployment rate fell to 3.6%.  Manufacturing and durable goods orders were generally positive, and consumer sentiment improved.  But inflation continued unabated as the Consumer Price Index rose 8.5% year-over-year, the highest increase since 1981.  The housing market was lackluster as rising interest rates inhibited sales.  And the Commerce Department reported that first quarter GDP declined 1.4%, an unwelcome surprise as analyst consensus called for GDP to be unchanged.

The war in Ukraine raged on.  While Ukraine repelled Russia’s attempt to capture the capital Kyiv in central Ukraine, forcing Russia to retreat and regroup in the east, both sides now face the prospect of a grinding conflict with no clear path to victory.  Meanwhile the disruption to oil supplies has severely reoriented pricing, with $100 per barrel the apparent new benchmark.  And the loss of grain reserves now threatens famine in less advantaged countries such as Ethiopia which rely on Ukraine for most of their supply.

The reappearance of Covid in China represents a new challenge to the world economy.  The government’s “zero Covid” response has shut down cities large and small, most notably Shanghai with a population of 23,000,000, causing factory closures across a range of industries including microchips. The impact on the global supply chain is serious, and is causing companies to reassess reliance on China for manufacturing.  One notable example:  Apple sources 90% of its products in China and is exploring a shift to more production in India and Vietnam.


Additional Disclosures

Additional Disclosures

Performance data for OPI reflect the reinvestment of dividends and other earnings on the fund’s assets.  Performance data for the major indices reflect only changes in the value of those indices, and would be higher if dividends were included. However, the index data do not reflect fees that would be paid to index fund managers and transaction costs that would be incurred when their component stocks are bought or sold, while OPI’s data do reflect quarterly fees and expenses incurred by the fund.  The information provided is believed to be reliable, but its accuracy or completeness is not warranted. This material is not intended as an offer or solicitation for the purchase or sale of any stock, bond, mutual fund, or any other financial instrument. The views and strategies discussed herein may not be appropriate and/or suitable for all investors. This material is meant solely for informational purposes, and is not intended to suffice as any type of accounting, legal, tax, or estate planning advice. Any and all forecasts mentioned are for illustrative purposes only and should not be interpreted as investment recommendations.