Ocean Park Capital Management
2503 Main Street
Santa Monica, CA 90405
Main: 310.392.7300
Daily Performance Line: 310.281.8577
Dow Jones | 40,842 |
S&P 500 | 5,522 |
Nasdaq | 17,599 |
2 Yr Treasury | 4.29% |
10 Yr Treasury | 4.09% |
10 Yr Municipal | 2.78% |
High Yield | 7.30% |
Dow Jones | 8.37% |
S&P 500 | 15.78% |
Nasdaq | 17.24% |
MSCI-EAFE | 6.50% |
MSCI-Europe | 5.88% |
MSCI-Pacific | 7.62% |
MSCI-Emg Mkt | 6.26% |
US Agg Bond | 2.03% |
US Corp Bond | 2.16% |
US Gov’t Bond | 1.92% |
Gold | 2,491 |
Silver | 29.22 |
Oil (WTI) | 78.50 |
Dollar / Euro | 1.08 |
Dollar / Pound | 1.28 |
Yen / Dollar | 154.01 |
Canadian /Dollar | 0.72 |
Ocean Park Investors Fund fell 1.59%* in April, while the S&P 500 rose 1.46% and the NASDAQ Composite rose 0.04%. Reversing the trend in the first quarter, value stocks outperformed growth. Semiconductor stocks pulled back in April (the semiconductor ETF SOXX declined 7.3%), also impacting our monthly performance.
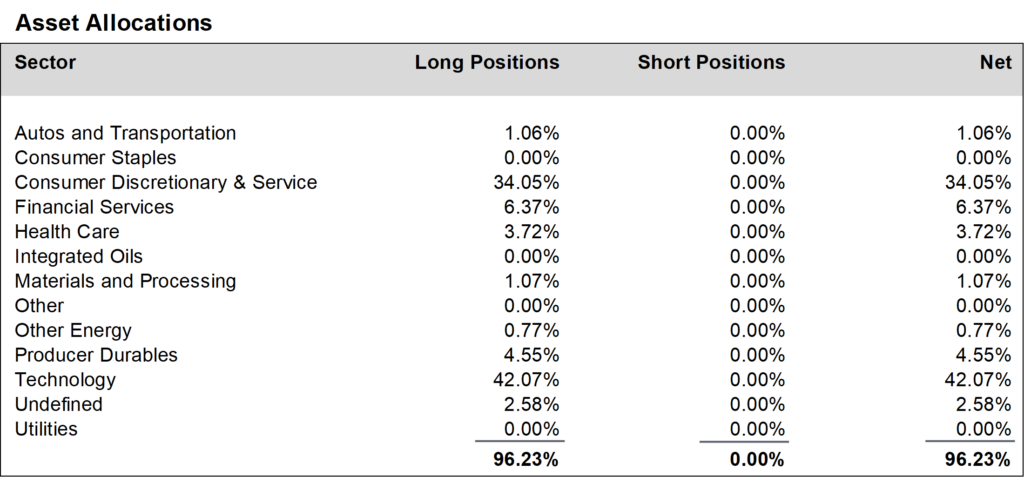
During April, we increased positions in the technology sector and reduced positions in the financial services sector and the autos and transportation sector. We finished the month at about 96% net long, unchanged from March.
Daily updates on our activity are available on our Results Line, at 310-281-8577, and current information is also maintained on our website at www.oceanparkcapital.com. To gain access to the site enter password opcap.
*These results are pro forma. Actual results for most investors will vary. See additional disclosures on page 4. Past performance does not guarantee future results.
Equity Overview
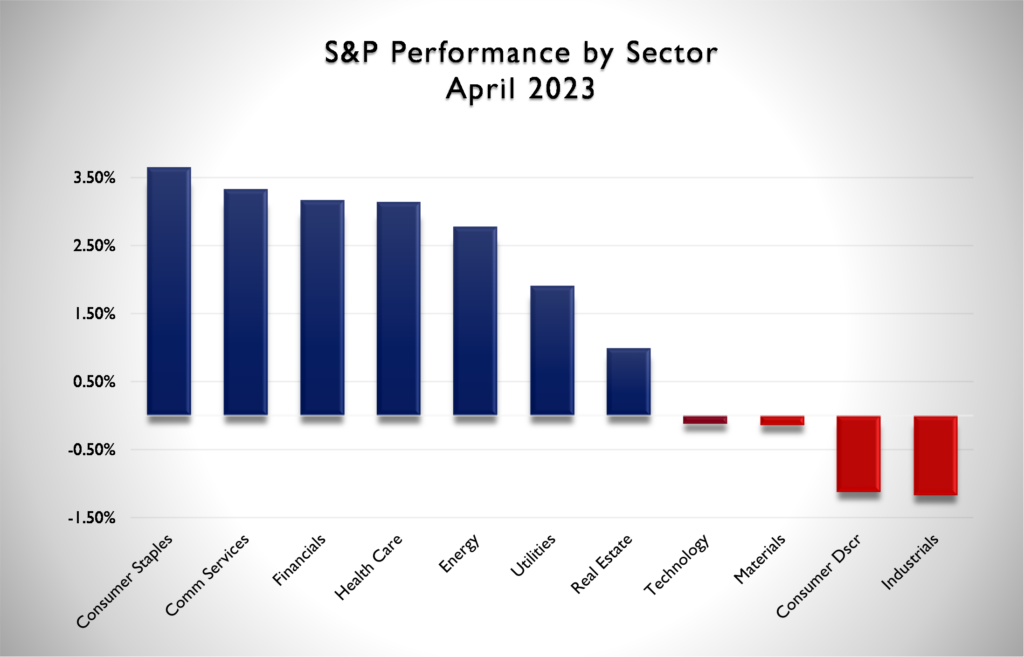
Seven of eleven sectors in the S&P 500 rose in April, with consumer staples the best gainer and industrials the worst loser. Volatility was light, as the S&P 500 moved more than 1% on only 3 of 20 trading days.
First quarter earnings reported in April were strong. With 53% of S&P 500 companies reporting, 79% beat consensus earnings expectations and 74% beat consensus revenue expectations–in both cases, above the one-year and five-year averages. However, the market rewarded beats less than usual and punished misses more severely.
Notwithstanding solid gains in stock prices so far this year, the forward 12-month price/earnings ratio is a reasonable 18.1, still below the 5-year average of 18.5.
The banking crisis which began with the failure of Silicon Valley Bank and two others in March reached a climax in April with the collapse of First Republic Bank, the 14th-largest commercial bank in the U.S. With assets of $229-billion, First Republic was the second-largest bank failure in U.S. history. Once again, regulators acted swiftly to avoid contagion. In the last weekend of the month they engineered a takeover by JPMorgan Chase whose CEO Jamie Dimon announced that “this part of the crisis is over.” That prediction seemed correct as other midsize banks reporting first quarter earnings demonstrated that deposits had stabilized and profits remained healthy.
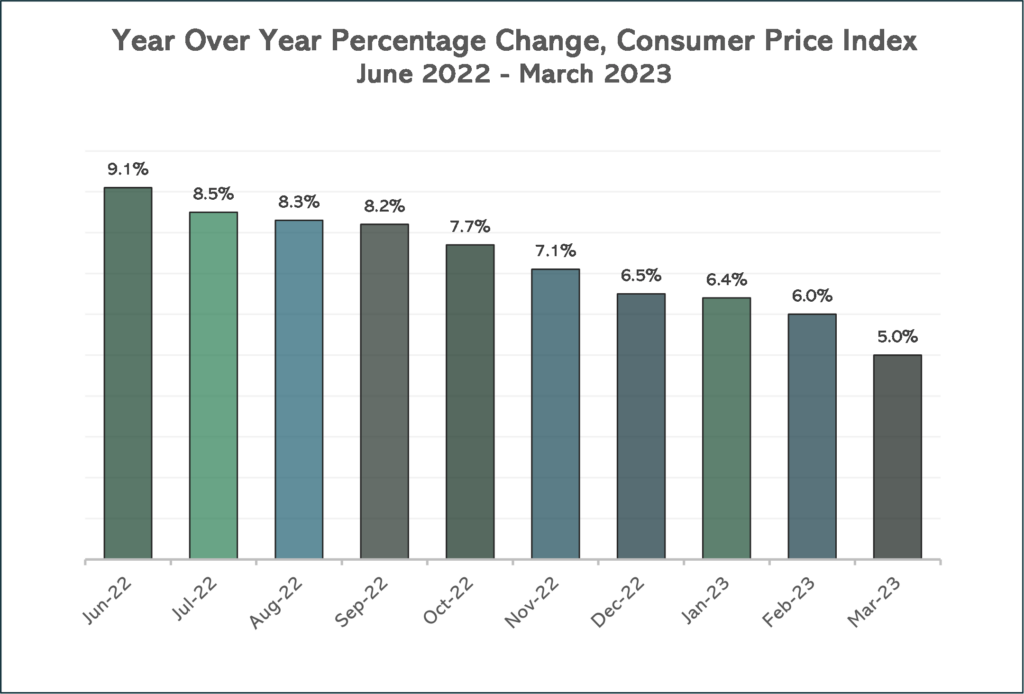
Consumer prices reported in April rose 5.0% annually, the lowest level in two years, continuing the decline from a peak of 9.1% last June.
In its initial report, the Commerce Department estimated that 1Q2023 GDP rose at an annual rate of 1.1%. This was lower than the 2.6% increase in 4Q2022 but reflected a third consecutive quarter of growth after declines in the first two quarters of 2022. Nonetheless, prospects for further growth this year were dampened with the release of the minutes of the March meeting of the Fed. Those minutes indicate that the Fed has now come around to the consensus view of economists that there will be a mild recession later this year.
Performance data for OPI reflect the reinvestment of dividends and other earnings on the fund’s assets. Performance data for the major indices reflect only changes in the value of those indices, and would be higher if dividends were included. However, the index data do not reflect fees that would be paid to index fund managers and transaction costs that would be incurred when their component stocks are bought or sold, while OPI’s data do reflect quarterly fees and expenses incurred by the fund. The information provided is believed to be reliable, but its accuracy or completeness is not warranted. This material is not intended as an offer or solicitation for the purchase or sale of any stock, bond, mutual fund, or any other financial instrument. The views and strategies discussed herein may not be appropriate and/or suitable for all investors. This material is meant solely for informational purposes, and is not intended to suffice as any type of accounting, legal, tax, or estate planning advice. Any and all forecasts mentioned are for illustrative purposes only and should not be interpreted as investment recommendations.