Joseph Schw arz, CFA 612.355.4365
Stephen Dygos, CFP® 612.355.4364
Benjamin Wheeler, CFP® 612.355.4363
Paul Wilson 612.355.4366
www.sdwia.com
Stock Indices:
| Dow Jones | 42,270 |
| S&P 500 | 5,911 |
| Nasdaq | 19,113 |
Bond Sector Yields:
| 2 Yr Treasury | 3.89% |
| 10 Yr Treasury | 4.41% |
| 10 Yr Municipal | 3.31% |
| High Yield | 7.26% |
YTD Market Returns:
| Dow Jones | -0.64% |
| S&P 500 | 0.51% |
| Nasdaq | -1.02% |
| MSCI-EAFE | 17.30% |
| MSCI-Europe | 21.20% |
| MSCI-Pacific | 10.50% |
| MSCI-Emg Mkt | 8.90% |
| US Agg Bond | 2.45% |
| US Corp Bond | 2.26% |
| US Gov’t Bond | 2.44% |
Commodity Prices:
| Gold | 3,313 |
| Silver | 33.07 |
| Oil (WTI) | 60.79 |
Currencies:
| Dollar / Euro | 1.13 |
| Dollar / Pound | 1.34 |
| Yen / Dollar | 144.85 |
| Canadian /Dollar | 0.72 |
April 2019
Macro Overview
A change in the Federal Reserve’s stance on the direction of interest rates helped buoy equity and bond prices higher in March, allowing U.S. equity indices to post the strongest first quarter in nearly ten years.
The Federal Reserve scaled back its growth expectations for the U.S. economy and announced that it would hold rates steady with no additional rate increases this year. Economists interpreted the comments as a somber assessment of economic expansion, yet positively received by the equity and fixed income markets. The Fed mentioned trade disputes, slowing growth in China and Europe, and possible spillovers from Britain’s exit from the European Union were factors.
Short-term bond yields rose above longer term bond yields in March creating what is known in the fixed income sector as an inverted yield curve. Normally, short-term yields are lower than longer term yields, resulting in a normal yield curve. A persistent inverted yield curve would become more concerning should it linger for several quarters.
Concerns surrounding economic momentum in Europe became more prevalent as Europe’s central bank, the ECB, signaled that it would maintain interest rates below zero longer than anticipated. Slower growth in both exports and imports have been implying a slowdown throughout the EU, which is comprised of 28 European countries. The pending outcome on how and when Britain finally exits the EU is also adding duress to Britain’s trading and business partners all over Europe.
Chinese government data revealed that exports heading to other countries worldwide fell over 20% in the past year. Data also showed that imports had fallen into China, realizing that Chinese consumers were scaling back demand from prior months.
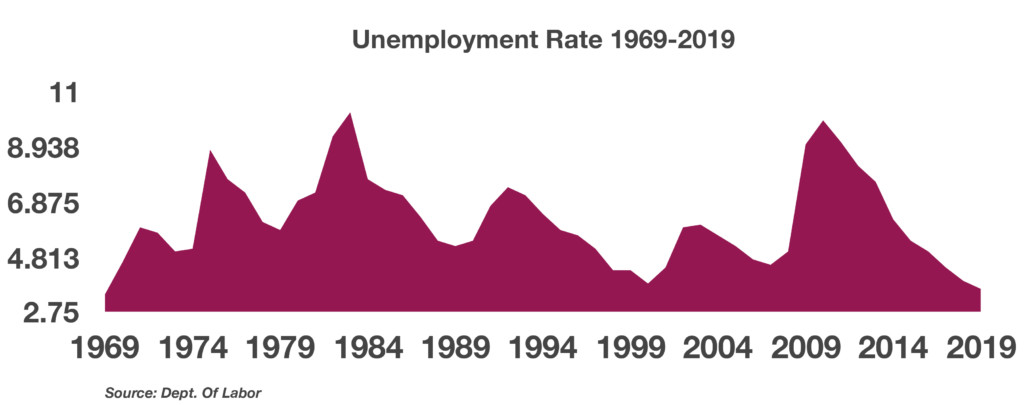
The most recent jobs report released by the Department of Labor is validating a gradual rise in wages. Concurrently, the unemployment rate fell to 3.8%, pushing wages higher as skilled workers become less available.
Outstanding student loans nationwide now stand at $1.5 trillion, the largest amount of debt ever incurred by students. As the amount of debt has risen, so have delinquencies, surging to over $166 billion, according to calculations by the Federal Reserve Bank of New York.
Congressional leaders this past month are considering legislation that would repeal the current age cap of 70.5 for contributing to IRAs as well as increase the required minimum distribution age for retirement accounts from 70.5 to 72. Such legislation, if passed, would be the most significant changes to retirement plans since 2006.
Falling interest rates since the beginning of the year have spurred an increase in mortgage loan activity which bodes well for both refinancing and housing sales activity.
Sources: Federal Reserve, Dept. of Labor, IRS, Treasury Dept., ECB
Technology & Financials Lead In April – Equity Update
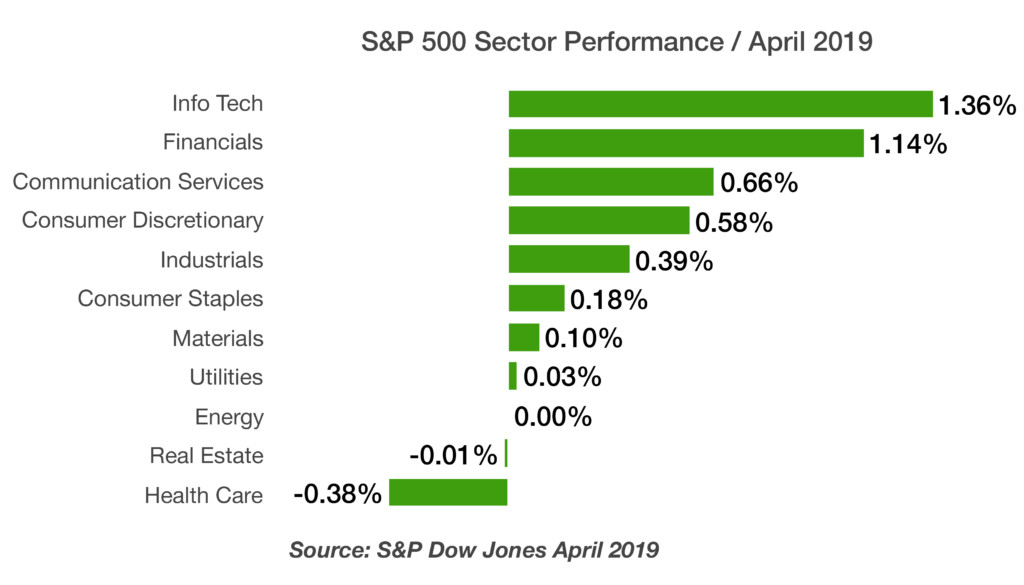
Domestic and foreign equity indices rose in April as rates stabilized and earnings for most companies were as expected or better. Some analysts were perplexed as the leading sectors in April were information technologies and financials, contributing over half of the S&P 500 Index 4.05% return for April. Earnings and optimism surrounding the trade discussions helped elevate shares across all sectors.
Optimistically, even though equity analysts are expecting a slow down in corporate earnings, they are not seeing a slowdown in revenue growth. This is interpreted as underlying economic growth, which may eventually fuel an increase in earnings.
The S&P 500 Index at the end of April was trading at roughly 17 times forward earnings, where it was at the peak in September 2018. A rapid rise in equity and fixed income prices since the steep drop in the fall of 2018, was unexpected by many.
Sources: S&P, Bloomberg, Reuters
Rates Remain Stable – Fixed Income Update
Rates stabilized in April as government and corporate sectors saw a gradual increase in yields. Analysts and economists view a slight increase in rates following a sharp decrease in yields, as a form of stabilization in the fixed income markets. The Fed consoled markets with a hold-and-wait stance as it announced no change in short-term rates.
Deflation and stagnate growth remains an issue validated by rates at near zero or below in Japan and Germany, two primary global economic barometers. Such an environment continues to make U.S. government bond yields attractive relative to other developed nations’ debt.
The rate for a conforming 30-year mortgage fell to 4.14% in April, down from 4.55% in April of 2018, which may bode well for the housing market heading into the summer selling season. The difference in rates from a year ago is equal to a mortgage payment reduction of roughly $75 per month on a $307,700, 30-year mortgage, which is the average sales price for a home nationwide as of this past month.
Sources: U.S. Treasury, Federal Reserve, Bloomberg
45% of Americans Pay No Federal Income Tax – Fiscal Policy
Disparity of income has been a preponderate subject for politicians and activist groups for sometime, yet in the end, it’s those that earn the higher incomes that pay for the majority of taxes.
An estimated 76.4 million Americans, identified as households, paid no federal income tax for tax 2018. The non-partisan, non-profit tax group known as The Tax Policy Center released income tax data it analyzed for 2018 and found that nearly half, about 44.4% of American households, paid no federal income tax last year. The Tax Policy Center estimates that the number of Americans that did not pay income tax for tax year 2018 increased from 72.6 million in 2016, before the Tax Cuts & Jobs Act became effective.
Generous tax credits and low tax brackets for low-income earners allow minimal to no federal tax payments. The Tax Policy Center did find that these lower income households did pay their share of state, local, property, sales, and excise taxes.
According to the data, the top 0.1% of taxpayers pay the equivalent of 39.2% of all taxes while the bottom 20% pay no taxes and receive tax refunds in the form of refundable tax credits. The ultra wealthy, also know as the top 1% of taxpayers, with annual incomes of about $2 million, pay about 40% of all of the federal income taxes in the U.S.
Source: Tax Policy Center/Washington D.C.
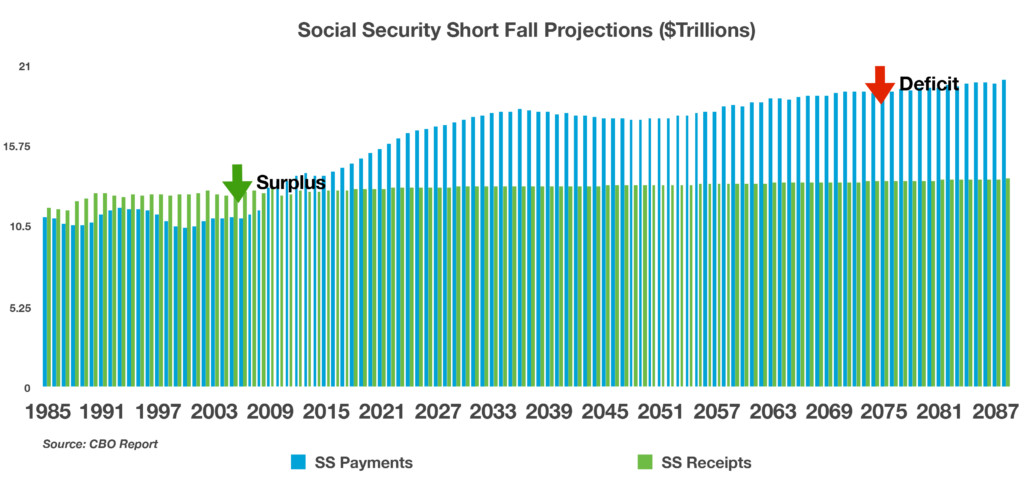
Social Security Falls Short On Projections – Retirement Planning
A U.S. Government report compiled and released by the Government Accountability Office (GAO) found that 48 percent of individuals 55 and older had no retirement savings whatsoever. Statistics like this are where the concept of Social Security originated from.
The establishment of Social Security occurred on August 14, 1935, when President Roosevelt signed the Social Security Act into law. Since then, Social Security has provided millions of Americans with benefit payments. Over the decades, Americans have become increasingly more dependent on Social Security payments; however, for some Americans it may not be enough to rely on Social Security alone.
As of April 2019, over 63 million Americans received Social Security benefit payments, with over 40 million age 65 or older. The Social Security Administration estimates that Americans received over $989 billion in Social Security benefit payments in 2018.
Unfortunately, Social Security is a major source of income for many of the elderly, where nine out of ten retirees 65 years of age and older receive benefit payments representing an average of 41% of their income.
In 1940, the life expectancy of a 65-year old was 14 years, today it’s about 20 years. By 2036 there will be almost twice as many older Americans eligible for benefits as today, from 41.9 million to 78.1 million.
Social Security costs will exceed its income in 2020 for the first time since 1982, forcing the program to dip into it’s trust fund, which is currently just under $3 trillion. Social Security is funded by two trust funds, one for retiree benefits and another for disability benefits. Disability applications have actually been declining since 2010, with a decreasing number of workers receiving disability benefits since 2014.
The latest annual report issued by the trustees of Social Security and Medicare revealed that by 2034, the program’s trust fund will be depleted. Depletion means that Social Security recipients will no longer be receiving full scheduled benefits. Recipients would receive about three-quarters of their scheduled benefits after 2034. Congress can eventually act to fortify the program’s finances, but it may be years before it actually takes effect and funds.
Social Security’s largest costs are attributable to Medicare, which represents over 76% of Social Security benefits. The report also mentioned that Medicare’s hospital insurance fund would be depleted in 2026. The trustees noted that the aging population of the country has placed additional pressure on both the Social Security and Medicare programs. A decade ago, roughly 12% of Americans were age 65 or older, today 16% of Americans have already surpassed 65, the eligibility age for Medicare.
The Social Security Administration considers various factors in projecting its estimates, including fertility, immigration, wages, health, and economic growth. A recent drop in U.S. birthrates along with stagnant wages has placed additional burden on the viability of future benefit payments.
Sources: https://www.ssa.gov/oact/TR/2019/index.html