The thrill is gone: Bitcoin fizzles
Source: WorldCoinIndex
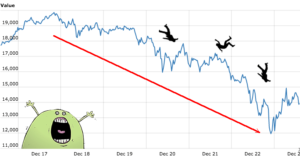
Bitcoin has dropped dramatically from its highs falling from nearly $20,000 to less than $7,000 in just a few months. Further trouble may lie ahead as Bitcoin has evolved into a “contango” market, which means the assets futures contracts are trading at a premium to its spot price. To illustrate: In late March, bitcoin on the Coinbase exchange was trading near $7,898 while the CBOE bitcoin futures contracts were trading at $ 7,980. There is more.
Twitter, Google and Facebook recently announced it would ban cryptocurrency ads as scrutiny continues to accelerate. The crypto- craze – coupled with the flood of bad actors angling to score easy profits – has captured the attention of regulators who are grappling with how to treat the space. Another sign the bubble has burst is the drop in internet searches. Research by Hitwise monitor revealed that the UK searches for bitcoin have fallen by 61% this year compared to the end of 2017 when interest in Bitcoin was peaking (along with its Value)
Lastly, the well-known NYU economist, Nouriel Roubini, recently blasted bitcoin fanatics as “suckers”, opining that the underlying technology is “bull —t”. On a panel at the Milken Institute global conference recently, Roubini called blockchain technology a “glorified excel spreadsheet” reminding us that cryptocurrency holders still need to go through centralized exchanges to clear their transactions. “This was a bubble, the ones who arrived late to the party are the suckers” While many still feel there is promise for Bitcoin and its underlying technology blockchain, the initial thrill is certainly gone.
Estimating the (true) cost of retirement or semi-retirement: Retirement income
In estimating how much we need to retire or semi-retire, the financial media feeds us “rules of thumb” and generic replacements rates. We often hear that we will need to replace 70% or 80% of our pre-retirement income and we will need an annual increase for inflation for some fixed period, perhaps 30 years. How reliable is this advice?
A recent study from Morningstar revealed that the actual replacement ratio is likely to vary considerably from household to household – from under 54% to over 87%! Further, expenditures do not, on average, increase by inflation or by some static percentage. The actual “spending curve” of a retiree household, varies significantly by total consumption and spending levels. The takeaway from this research is that the cost of retirement is highly personalized based on each household’s unique facts and circumstances, and it is most likely to be lower than the amounts determined using the traditional methods.
In our practice, we use a special worksheet, to estimate our pre- and post-retirement expenses in writing. Categories include: Housing, Food, Transportation, Personal care, healthcare and “other”. Healthcare includes Medicare-related (Premiums, surcharges and unreimbursed expenses) as well as custodial care which is not covered by Medicare.
Because of the idiosyncratic nature of retirement spending, generic rules of thumb usually fall short requiring a customized approach.
For the full Morningstar report: Google “estimating the actual cost of your retirement by David Blanchett”
And for specialized retirement spending worksheet: just e-mail evan@completeadvisors.com