Market Summary
Market Update
(all values as of 04.30.2024)

Stock Indices:

Dow Jones 37,815
S&P 500 5,035
Nasdaq 15,657

Bond Sector Yields:

2 Yr Treasury 5.04%
10 Yr Treasury 4.69%
10 Yr Municipal 2.80%
High Yield 7.99%

YTD Market Returns:

Dow Jones 0.34%
S&P 500 5.57%
Nasdaq 4.31%
MSCI-EAFE 1.98%
MSCI-Europe 2.05%
MSCI-Pacific 1.82%
MSCI-Emg Mkt 2.17%
 
US Agg Bond 0.50%
US Corp Bond 0.56%
US Gov’t Bond 0.48%

Commodity Prices:

Gold 2,297
Silver 26.58
Oil (WTI) 81.13

Currencies:

Dollar / Euro 1.07
Dollar / Pound 1.25
Yen / Dollar 156.66
Canadian /Dollar 0.79
 

Macro Overview – January 2020

Financial markets experienced a bountiful decade for stocks and bonds, as a low rate environment fostered by the Federal Reserve and technological advances driven by innovation, catapulted values higher. The 2010 decade was the first decade to avoid a domestic economic recession, with accelerated growth in various sectors including technology, healthcare, and industrials.

A calm in the markets was displaced as tensions in the Middle East spurred concern early in the new year. Global equity, bond and commodity markets reacted to developments in the region that unleashed a wrath of unease.

International markets advanced in 2019, propelled by low interest rates and a gradual global expansion. Robust gains in global equity markets came about against a backdrop of negative rates in parts of the world, traditionally representative of dismal economic dynamics. Historically low rates during the past decade also incentivized governments and companies worldwide to borrow, boosting growth in expansion and capital investments globally.

A proposed phase-one trade deal between the U.S. and China helped elevate market indices this past year, yet many believe that a more substantive agreement won’t materialize as soon as hoped.

The Federal Reserve plans to keep rates where they are, with no expected increases or decreases unless inflationary pressures become prevalent. Inflation has been surprisingly contained even with the unemployment rate at a 50-year low along with a gradual economic expansion. Accommodative monetary policies initiated by the Federal Reserve were instrumental in both equity and fixed income market expansion during the past decade.

The IRS is providing annual inflation adjustments for over 60 tax provisions, including tax rate schedules, exemptions, and standard deductions. Notable increases affecting many tax payers include the standard deduction for married, filing jointly up to $24,800, and 401k contribution limits up to $19,500 for 2020. The tax code allowing for a $3,000 write off for capital losses, such as on stocks and mutual funds, is an unindexed provision that isn’t changing, which hasn’t had an increase since 1977.

The Federal Reserve continued to inject liquidity into the financial markets via buying bonds and actively participating in the repo market at the end of 2019. Many analysts believe that the Fed’s actions have dampened volatility ensued by the recent upheaval in the Middle East.

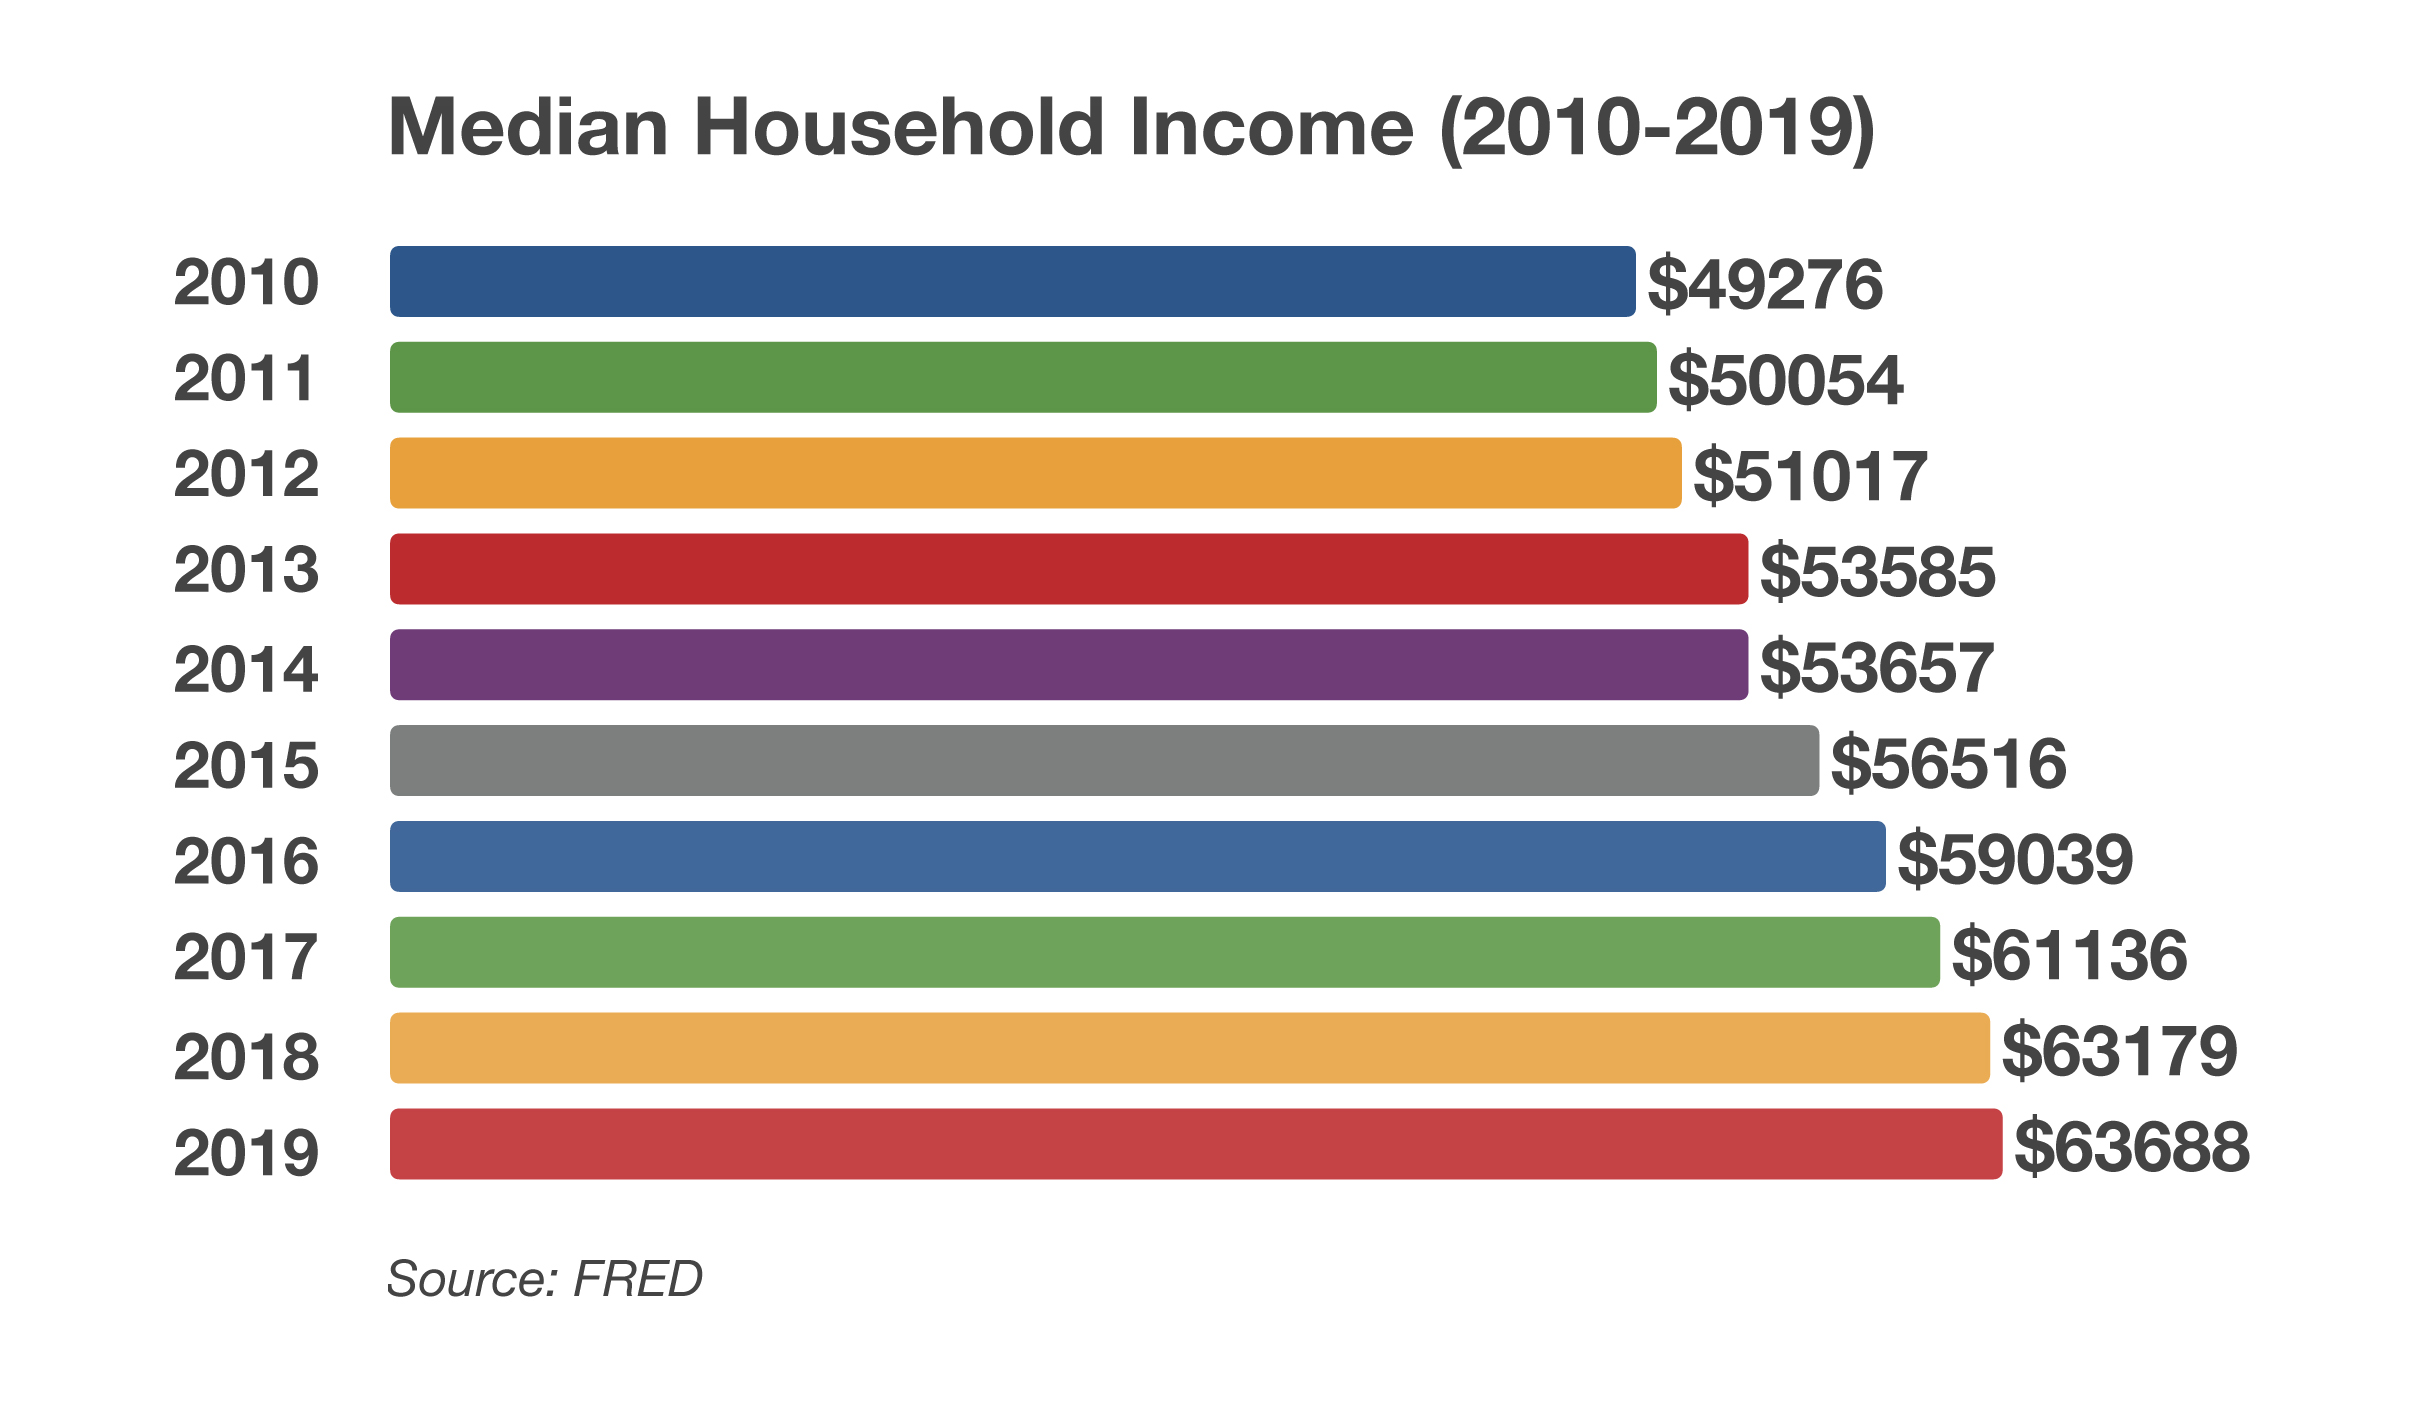
It is expected that federal tax revenues and the federal budget deficit should both benefit from the rise in the equity markets and the continued low rate environment. Sources: IRS, Labor Dept., Federal Reserve, CBO.gov., U.S. Treasury, Tax Policy CenterMedian Household Income Rose Modestly Over Decade – Consumer Income

The recent rise in wages is a fundamental benefit to the economy and financial markets as viewed by economists, although the monetary stimulus that helped accelerate markets over the past decade, has been considered artificial by some economists.


2019 in Numbers

Historically low rates for loans to purchase homes and automobiles have enabled prices to rise without significant increases in loan payments. Modest gains in wages over the past decade have been buffered by the low rate environment. Wages, as measured by the Bureau of Labor Statistics, rose 29% from 2010 to 2019, which equates to roughly 2.9% wage growth per year. The 50-year average for inflation as measure by the Consumer Price Index (CPI) is 4%.

Since wages over the past decade have barely kept up with inflation, wage gains have not been as meaningful for workers. Median household income rose from $49,276 in 2010 to $63,688 in 2019. Inflation is a challenge for workers as wages need to keep up and offset higher living expenses. Fortunately, inflation remained tepid during the past decade, offering minimal increases for most expenses. The concern has been that if inflation should pick up, then a modest rise in wages might not offset higher expenses.

Sources: BLS, Dept. of Labor, Federal Reserve Bank of Minneapolis, FRED

Median Household Income Rose Modestly Over Decade – Consumer Income

The recent rise in wages is a fundamental benefit to the economy and financial markets as viewed by economists, although the monetary stimulus that helped accelerate markets over the past decade, has been considered artificial by some economists.

Historically low rates for loans to purchase homes and automobiles have enabled prices to rise without significant increases in loan payments. Modest gains in wages over the past decade have been buffered by the low rate environment. Wages, as measured by the Bureau of Labor Statistics, rose 29% from 2010 to 2019, which equates to roughly 2.9% wage growth per year. The 50-year average for inflation as measure by the Consumer Price Index (CPI) is 4%.


Higher Home Prices For Decade Made Homes Unaffordable For Some

Since wages over the past decade have barely kept up with inflation, wage gains have not been as meaningful for workers. Median household income rose from $49,276 in 2010 to $63,688 in 2019. Inflation is a challenge for workers as wages need to keep up and offset higher living expenses. Fortunately, inflation remained tepid during the past decade, offering minimal increases for most expenses. The concern has been that if inflation should pick up, then a modest rise in wages might not offset higher expenses.

Sources: BLS, Dept. of Labor, Federal Reserve Bank of Minneapolis, FRED

Higher Home Prices For Decade Made Homes Unaffordable For Some – Housing Market

A decade ago when the financial crisis was still a recent threat, the Federal Reserve embarked on a massive stimulus campaign to fortify and expand the housing market for millions of Americans. The objective was to facilitate low mortgage rates that would make buying a home affordable for everyone. Even though mortgage rates dropped to unimaginably low levels of below 4%, housing became unaffordable for many as housing prices accelerated.
Higher wages tend to garner higher housing prices, allowing workers to pay more for homes and mortgage payments. Yet the modest rise in wages over the past decade wasn’t the key driver of higher housing prices as it was primarily driven by lower mortgage rates.
The past decade saw the average home price, as measured by Freddie Mac, rise 50% from 2010 to 2019, while wages as measured by the Bureau of Labor Statistics rose 29% for the same period.

Sources: Freddie Mac, Bureau of Labor Statistics, Federal Reserve

Growth of Internet Over Decade Varied Among Global Regions – Global Commerce

The 2010 decade witnessed a dramatic increase in internet users worldwide. There were over 4.3 billion users of the internet globally in 2019, that’s nearly 56% of the earth’s total population.

Limitations to internet expansion have primarily been infrastructure related. Remote regions with little or no electricity and connectivity have had the greatest challenges. Ironically, emerging countries with limited infrastructure have seen more internet growth than some developed nations.

Emerging global regions including Asia and the Middle East saw internet users more than double over the decade, as developed regions including North America and Europe saw less growth. Demographics have been an integral component to the internet’s growth, with younger populations, characteristic of emerging countries, being more prominent users. Since an older population is more representative of developed regions, there are less active users in regions such as North America and Europe.

Sources: World Bank, FRE


The Secure Act

The Secure Act – Key Provisions Affecting Retirement & College Savings Plans

Retirement plan legislation passed by Congress effective 2020 includes changes affecting millions of American retirees. The Setting Every Community Up For Retirement Enhancement Act, known as the Secure Act, was signed into law by the president on December 20th. Provisions of the law are intended to facilitate retirement savings for small company workers, offer additional distribution options for 401(k) participants, redraft inherited IRA rules, and increase the required minimum distribution age on IRAs.

Inherited IRAs / Stretch IRAs:  Rules surrounding the distribution of funds from an Inherited IRA have changed by accelerating the distribution and taxation of Inherited IRA funds going to non-spouses. Those most affected by the new rules are retirees with generous IRA balances intending to leave funds to their children and grandchildren. Also referred to as Stretch IRAs, inherited IRAs have allowed IRA beneficiaries to stretch distributions and taxes over an extended period of time.

A current rule that will remain the same is allowing a spouse to rollover their deceased spouse’s IRA to a spousal IRA and take Required Minimum Distributions (RMDs) based on their life expectancy. Inherited IRA rules will be modified by the newly imposed rules affecting non- spousal beneficiaries such as children and grandchildren, the most common types of inherited IRA beneficiaries, who will need to take distributions on the entire balance within 10 years.

A challenge for inherited IRA beneficiaries is the tax implication of accelerated distributions over a much shorter time period. Some beneficiaries may also run the risk of falling into a higher tax bracket, especially if they are working.

Traditional IRAs:  The 70 1/2 age limit for Traditional IRA contributions has been repealed, meaning that as long as you have earned income from working, you may contribute past age 70 1/2. The repeal is applicable to contributions made for tax year 2020 and thereafter, not for tax year 2019.

RMDs:  The required minimum distribution (RMD) age for IRAs has been raised to 72 from 70 1/2. The new RMD age applies to those who turn 70 1/2 after December 31, 2019.

401(k) Plans:  Small businesses are encouraged to set up plans for their employees by increasing the cap under which employees are automatically enrolled in a plan at 15% of wages. This provision is called a safe harbor.

Part-time employees who work either 1,000 hours annually or have three consecutive years with 500 hours of service are eligible for a 401(k) plan.

Annuities will now become an option for employees taking retirement distributions from their 401(k) plan, providing consistent income similar to how pension plans used to decades ago.

529 Plans:  Qualified student loans may be repaid with 529 plan assets up to a maximum of $10,000 annually. Parents may also use 529 assets for the birth or adoption of a child, up to $5,000 per year.

Sources: https://waysandmeans.house.gov/sites/democrats.waysandmeans.house.gov/files/documents/SECURE%20Act%20section%20by%20section


Presidential Candidate Tax Proposals Influence Voter Turnout

Rates Expected To Stay Steady – Global Fixed Income Overview

Fixed income markets are expecting that the Federal Reserve will maintain interest rates steady through 2020, with no anticipated increases or decreases. Performance was positive across all bond sectors in 2019, with yields stabilizing towards the end of the year.
Ending the year at 1.92%, the yield on the 10-year Treasury bond is still the highest yield available among the developed government bond market. Government bond yields in developed economies such as Germany and Japan were still negative at the end of the year.
To shore up liquidity at the end of 2019 to avert a market disruption, as occurred in December 2018, the Fed injected billions of dollars into the repurchase-agreement market, also known as the repo market, and also bought roughly $400 billion of bonds since October 2019. The strategy has been very similar to the Fed’s quantitative easing program enacted during the financial crisis, also known as Q.E.

Sources: Federal Reserve, U.S. Treasury

Presidential Candidate Tax Proposals Influence Voter Turnout – Politics In Review

Taxes and income inequality have become a primary agenda topic for several presidential candidates. Various proposals from the candidates include repealing the Tax & Jobs Act, removing the step-up basis for inherited assets, increasing capital gains tax, imposing a financial transaction tax, and eliminating the tax deduction for mortgage interest on a second home.
Presidential election voter turnout is tracked by the Bipartisan Policy Center, which monitors voter turnout state by state. The 2016 presidential election saw an estimated 55% of the voting age population (VAP) turn out to vote. Who actually turns out to vote can be driven by the candidates’ policies and how it may affect individuals. The number of voters has varied over the years and has always been very difficult to predict.

(Source: Bipartisan Policy Center)


Medigap Plan F Phasing Out

Medigap Plan F Phasing Out – Medicare Benefits Update

Of the ten Medicare supplemental plans, known also as Medigap, the single most popular plan, Plan F, will be eliminated at the end of the year to new subscribers.  Retirees who turn 65 after 2019 will no longer have Plan F as an option. Plan F is the most expensive supplemental option since there are no deductibles, no co-pays and no additional bills after a doctor’s visit.  Plan G has become the next best comprehensive plan after Plan F is phased out to newcomers. Plan G is almost identical to Plan F with the exception of having to pay the Medicare deductible before insurance pays any benefits.
A Medigap policy supplements expenses not covered by Medicare including co-payments, co-insurance, and deductibles. Medigap policies are sold by private insurance companies and vary in pricing and coverage from state to state.  The following are important aspects regarding Medigap policies:
In order to have Medigap coverage, one must have Medicare Part A & Part B.  A Medigap policy only covers one person, not a married couple. So, each person needs their own separate policy.  Any standardized Medigap policy is guaranteed renewable even with a pre-existing condition.
Medigap does not cover prescription drugs. Medicare Part D does offer coverage for prescription drugs.  Medigap policies generally don’t cover long-term care, vision, dental care, hearing aids, eyeglasses, or private nursing.

Sources: medicare.gov

What It Takes To Be In the Top 1% Of Earners – Fiscal Policy

According to the most recent data released by the IRS, it took earnings of $515,371 to be part of the top 1% of earners in 2017. It took an additional 7.2% to crack the 1% mark from the prior year, equal to an additional $37,106 in income.
Of the 138,945,000 individual tax returns filed in 2017, 1,432,952 returns fell into the top 1% category. The top 50% tax earners were, on the other hand, more representative of taxpayers across the country, with an income threshold of $41,740. There were over 71 million taxpayers that fell into the top 50% in 2017.

Source: IRS, www.irs.gov/statistics/soi


Global Growth Expected To Slow

Global Growth Expected To Slow – World Economy

Every year the International Monetary Fund (IMF) releases a report on its outlook for worldwide economic growth. The IMF is an international organization consisting of 189 countries working to foster global financial cooperation. In its most recent report released in October, the IMF noted that the global economy is in a synchronized slowdown with a projected growth rate of 3.4% worldwide in 2020. The subdued projections are a consequence of rising trade barriers, uncertainty surrounding trade and geopolitics, low productivity rates, and strain in the emerging market economies.

The IMF is estimating a 3% growth rate for the global economy in 2019, a drop from 3.6% in 2018. Among those countries expected to see a decline in growth are China, Japan and the United States. China’s forecast is primarily due to trade tensions and a drop in exports. India continues to grow at a favorable rate among both the emerging and developed economies. Its projection of a 7% growth rate for 2020 is greater than all other major emerging and developed economies.

Source: International Monetary Fund

Global Markets Elevate – Equity Review

Domestic equities finished November with gains not seen since the summer. Optimism surrounding U.S.-China trade discussions helped fuel equities higher, with technology, health care, and financials as the leading sectors in November. The absence of volatility, along with the Fed maintaining a steady rate environment, was also a catalyst for equities to climb in November. Stock market volatility, as measured by the VIX Index, dropped to its lowest levels since April. U.S. equity markets have outperformed international equities over the past two years so far. Historically, a lower U.S. dollar has benefited international stocks, as well as help increase exports of U.S. products worldwide.

Sources: U.S. Commerce Department, Bloomberg

Looks Like QE But It’s Not Says The Fed – Fixed Income Overview

The Federal Reserve is slowly re-expanding its balance sheet by currently buying $60 billion of Treasury bills each month. Reminiscent of the Fed’s Quantitative Easing (QE) program, meant to stimulate economic activity, the Fed denies that it is QE, but rather just a buffer for any possible bond market volatility.
Interest rates are believed to have stabilized for the time being, as the Fed has essentially placed a hold on raising and lowering rates until further notice. The yield on the 10 year treasury bond ended November at 1.78%, essentially where it’s been for the past two months.
The presidential race is promoting bond buyers to consider municipal bonds in order to hedge against any possible increase in tax rates. The tax free interest generated by municipal bonds has historically been a benefit for certain investors in the higher tax brackets.

Sources: Federal Reserve

 
What Prices Have Changed The Most?

Bond Yields Stabilize – Fixed Income Overview

The Federal Reserve injected additional amounts of funds into the overnight lending markets, also known as the repo market, in October. The move served to dampen concerns that a repeat of volatility that hit markets in December 2018 would occur again.
The Federal Reserve cut interest rates for the third time this year but signaled that it would not cut them further unless economic growth slowed amid concerns.
Yields on government and corporate bonds remained stable in October as expectations of economic growth and a pause to further rate cuts stabilized bond markets. Bond prices have risen since the beginning of the year, with government and corporate bond yields still hovering near record low levels. Bond prices move in the opposite direction to yields.

Sources: Federal Reserve, U.S. Treasury

What Prices Have Changed The Most – Consumer Markets

Government agencies compile and track prices on a multitude of products from various sources. Dramatic price swings help economists determine who may be influenced and how the overall economy may be affected. Price changes on certain products tend to affect a larger portion of the population more so than other products. Over the past year, the cost of health insurance has climbed over 18%, affecting nearly everyone paying for health coverage. However, the increase in baby food of 5.8% over the same period is limited to younger families across the country. Televisions, dresses, and eggs saw formidable price drops over the past year, affecting a more concentrated group of consumers.

Source: Bureau of Labor Statistics

Social Security Payments Increasing By 1.6% – Retirement Planning

Social Security recipients are due to receive a modest increase in benefit payments payable in 2020. But for many recipients, the increase in payments will go towards higher Medicare costs. The increase will affect over 63 million Americans receiving Social Security benefit payments.
The Social Security Administration announced a 1.6% increase in benefit payments effective in late December 2019 for disability beneficiaries and in January 2020 for retired beneficiaries. The 1.6% increase is slightly less than the increase of 2.8% for 2019.
Many are concerned that the 1.6% increase may not cover expenses that are rising at a faster rate, including other essential items such as food and housing. The establishment of Social Security occurred on August 14, 1935, when President Roosevelt signed the Social Security Act into law. Since then, Social Security has provided millions of Americans with benefit payments. The payments are subject to automatic increases based on inflation, also known as cost-of-living adjustments or COLAs, which have been in effect since 1975. Over the years, recipients have received varying increases depending on the inflation rate.

 
U.S. Agricultural Exports To China Decline

With low current inflation levels, increases in benefit payments have been subdued relative to years with higher inflation.
Over the decades, Americans have become increasingly dependent on Social Security payments, however, for some Americans it may not be enough to rely on Social Security alone. Unfortunately, Social Security is a major source of income for many of the elderly, where nine out of ten retirees 65 years of age and older receive benefit payments representing an average of 41% of their income. Over the years, Social Security benefits have come under more pressure due to the fact that retirees are living longer. In 1940, the life expectancy of a 65-year old was 14 years, today it’s about 20 years.
By 2036, there will be almost twice as many older Americans eligible for benefits as today, from 41.9 million to 78.1 million. There are currently 2.9 workers for each Social Security beneficiary, by 2036 there will be 2.1 workers for every beneficiary.

Source: Social Security Administration, https://www.ssa.gov/news/cola/

U.S. Agricultural Exports To China Decline – Trade Policy Review

China is the largest export market for U.S. agricultural products, with over $28 billion of exports in 2017. Agricultural exports to China have steadily increased over the past few years, with a 700% increase from 2000 to 2017.
Agricultural products exported to China include soybeans, cotton, pork, corn, and wheat. Soybeans account for the single largest agricultural export, representing over 50% of China’s soybean imports in 2017 alone.
Fallout from the trade disputes have recently given other countries the opportunity to capture agricultural market share from the U.S. Agricultural producing countries including Brazil, Australia, Canada, and Ukraine, which have all been able to increase exports to China as U.S. exports have fallen. The risk to U.S. exporters is that these alternate suppliers may take permanent market share away from the U.S.
Demand for U.S. exports may also be affected by slowing global growth. The IMF is estimating a 3% growth rate for the global economy in 2019, a drop from 3.6% in 2018. Among those countries expected to see a decline in growth are China, Japan and the United States. China’s forecast is primarily due to trade tensions and a drop in exports. India continues to grow at a favorable rate among both the emerging and developed economies. Its projection of a 7% growth rate for 2020 is greater than all other major emerging and developed economies.

Sources: U.S. Department of Agriculture


Japanese Exports Fall

Japanese Exports Fall

One of the world’s biggest exporters, Japan, released data that showed a drop in its exports for the 10th consecutive month. Japanese exports include optical lenses, ships, automobiles, and high-end machinery. Two major buyers of Japanese products, China and the United States, saw a decline in demand for Japan’s exports. Data from the Japanese Ministry of Finance revealed a fall of 6.7% in exports to China over the past year and a drop of 7.9% to the U.S. over the same period. Exports from Japan are considered indicative of global growth, since many of the country’s exports are used for manufacturing and capital expansion. Weaker demand from expanding countries may signal a contraction in global growth. In its most recent global economic report, the IMF cited a broad-based global slowdown in manufacturing and global trade. Factors affecting the slowdown include higher tariffs, trade policy uncertainty and a drop in demand for capital goods. Consequently, Japan is directly affected by these dynamics, as the country is a major supplier of capital products and goods worldwide.

Source: IMF, Japanese Ministry of Finance