Dow Jones | 41,563 |
S&P 500 | 5,648 |
Nasdaq | 17,713 |
2 Yr Treasury | 3.91% |
10 Yr Treasury | 3.91% |
10 Yr Municipal | 2.70% |
High Yield | 6.92% |
Dow Jones | 10.28% |
S&P 500 | 18.42% |
Nasdaq | 18.00% |
MSCI-EAFE | 9.72% |
MSCI-Europe | 9.81% |
MSCI-Pacific | 9.34% |
MSCI-Emg Mkt | 7.44% |
US Agg Bond | 3.07% |
US Corp Bond | 3.49% |
US Gov’t Bond | 2.95% |
Gold | 2,535 |
Silver | 29.24 |
Oil (WTI) | 73.65 |
Dollar / Euro | 1.10 |
Dollar / Pound | 1.31 |
Yen / Dollar | 144.79 |
Canadian /Dollar | 0.74 |
Macro Overview
A proposed tariff increase on goods imported from China was delayed from October 1st to October 15th. Tariffs on a number of Chinese goods are scheduled to increase to 30 percent from 25 percent effective on the 15th.
U.S. equity markets marked their best third quarter since 1997, recapturing gains that were lost in the final quarter of 2018. The market’s resilience has allowed stock and bond prices to elevate higher even with the headwinds of trade tensions and recessionary concerns. Meager bond yields worldwide also fueled a gravitation towards stocks as investors sought more attractive yields in the form of dividends.
Domestic bond yields rose in September, climbing back from ultra low levels reached in August. The Fed’s easing rate trend is part of a larger global movement by other central banks to lower rates internationally.
Currency markets reacted to slightly higher U.S. rates in September, sending the U.S. dollar to its strongest levels in over two years. Various factors such as consistent consumer demand and a stable economic environment, relative to other global economies, helped drive the demand for the dollar.
A key inflation indicator, the Consumer Price Index (CPI), moved higher with its fastest annualized growth since 2008. The CPI index, which measures the price of various goods and services such as food, housing, and medical expenses, rose 2.4% over the past year. Medical insurance and healthcare related expenses saw some of the largest increases.
Sources: Commerce Depart., U.S. Treasury, BLS
Stretch IRA Rules May Change – Retirement Planning
Rules surrounding the distribution of funds from an Inherited IRA may change due to new rules being imposed. Those most affected by the new rules are retirees with generous IRA balances intending to leave funds to their children and grandchildren. Known also as Stretch IRAs, which have allowed IRA beneficiaries to stretch distributions and taxes over an extended period of time.
Both the House of Representatives and the Senate have drafted their own versions of the new rules. The House has named the legislation the Secure Act, which stands for the Setting Every Community Up For Retirement Enhancement Act. Both versions essentially accelerate the distribution and taxation of Inherited IRA funds going to non spouses.
A current rule that will remain the same is allowing a spouse to rollover their deceased spouse’s IRA to a spousal IRA and take Required Minimum Distributions (RMDs) based on their life expectancy. Inherited IRA rules will be modified by the newly imposed rules, affecting non spousal beneficiaries such as children and grandchildren, the most common types of inherited IRA beneficiaries.
For years, legislation has allowed inherited IRA beneficiaries to distribute funds over the course of decades based on the beneficiary’s life expectancy. Revised legislation will require inherited IRAs to be distributed entirely within 10 years. The distribution could be taken as intervals, at the end of the period, or whenever desired, as long as the entire account is disbursed within 10 years. Both versions do allow distribution exceptions for minor children, disabled beneficiaries, and beneficiaries not more than 10 years younger than the deceased IRA owner.
A challenge for inherited IRA beneficiaries is the tax implication of accelerated distributions over a much shorter time period. Some beneficiaries may also run the risk of falling into a higher tax bracket especially if they are working. The Senate version allows for a stretch on the first $400,000 of IRA assets with the exceeding balance distributed within 5 years. Both versions would apply to inherited IRAs with the original owner’s death occurring after December 31, 2019.
Sources: https://waysandmeans.house.gov/sites/democrats.waysandmeans.house.gov/files/documents/
SECURE%20Act%20section%20by%20section
Federal Deficit Projections Top $1 Trillion – Fiscal Policy Review
The Congressional Budget Office (CBO) establishes budget forecasts based on various factors that are constantly changing. Among the factors are fiscal policy, economic projections, as well as trade policy initiatives.
Projections are revised on a regular basis by the CBO and may change or be modified contingent on fiscal policy and government outlays such as Social Security and health care expenses.
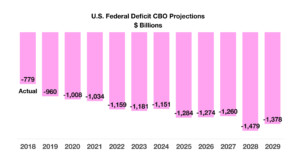
The most recent projections reveal a federal budget deficit exceeding $1 trillion in 2020, an estimate based on current fiscal circumstances and the economic environment.
Projections over the next 10 years show an average annual budget deficit of $1.2 trillion between 2019 and 2029. The estimate represents a deficit of 4.4% to 4.8% of GDP, above the 50-year average. Even though tax revenues are estimated to grow, GDP is expected to expand at a more conservative pace. Current estimates show GDP growing at 2.3% in 2019, yet the CBO projects an average annual GDP growth rate of 1.8% over the next 10 years.
The three largest expense items for the federal government have been and are projected to be Social Security, health care programs, and interest paid on government debt. Rising interest rates may become more of an issue as rates may eventually head higher for government debt, with future debt issuance becoming more expensive for the U.S. as rates slowly rise.
Sources: CBO; Update To The Budget & Economic Outlook 2019-2029
Countries With Highest & Lowest Import Tariffs – International Trade Policy
Some countries impose import duties, also known as tariffs, on certain imports for various reasons. Import duties on products that may hinder or compete with an industry or product produced in that country may have tariffs imposed in order to limit imports that may have negative consequences.
Imports brought into a country at below market prices may be considered dumping, where tariffs can act as a restraint against such tactics meant to gain marketshare via unfair trade practices.
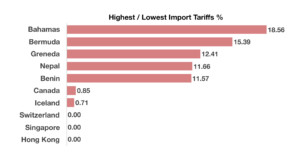
Limited resources and production capabilities may require certain countries to openly import necessary goods and raw materials with no tariffs in order to satisfy the demands of its citizens and industries. Based on data from the World Bank, Switzerland, Singapore, and Hong Kong are among those that impose no tariffs on imported products and materials.
Sources: World Bank; 2016 data, CIAWorldFactBook
Inflation Picks Up – Consumer Trends
A measure of inflation as gauged by the Consumer Price Index (CPI) accelerated by more than forecast over the past year. The CPI, which excludes food and energy, rose 2.4% from a year earlier as reported by the Department of Labor. These statistics are tracked by the Labor Department since they affect all U.S. workers throughout the country. The latest reading of 2.4% may be considered inflationary by some economists.
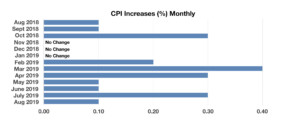
Each month, the Bureau of Labor Statistics compiles and releases its most recent inflation readings. Even though the data fluctuates month to month, economists pay close attention to consistent decreases or increases. A consistent trend with monthly CPI increases so far this year, has been greater than the monthly changes in 2018. CPI data registered no change from November 2018 through January 2019, yet have seen consistent measurable gains thereafter.
Of the various costs tracked and measured, medical and health insurance related costs registered their single largest gains since 2016.
Source: BLS, Labor Department
Equity Markets Advance In The 3rd Quarter – Domestic Equity Update
Despite ongoing trade tensions and concerns about a slowing economy, U.S. equities excelled in the third quarter, with technology, consumer staples, and utilities as the leading sectors for the S&P 500 Index. The energy and health care sectors were the under performers relative to the other 9 sectors.
Equity markets are reacting more sensitively to economic indicators, such as unemployment, manufacturing, and Gross Domestic Production (GDP) data. Earnings growth for U.S. companies is starting to slow for certain sectors, as economic expansion decelerates.
The third quarter revealed that the industrials, materials, and energy sectors lacked relative to consumer staples, utilities, and financials. Economists and analysts examine which sectors are performing relative to others in order to better determine which direction the market might be headed.
Sources: BLS, Bloomberg, Reuters
Rates Edge Up Slightly In September – Fixed Income Overview
Bond yields edged higher in September, rebounding from the lows reached in August. The 10- year Treasury bond yield rose from 1.47% at the beginning of September to 1.68% at the end of the month. The rise in yields affected loan rates as they had just reached lows in August not seen in years.
Additional rate cuts in Europe by the European Central Bank (ECB) pressured bond yields lower in Europe and Asia. Bond markets are eagerly awaiting indications of any further rate reduction in the U.S. by the Fed, perhaps prompted by economic data.
Low mortgage rates continue to fuel home sales nationally, with the rate on a conventional 30- year fixed mortgage at 3.64% at the end of September, down from 4.51% at the beginning of the year.
Sources: FreddieMac, ECB, U.S. Treasury
Bond Yields Continue To Decline – Fixed Income Update
Bond prices continued to escalate in August, causing bond yields across most bond sectors to fall. The bond market has been the primary identifier of recessionary threats for decades, as short-term bond yields rise above longer term bond yields. Long-term bonds have been among one of the best performing asset classes year to date concurrently with equities, an anomaly in the financial markets.
The yield on the 10-year Treasury bond fell to 1.50% in August, its largest monthly yield drop since 2011. The yield on the 30-year Treasury bond fell below 2% in August, confirming dismal economic long-term growth.
The U.S. Treasury is considering the issuance of 100-year Treasury bonds in order to take advantage of the current ultra-low rate environment. Other countries have already taken advantage of the global low rate environment, with Austria, Belgium and Ireland issuing century bonds over the past few years.
Sources: Treasury Department, Eurostat, Bloomberg
Baby Boomers Working Past Retirement – Demographics
This year, the youngest baby boomers are now 55 and the oldest are 73, according to the Bureau of Labor Statistics. As more baby boomers reach retirement, good health and financial obligations are driving more to work longer or find a new job.
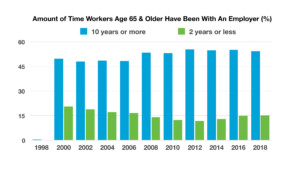
As baby boomers retire, some are finding it necessary to return to work even in their retirement years. Data released by the Labor Department show that about 15% of workers age 65 and older had been with their employer 2 years or less in 2018. Many baby boomers may have worked for the same employer for years, then retire, yet find themselves seeking work thereafter. There hasn’t been a growing trend of retirees doing this yet, but there has been a consistent number.
Roughly 85% of workers age 65 and older have been with the same employer for 10 years or more, a trend that has been in place for years. Some believe that the dynamics of the job market and employers has begun to shift to where workers will spend less time with the same employer.
Source: Bureau of Labor Statistics
U.S. Recessions – Historical Note
Historians and economists claim that there have been 47 recessions in the United States dating back to the Articles of Confederation, which was ratified in 1781. The duration and intensity of each recession has been unique, with various factors affecting economic conditions contingent on current circumstances.
Ironically, the recession during the early 80s from 1980 through 1982 was driven by inflation and rising interest rates creating an expensive and restrictive environment for consumers and businesses. Conversely, economists currently view any probable recession driven by an ultra-low rate environment and minimal inflation, believed to be a result of excessive stimulus created by the Federal Reserve and dismal economic growth projections.
Modern recessions occurring in the 19th century have resulted from financial crises and market driven events, while recessions that occurred in the 1800s were primarily driven by war and the weather due to the dependence on agriculture.
Talk of an upcoming recession in the news has been a focal discussion as low rates and weakening economic indicators create an argument for a recessionary environment. Economists and analysts see recessions as an economic cycle driven by expansions and contractions.
Sources: Federal Reserve; fred.stlouisfed.org/series/JHDUSRGDPB
China No Longer Biggest Trade Partner With U.S. – International Trade
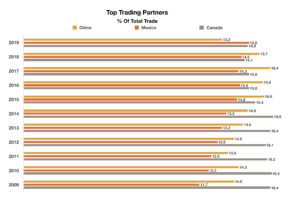
The United States maintains a favorable trading relationship with many countries all over the world, yet only a handful encompass the bulk of all trading activity. For years, Mexico, China and Canada have been the top three trading partners with the United States, sending imports and exports across borders made up of all types of products and materials.
Trade treaties with Mexico and Canada have facilitated trade with the U.S. for years, yet recently imposed tariffs on Chinese imports have reduced trade activity with China and increased activity with Canada and Mexico. Since the imposition of new tariffs with China, some manufacturers and suppliers have shifted their operations to Canada and Mexico in hopes of averting additional tariffs.
Trade data released this past month has validated the effects of the newly imposed tariffs, with China no longer the top trading parter with the United States. Mexico and Canada are now the top trading countries with China, third ahead of Japan. Unknown to many, Mexico and Canada have been top trading partners ahead of China before, with Canada the top trading partner through the 2000s up to 2014. Ten years ago in 2009, China represented 14% of total trading activity with the U.S., reaching 16.4% of all trading in 2017. The latest trade data shows China representing 13.2% of total trade activity, with Mexico and Canada each representing roughly 15% of total trade.
Source: U.S. Commerce Dept., Census.gov3
Argentine Politics Lead To Market / Bond Sell Off – International Finance
A presidential election in Argentina has led to a sell off in the country’s bonds and currency, as fears were stoked that a populist ruling government would negate billions of dollars owed on government debt by foreign holders.
Argentina announced in late August that it would begin the process of reorganizing its government debt, meaning that the country was technically defaulting on its debt obligations. It plans to postpone $7 billion of debt payments on short-term bonds as well as “reprofile” $50 billion of long-term debt owed to foreign investors worldwide. Argentina also plans to delay payment on another $44 billion in loans owed to the International Monetary Fund (IMF).Argentina imposed currency controls in order to stem the flight of capital out of the country as it tries to avoid an escalation towards default. The country is requiring exporters to keep profits in the country rather than converting them to foreign currencies such as the U.S. dollar.
The three primary rating agencies have all lowered their credit rating on Argentina, citing a deepening economic recession and the return of populist policies. Argentina has defaulted on its government debt eight times since 2000, making it one of the riskiest countries to loan to.
Sources: IMF, Bloomberg, www.argentina.gob.ar
U.S. Treasuries Remain Attractive – Global Fixed Income Overview
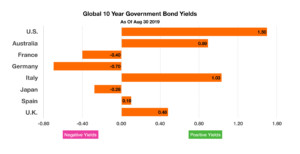
Even as the 10-year Treasury yield fell below 1.5% in August, it is still offering a more attractive yield than most other developed country government bonds. Yields for 10-year government bonds in Germany and Japan yielded -0.69% and -0.27% respectively. Such negative yields mean that investors are basically paying the governments of Germany and Japan to hold on to their funds.
International investors not only pursue the best yields possible, they also seek the safest debt possible. The U.S. continues to offer the most transparent and liquid debt worldwide of any country or company. U.S. Treasury bonds are also held for trading purposes and for currency control. If too many bonds are bought, then lower rates may weaken the currency, a trade strategy utilized by countries to stabilize or alter exports.
Countries whose 10-year government bond yields were below 0% as of the end of August include France, Germany and Japan.
Source: Bloomberg, U.S. Treasury
Volatile Month For Stocks – Equity Overview
Despite the volatility in August, all eleven sectors of the S&P 500 were still positive YTD as of Aug 30th, with the technology, real estate and consumer discretionary sectors leading.
Earnings moved to the forefront of concerns for equities as the effect of Fed rate cuts dissipated with fewer cuts expected. Global growth headwinds along with international debt issues contributed to market uncertainty.
Equity analysts are following three primary market risks influencing U.S. stock prices: effects of trade tensions; slide in earnings estimates; and less Fed rate cuts than anticipated.
Sources: S&P, Bloomberg
Some States Growing Faster Than Rest of the Country – Domestic Economy
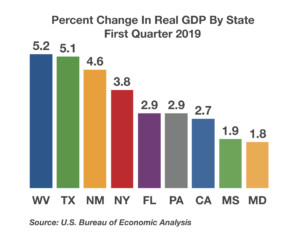
Economic growth across the country varies by several factors, including demographics, education, weather, and industry. The first quarter of 2019 saw an increase in GDP of 3.2% nationwide, yet certain states realized a much stronger growth than others. West Virginia topped every other state in the first quarter, with a 5.2% growth rate. Texas, New Mexico and Utah also saw greater than average growth over the same period.
Some states, such as Texas, continue to experience a large influx of new residents from other states such as California. Texas offers more affordable housing, ample jobs, and no state income tax relative to California. Skilled and qualified workers are essential to fill various job openings, where certain industries seek particular skillsets from workers. Texas has also seen a tremendous demand for oil industry workers as the oil sector in the state has expanded because of shale drilling.
States with older populations and less qualified workers are seeing less growth and even an exodus of people. New Jersey, Maryland, Mississippi and Hawaii were among the slowest growth states in the first quarter, where demographics and cost of living influence the local economies more than other states.
Sources: U.S. Bureau of Economic Analysis
Mortgage Rates Drop But Homes Are Still Expensive – Housing Market Review
Falling interest rates have prompted an increase in mortgage activity as the cost to borrow for home buyers has become less expensive. Mortgage rates fell in late July to the lowest levels since late 2016, with the average on a 30-year fixed rate conforming loan falling to 3.75%, down from 4.94% in November 2018.
The challenge for many homebuyers has been rising home prices and affordability throughout the country. Slow rising wages and stagnant incomes have, for the most part, not kept up with rising home prices. Even though mortgage rates have dropped, housing prices are still elevated to the levels that force many to wait or rent until housing prices drop.
Data tracked by the Federal Reserve Bank of St. Louis and Freddie Mac reveal that even as mortgage rates fell since the beginning of the year, affordability still declined. Affordability is the ability of a homebuyer to purchase a home and pay for all related expenses with an existing income.
Mortgages accounted for two-thirds of the $13.67 trillion in U.S. household debt in the first quarter. Because they are typically paid off over decades, mortgage rates tend to be correlated with 10-year Treasury bond yields rather than with the short-term rates controlled by the Federal Reserve.
Sources: Federal Reserve Bank of St. Louis, Freddie Mac
Social Security Scams
An increase in fraudulent calls from people claiming to be from the Social Security Administration have taken different forms with the intent to obtain sensitive information. Individuals are receiving phone calls displaying the Social Security Administration’s (SSA) phone number on caller ID. The callers are reportedly attempting to obtain personal information, including Social Security numbers. If you receive this type of call, you should not engage with the caller or provide personal information or payment in response to any requests or threats.
A caller-ID “spoofing” scheme misusing the Social Security Administration (SSA) Office of the Inspector General’s (OIG) Fraud Hotline phone number. The OIG has received recent reports of phone calls displaying the Fraud Hotline number on a caller-ID screen. OIG employees do not place outgoing calls from the Fraud Hotline 800 number. You should not engage with these calls or provide personal information.
Fraudulent phone calls from people claiming to be from SSA. Recent reports have indicated that unknown callers are using increasingly threatening language. The callers say that due to improper or illegal activity with your Social Security number (SSN) or account, you will be arrested or face other legal action if they fail to call a provided phone number to address the issue. You should not engage with these calls or provide any personal information.
Calls displaying 1-800-772-1213, SSA’s national customer service number, as the incoming number on caller ID. People who have accepted these calls said the caller identifies as an SSA employee. In some cases, the caller states that SSA does not have all of the person’s personal information, such as their Social Security number (SSN), on file. Other callers claim SSA needs additional information so the agency can increase the person’s benefit payment, or that SSA will terminate the person’s benefits if they do not confirm their information. This appears to be a widespread issue, as reports have come from citizens across the country.
Source: Office of the Inspector General; Social Security Admin., https://oig.ssa.gov/newsroom/scam-awareness