November 2016

Macro Overview

Pre-election jitters led to market stagnation as equities struggled through October. With this extraordinary political year coming to a close, the results of the election will carry over to 2017 as markets digest new policies and legislative changes.

It has been eight years since the financial crisis climaxed in the fall of 2008 when tremendous uncertainty and pessimism lurked throughout the markets. Today, the stimulus efforts that were set into motion by the Fed are for the most part still in effect. Many agree that the markets today are far less precarious than they were in 2008, yet the Fed’s stimulus efforts have yielded minimal, if any, sustainable economic growth.

A topic of contention during the election was how to tax profits of large U.S. companies with overseas operations. About 50 U.S. companies account for $1.7 trillion of the $2.9 trillion of profits held overseas. So for every product a U.S. multi-national such as Apple, GE, or Microsoft sells in another country, any profits made are taxed when the money is brought back to into the U.S.

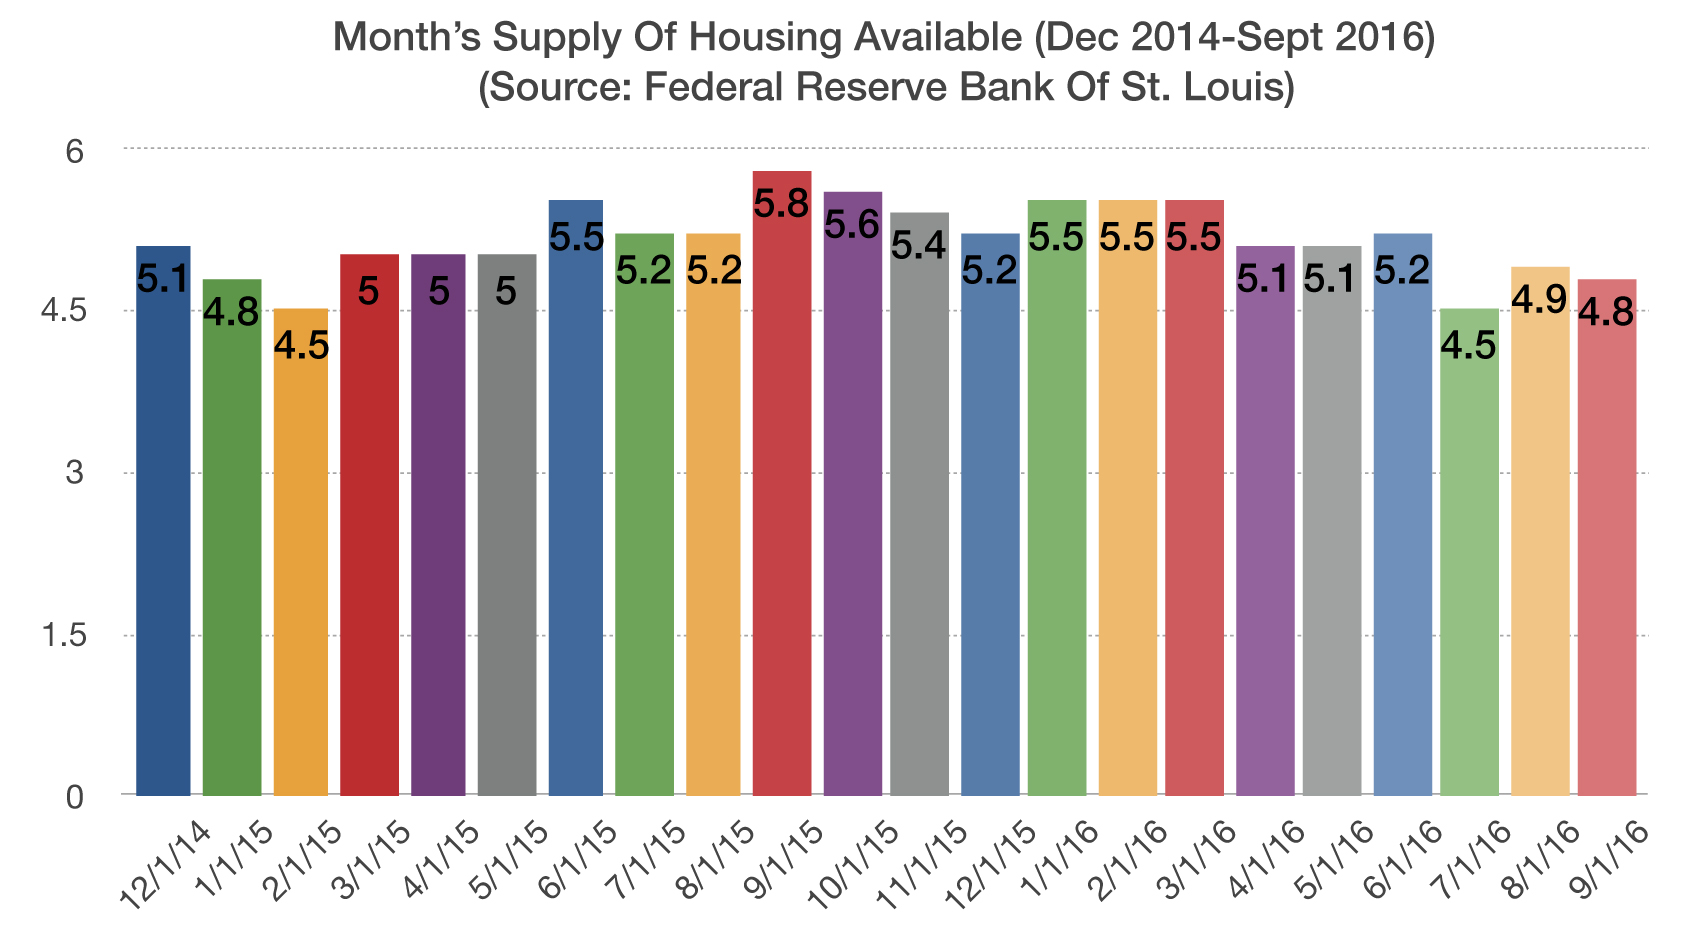
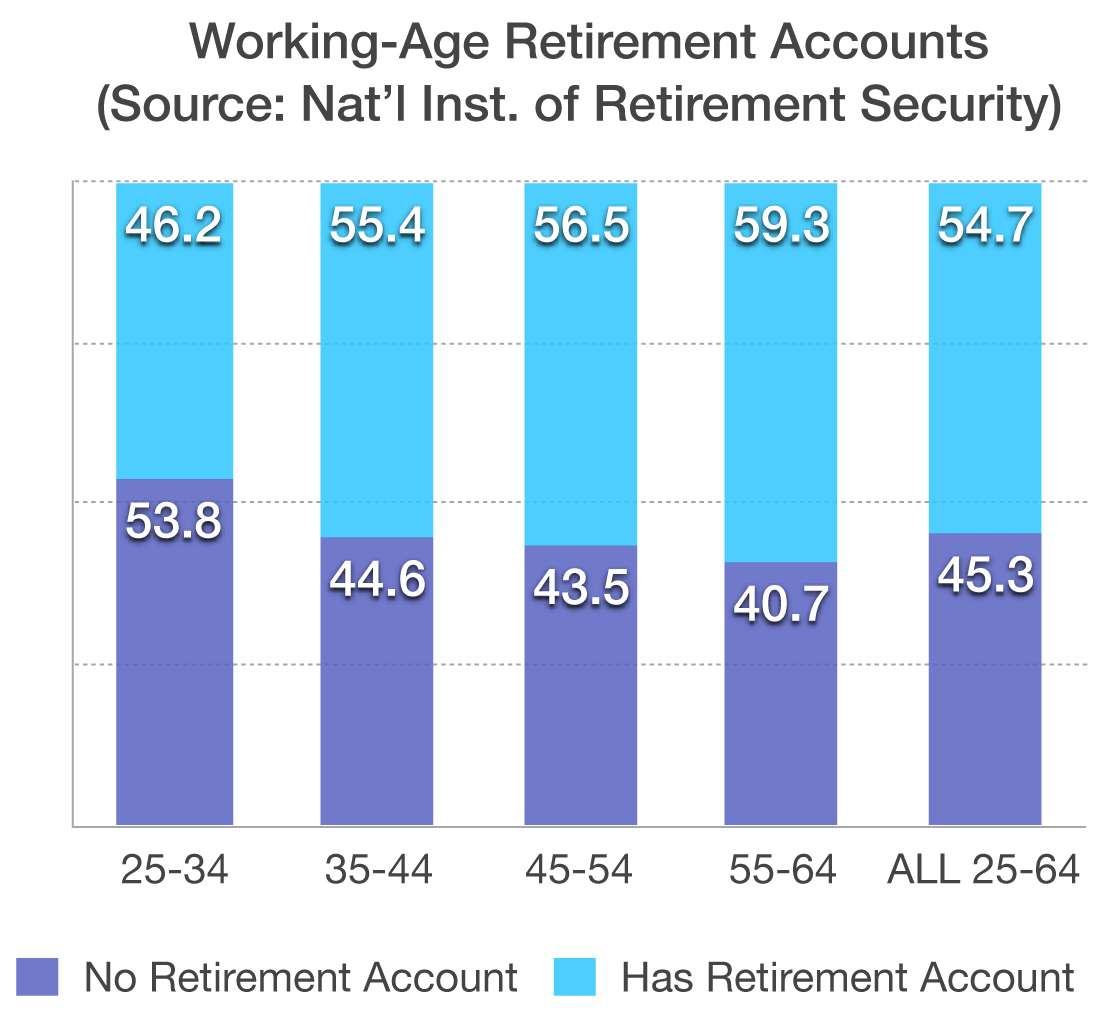
A research report released by the National Institute on Retirement Savings identified that working individuals are actually trying to save more as they approach retirement, while spending less at the same time. This is counterintuitive to what the Fed was hoping for as part of its stimulus efforts. (Sources: Fed, National Institute on Retirement Savings)

Election Day Trivia – Historical Note

Ballot Box Illustration

During the mid 1800’s, the United States was mostly an agricultural society whose citizens were farmers and field workers. Since the country was very much a religious nation, voting day was established in the middle of the week, allowing citizens time to travel to and from polling places without interfering with Sunday religious services. Ample time was needed to travel because horse and buggy was the only form of travel.

Since farmers had such an influence over society and lawmakers, November was designated as the most convenient month for farmers and rural workers to travel to the polls. The fall harvest was over and throughout most of the nation the weather was still mild enough to allow travel over dirt and makeshift roads.

The right to vote wasn’t extended to all citizens for decades. In 1870, the 15th Amendment removed the restriction of race and color from voting. Women gained the right to cast ballots in 1920 with the ratification of the 19th Amendment. For decades, the minimum age to vote was 21, until the 26th Amendment took effect in 1971 granting voting rights to 18 year olds.    (Source: U.S. National Archives)


The Energy Sector Makes Up 7.3% Of The S&P 500 Index

Equity Update – Domestic Equities Update

A strong dollar eroded some corporate earnings as U.S. companies with offshore revenue found it tougher to generate profitable sales. The U.S. dollar has been moving higher against most developed and emerging currencies in anticipation of a rate rise before year-end.

The energy sector, which currently represents 7.3% of the S&P 500 Index, has been a significant distracter of earnings for equities. With continued low oil prices, earnings for energy companies have also fallen, making earnings for the S&P 500 look dismal. Optimistically, when stripping out energy sector earnings, the rest of the S&P 500 sectors are roughly unchanged.

U.S. banks reported stronger than anticipated quarterly earnings as trading helped banks keep profitable. Recent contentions surrounding banking practices might lead to reformed legislation for banks, disallowing them of some activities that have added to their profitability.

More equity analysts are not just looking at company earnings to determine stock valuations, but are also eyeing interest rate levels and how much cash is being returned to shareholders.

Recent divergent stock sector performance is being caused by the anticipation of rising rates, earnings, and mergers. Assets moving from one sector to another (known as sector rotation) is also being induced by the coming rate rise and earnings expectations. (Sources: S&P, Bloomberg)

Shortage of Homes Still An Issue – Housing Market Update

Building of new single-family houses rose 8.1 percent in September, according to the most recent data made available by the Commerce Department. Yet the annual rate of 783,000 housing starts remains well below the historical average of more than one million new homes per year.

While demand is high and enthusiasm for home ownership is apparent, the Fed’s Beige Book Report, which surveys all of the 12 Fed Districts, found that residential construction and real estate activity has expanded further, yet low home inventories continued to constrain sales.

Months Supply Of Housing Available-Basic Charts

Construction of new homes has been despondent, as a lack of qualified workers has hindered the home building industry since the displacement of jobs during the real estate downturn following 2007. The challenge of hiring stems from skilled workers that left the industry during the downturn and have found other occupations since then.

An improving jobs market along with growing families has helped escalate the demand for homes across the nation. (Sources: Federal Reserve Beige Book Report (Oct 2016 Release), Commerce Dept.)

 
The British Pound Is Off 22% From Its Highs Before The Brexit Vote

Fixed Income Update – Global Bond Markets

Money market fund reforms took effect on October 14th, which indirectly led to an increase in short term rates. A key lending rate known as the Libor (London Interbank Offered Rate) rose to 0.87%, a rise from 0.32% a year ago. It is expected that some variable mortgages indexed to the Libor might start to see increases.

Brazil’s central bank cut its key lending rate in October for the first time in 4 years. The monetary policy committee cut its benchmark rate by 25 bps to 14% from 14.25%, to hopefully combat recent political and economic turmoil.

Yields on U.S. corporate and government bonds rose in October, as a rate rise sentiment impeded any rise in bond prices. The 10-year U.S. Treasury yield rose from 1.60% at the end of September to 1.84% on October 31st. Short term government rates have also risen recently, with the 2-year Treasury note edging up to 0.86% as of October 31st. The slight upward shift in both short-term and long-term rates is indicative of a shift up in the yield curve, meaning that an overall change in rates is occurring. (Sources: U.S. Treasury, Fed, Bloomberg)

British Pound At Lowest Levels Since 1985 – Currency Overview

The pound traded at its lowest levels versus the dollar since 1985, off 22% from its June high before the Brexit vote. The pound’s strength has become incredibly contingent on the outcome of Brexit, placing tremendous pressure on the currency at a critical time.

British-Pounds

There has been a steady descent in the pound since the vote. Markets are concerned that as Britain plans its exit, which is expected to happen in the next two years, it will dramatically hinder the financial and banking sectors. The reason is that exports of British products to the EU might be severely limited once the exit has taken effect. Britain’s current prime minister has expressed priority in limiting the influx of immigrants into England from the EU. This stance could very well become a significant issue with the EU, since not allowing immigrants from the EU the rights out to access Britain would surely threaten Britain’s ability to trade and travel freely throughout the EU. The most vulnerable sector to such retaliations are the financial and banking sector, which heavily rely on free movement of employees throughout the various country’s in the EU. The financial and banking sector accounts for 12% of Britain’s GDP, a considerable portion of the economy.

Since Britain’s economic future has become contingent on the outcome of Brexit, the IMF downgraded its growth forecast for the country, predicting that the British economy will only grow a paltry 1.1% in 2017. (Source: IMF, Bloomberg, Reuters)

 
It's Estimated That Marijuana Could Generate Up To $28 Billion In Taxes

Over 45% of Households Have No Retirement Assets – Retirement Planning

As the Baby Boom generation has begun to retire, more attention is being paid to retirement savings and how much retirees will have to live on. In addition to Social Security, a primary source of retirement funds for decades has been pension plans, also known as Defined Benefit (DB) plans. Over the years private sector companies have shifted away from traditional DB plans to Defined Contribution (DC) plans, including 401k Plans. As employers and employees have shifted their assets from traditional pension plans to 401k plans, the onus of funding and managing these retirement assets has migrated to the individual employee. It used to be that employees were automatically covered by pension plans and funded on their behalf. Today, most 401k plans are voluntary and funded not by employers but by employees themselves.

Working HH & Ret. Acct

Many believe that the shift from traditional pensions to 401ks has made it difficult for employees to save. When the average length of employment with a company was much longer years ago, it was feasible to have employers fund their employee’s retirement accounts. The benefit is also used as an incentive for employees. Modern day dynamics have made employees much more mobile, making 401k plans more popular and practical as retirement savings vehicles. (Source: National Institute on Retirement Security)


Where Marijuana Adds To Higher State Tax Revenues – Fiscal Policy Review

For years the discussion as to whether or not to legalize marijuana (also known as cannabis, pot or weed) has been a contentious issue. Currently, the use, possession, sale, cultivation, and transportation of cannabis is illegal under federal law in the United States. However, the federal government did articulate that states have the ability to be more liberal with their pot laws, as long as they pass a law to decriminalize cannabis for recreational or medical use only. Unlike several of the individual states, the federal government classifies marijuana as a Schedule I substance, meaning that it has a high potential for being abused by users and has no acceptable medical purposes.

Illustration of a green ballot box with a marijuana leaf

As of October 2016, the four states that have legalized marijuana are Alaska, Colorado, Oregon, and Washington State. Aside from the claimed medical benefits offered by cannabis, tax revenue benefits have come to the forefront as a key factor. Marijuana tax collections for Colorado and Washington which both starting taxing cannabis in 2014, have both exceeded initial estimates. Colorado brought in over $129 million of tax on cannabis during its first fiscal year. Washington state brought in over $67 million in its first year of taxing pot. This data is just for two states, yet the expectation is that other states will eventually follow suit. The Tax Foundation, a non partisan independent tax policy research organization, projects that an established marijuana industry could eventually generate up to $28 billion in federal, state, and local tax revenue nationally. (Sources: Tax Foundation)


The Election's Impact on Your Portfolio

The Election’s Impact on Your Portfolio (by Bob Veres)

By now, most voters have made up their mind about who they want to serve as their next President. But what can they look forward to, from an investment and tax standpoint, if their candidate wins or loses? How will the election affect their portfolio and future net worth?

Let’s look at the least predictable factor. An analysis of historical market returns under different administrations gives a frustratingly incomplete picture. When a President comes into office and immediately enjoys a few boom years, is that due to his great policies or the policies of his predecessor? Similarly, when a President enters office in the middle of a recession (think Obama in 2009 and George W. Bush in 2001), can we attribute the weak market performance to any policies he hasn’t had a chance to enact?

The cliches that Republicans are better for markets than Democrats is hard to support based on the raw statistics. As you can see from the chart, Richard Nixon and George W. Bush are the only presidents who presided over a net loss in the markets, while Bill Clinton and Barak Obama are second and third behind Gerald Ford as the presidents associated with the highest total gains. The record is too mixed, and too complicated, to make predictions based simply on the party that wins the white house.

president-markets


The Election's Impact on Your Portfolio - continued

The Election’s Impact on Your Portfolio (by Bob Veres)

But what about something more concrete, like tax policy or budget deficits? Surely here we can read the tea leaves about the future.

Once again, the historical record can be misleading. President Reagan, known as a great tax cutter, lowered taxes with the 1981 tax act and promptly raised them again with new measures a year later. Democratic President Bill Clinton’s administration presided over the only budget surpluses of the modern era, while Republican President George Bush and Democratic President Barack Obama together, added more to the deficit than all previous presidents. (See chart)

president-debt

The most reliable clue we have about the fiscal and investment impact of a Trump or (Hillary) Clinton presidency is the actual proposals by the candidates—but even here we have to proceed with caution.  It is unlikely that the Democrats will win the Presidency plus a majority in both the Senate and the House of Representatives, which means that a Clinton wish-list will be either stymied or compromised by divided government.


The Election's Impact on Your Portfolio - continued

The Election’s Impact on Your Portfolio (by Bob Veres)

Nevertheless, if Clinton is elected, we know to expect certain changes to the tax code.  There will be at least an attempt to add a 4% surtax on incomes above $5 million, an end to the carried interest deduction favored by hedge fund managers and other Wall Streeters, plus a cap on itemized deductions when people reach the 28% tax rate.  The existing $5.45 million estate tax exemption would be reduced to $3.5 million $7 million for couples) and estate amounts above that figure would be taxed at a 45% rate.  Wall Street brokers would be hit with an unspecified surtax on high-frequency trading activities.

A President Trump would be more likely to get his wishes, but what, exactly, these would be is far less certain.  You can get a picture of the fuzziness of his policy proposals when you look at his promise of infrastructure spending.  When Candidate Clinton proposed spending $275 billion on road, airport and electrical grid repairs (surely not enough to move the needle on U.S. GDP growth), candidate Trump immediately proposed spending $550 billion on the infrastructure—doubling his opponent’s figure without any apparent analysis.

Many of the proposals have been made off-the-cuff and some are contradictory, but you can expect a President Trump to make an effort to cut taxes by reducing the ordinary income tax brackets to 12% (up to $75,000 for joint filers), 25% ($75,000 to $225,000) and 33% (above $225,000).  The standard deduction would double, but itemized deductions would be capped at $100,000 for single filers ($200,000 for joint filers).  Corporate tax rates would be reduced from a maximum of 35% to a maximum of 15%.  Federal estate and gift taxes would be eliminated, but the step-up in basis would also be eliminated for estates over $10 million.

Lumping together candidate Clinton and candidate Trump’s various proposals (and making a variety of assumptions to cover the fact that the Trump plan is light on details), the Tax Foundation estimates that the Clinton proposals, in the unlikely event that they were fully-enacted, would reduce GDP by 1% a year and reduce the budget deficit by $498 billion.  Candidate Trump’s proposals would reduce tax revenues by between $4.4 trillion and $5.9 trillion over the next decade, but the Tax Foundation believes they would add 6.9% to GDP.

Turning back to the markets, the investment herd prefers certainty and status quo to uncertainty and rapid change.  A Clinton presidency checked by either the Republican House or a Republican House and Senate would provide a measure of stability.  A President Trump, with Republicans controlling both houses of Congress, would represent significant uncertainty, and off-the-cuff policy proposals introduced into the news media at random times would likely spook investors.  Loose talk about “renegotiating” America’s debt with Treasury bond holders here and abroad (read: default, followed by demanding a haircut) could, all by itself, lower America’s bond rating once again, following the downgrade aftereffect of the government shutdown.

A Clinton presidency would almost certainly have a negative impact on the coal industry, and to the extent that there are new environmental regulations—which can be imposed by regulation without consulting Congress—it could also negatively impact the energy sector overall.  It would not be surprising to see a carbon trading initiative, and more broadly a requirement that whatever environmental degradation companies impose on society will have to be paid for by the companies themselves in some form or fashion.

 
The Election's Impact on Your Portfolio - continued

The Election’s Impact on Your Portfolio (by Bob Veres)

A Trump presidency would seem to favor industry in a variety of ways.  The proposals are frustratingly unspecific, but we could expect less regulation (particularly environmental regulation), no raising of the minimum wage, lower corporate taxes across the board and protectionism.  On the other hand, if candidate Trump is serious about deporting undocumented immigrants, the U.S. labor supply would diminish in unpredictable ways.  The policy would likely have the biggest negative impact on the farming and construction industries.

Perhaps the biggest risk in this election involves trade.  A Trump Presidency would be seen, initially, at least, as a drag on the Mexican markets, and it might see America rip up its trade agreements and pick currency and trade wars with the emerging economic colossus that is China.  Interestingly, the Trans-Pacific Partnership agreement, which both candidates now reject, was an effort by the U.S. to create economic ties to Singapore, Korea, Vietnam and other countries in the Asian rim, the better to counter Chinese economic influence.  In terms of global trade, China stands to win no matter who wins this election

The bottom line: prepare for the possibility (but not the certainty due to gridlock) of higher taxes under a Hillary Clinton presidency, and a more certain (but hard to predict the details) lower-tax environment under a President Trump.  If you’re a Wall Street trader, you’re going to lose money under a Clinton presidency, and Southeast Asian nations stand to lose expected trade benefits under either president.

Despite the usual stereotypes, the deficit would likely go up under a Trump presidency and it might go down under a Clinton one—again with the caveat that comes with a divided government.

The economic outlook would be much harder to predict.  The reality is that no matter who wins, America will still represent the most dynamic economy in the world, and whoever wins the White House is unlikely to change that.

Sources:
http://www.truthfulpolitics.com/http:/truthfulpolitics.com/comments/u-s-federal-debt-by-president-political-party/
http://taxfoundation.org/article/details-and-analysis-hillary-clinton-s-tax-proposals
http://taxfoundation.org/article/details-and-analysis-donald-trump-tax-reform-plan-september-2016