Ocean Park Capital Management

2503 Main Street

Santa Monica, CA 90405

Main: 310.392.7300

Daily Performance Line:  310.281.8577

October 2017
Market Update
(all values as of 05.30.2025)

Stock Indices:

Dow Jones 42,270
S&P 500 5,911
Nasdaq 19,113

Bond Sector Yields:

2 Yr Treasury 3.89%
10 Yr Treasury 4.41%
10 Yr Municipal 3.31%
High Yield 7.26%

YTD Market Returns:

Dow Jones -0.64%
S&P 500 0.51%
Nasdaq -1.02%
MSCI-EAFE 17.30%
MSCI-Europe 21.20%
MSCI-Pacific 10.50%
MSCI-Emg Mkt 8.90%
 
US Agg Bond 2.45%
US Corp Bond 2.26%
US Gov’t Bond 2.44%

Commodity Prices:

Gold 3,313
Silver 33.07
Oil (WTI) 60.79

Currencies:

Dollar / Euro 1.13
Dollar / Pound 1.34
Yen / Dollar 144.85
Canadian /Dollar 0.72
 

 Fund Overview

Equities recorded substantial gains in October, as did the Ocean Park funds, marking their fourth consecutive positive month.  Continuing the recent trend, semiconductor manufacturers and equipment makers were the standouts.  The funds outperformed most of the major indices for the month and continue to outperform most of the major indices for the year.

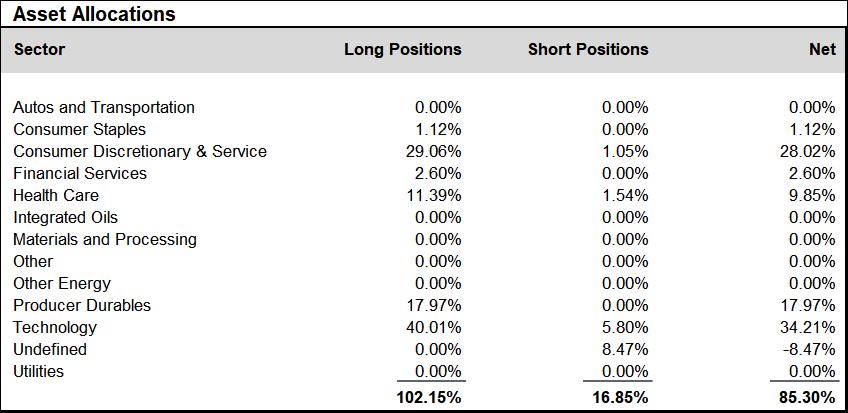
During October, we added to positions in the producer durables and technology sectors, and reduced positions in the consumer discretionary and service and health care sectors.  We finished the month at about 85% net long, up from about 82% at the end of September.

A schedule showing the performance of the Investors Fund is included below, along with our Asset Allocation Chart. Daily updates on our activity are available on our Results Line,
at 310-281-8577, and current information is also maintained on our website at www.oceanparkcapital.com. To gain access to the site enter password opcap.


*These results are pro forma. Actual results for most investors will vary. See additional disclosures on page 4.
Past performance does not guarantee future results.

 
Equity Overview - October 2017

Equity Overview

Once again, growth stocks outpaced value stocks in October, and investors favored stocks with earnings surprises and positive earnings estimate revisions.  Most sectors in the S&P 500 posted gains, with technology stocks at the top.  Healthcare and energy stocks were generally weak.

Third quarter earnings reported in October continued at the torrid pace set by second quarter earnings reported in July.  With 55% of S&P 500 companies reporting, the blended growth rate for Q3 earnings was 4.7%, well above the 3.0% rate projected at the end of the quarter.  In addition, 76% of companies reporting beat consensus earnings expectations, compared with the 71% one-year average.  Perhaps even more significant, 67% of companies reporting beat consensus revenue estimates, compared with the 61% one-year average.  This marks the third consecutive quarter with revenues meaningfully above expectations.  This tends to confirm our view that there is real demand, and not just cost-cutting, underpinning the rise in corporate profits.


Macro Overview - October 2017

Macro Overview

Economic statistics reported in October were generally positive.  Manufacturing and services indicators were healthy.  Consumer confidence hit a 17-year high.  The Commerce Department estimated third quarter growth at 3.0%, a relatively strong number.  It was down slightly from second quarter growth of 3.1%, but this was attributed to damage caused by the hurricanes in Texas and Florida which should ultimately lead to increased economic activity connected with recovery.

The Fed kept interest rates unchanged, but again signaled that another rate hike is likely in December.

Tax reform advanced in the House of Representatives.  As expected, its bill would slash tax rates for businesses.  But claims that it would also benefit individuals, and that it would be deficit-neutral, were widely disputed.  Its future remains uncertain.

Prospects for the global economy appear to be improving.  The World Economic Outlook released by the IMF projects global growth of 3.6% in 2017 and 3.7% in 2018, up from 3.2% in 2016, and the strongest since 2014.


Additional Disclosures - October 2017

Additional Disclosures

Performance data for OPI reflect the reinvestment of dividends and other earnings on the fund’s assets.  Performance data for the major indices reflect only changes in the value of those indices, and would be higher if dividends were included. However, the index data do not reflect fees that would be paid to index fund managers and transaction costs that would be incurred when their component stocks are bought or sold, while OPI’s data do reflect quarterly fees and expenses incurred by the fund.  The information provided is believed to be reliable, but its accuracy or completeness is not warranted. This material is not intended as an offer or solicitation for the purchase or sale of any stock, bond, mutual fund, or any other financial instrument. The views and strategies discussed herein may not be appropriate and/or suitable for all investors. This material is meant solely for informational purposes, and is not intended to suffice as any type of accounting, legal, tax, or estate planning advice. Any and all forecasts mentioned are for illustrative purposes only and should not be interpreted as investment recommendations.