Macro Overview
An improving economic environment and earnings optimism propelled markets higher, along with prospects that there might be some agreement on tax reform in Washington.
The House of Representatives released a draft of tax policy proposals known as The Tax Cuts & Jobs Act. The prospect of lower taxes for corporations and individuals are part of the proposals, while also targeting tax avoidance by multinational U.S. firms, reassuring markets that fiscal reform could prove possible.
Effects of hurricane influenced rebuilding efforts underway in Texas and Florida are expected to become more visible via labor and materials data over the next few weeks. Economists expect an increase in job placements and material costs as insurance claims start to pay out. Hurricane Harvey destroyed over 15,500 homes in Texas, while Hurricane Irma damaged 90% of the homes in the Florida Keys.
Apart from hopeful tax reform passage, equity markets have soared due to stronger global demand, improving earnings, and fewer regulatory hurdles. Internationally, global growth surpassed 4.5% in the second quarter, following a 3.9% increase in the first quarter. The data suggests that global production and consumption is increasing, eventually translating into higher earnings for global equities. The International Monetary Fund (IMF) issued increased growth estimates for 2017 & 2018 following better than expected growth data.
The U.S. economy posted two consecutive quarters of GDP growth above 3% in the second and third quarters, marking the best six-month consistent period of growth in three years. Gross Domestic Product (GDP) grew at a 3.1% rate in the second quarter and 3% in the third quarter, per Commerce Department data. The subdued third quarter results are believed to be attributable to Hurricanes Harvey and Irma as economic activity came to a halt for portions of Texas and Florida. Economists believe that rebuilding efforts following the storms will give GDP growth a boost in the fourth quarter. Historically, U.S. GDP has averaged around 3% annual growth.
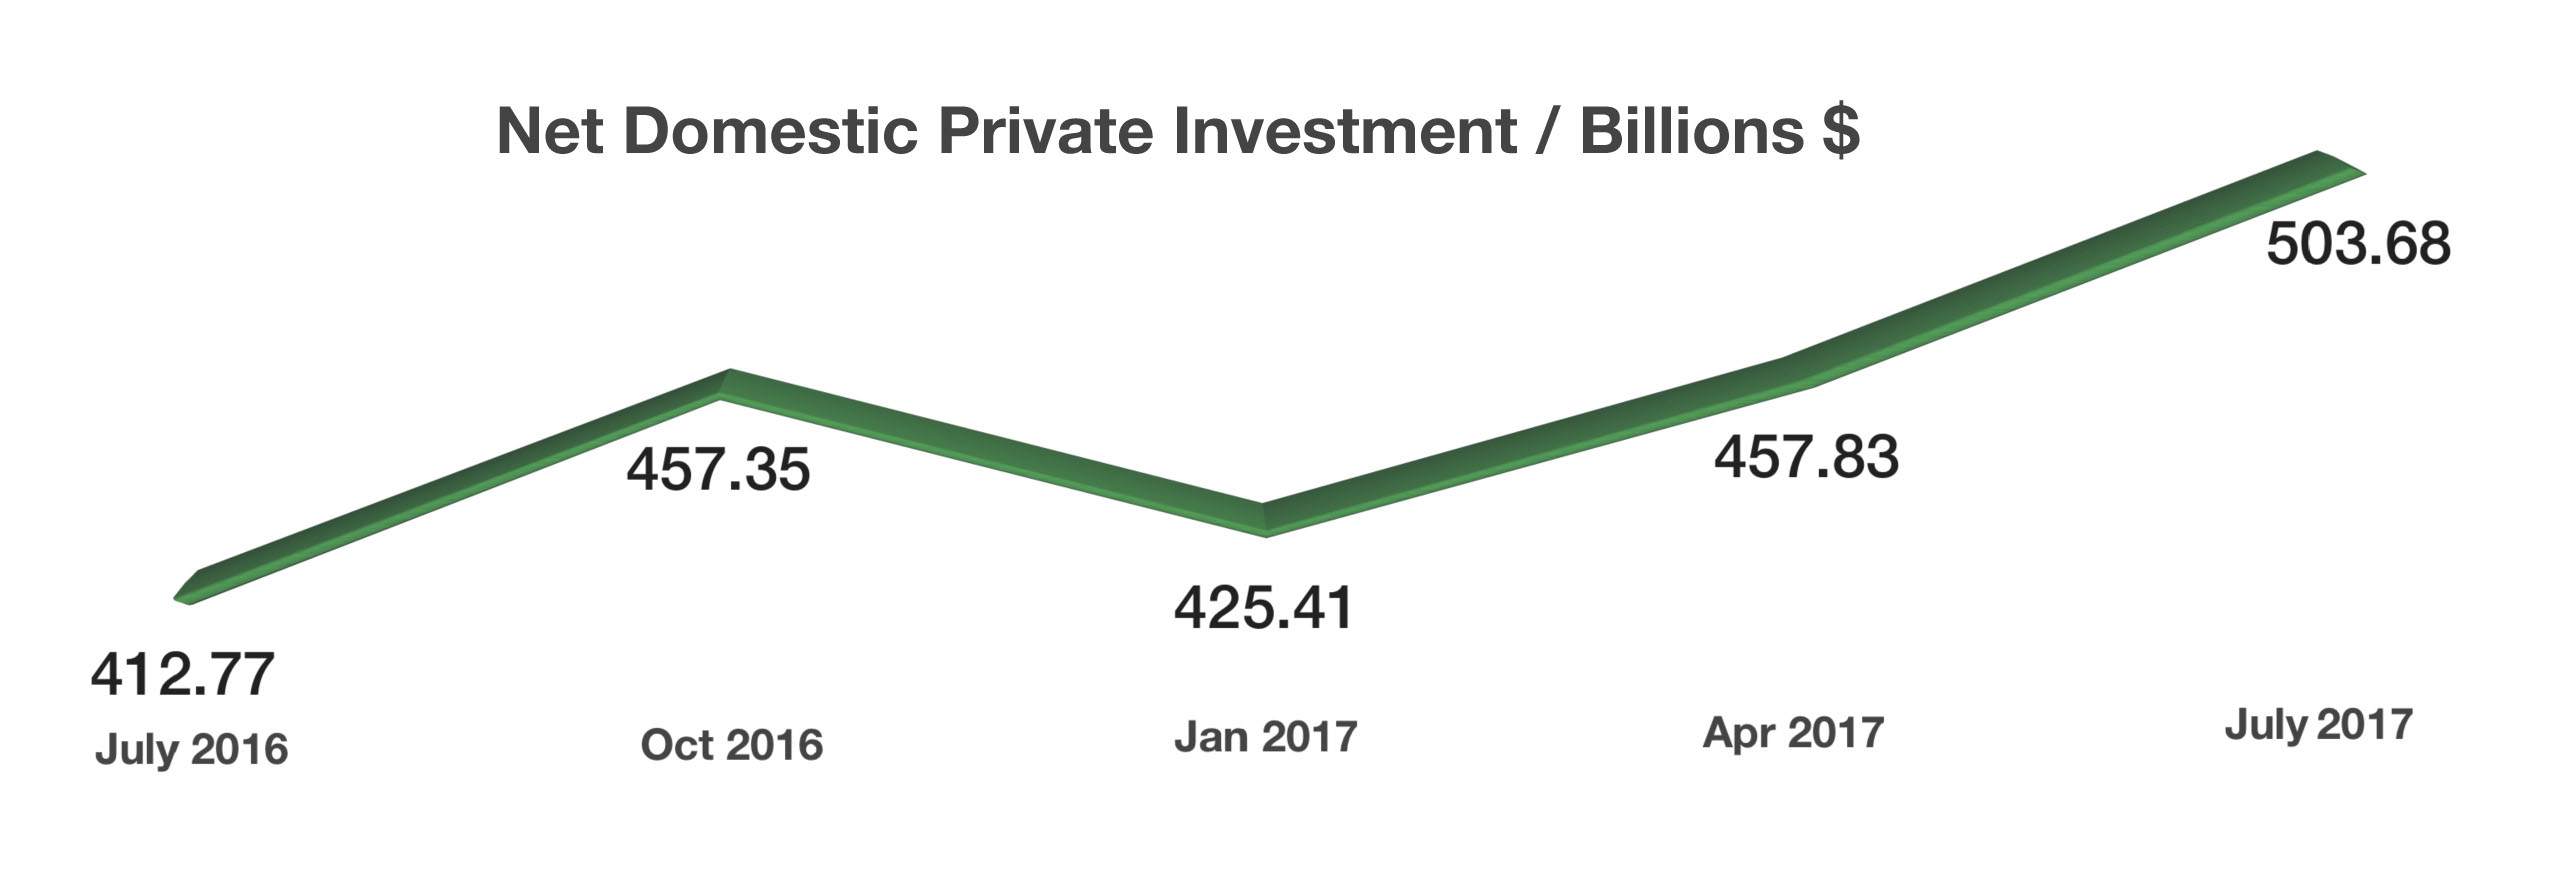
Proposed business tax reforms are expected to increase business investment, which has lagged in recent years. The Federal Reserve Bank of St. Louis released data showing that business investment rose in the second and third quarters. Overall, a rising trend in business investment is a confirmation of improved confidence held by companies on economic and tax reform prospects. (Sources: House.gov, Commerce Department, Federal Reserve)
Sinister Month Of October Rebuffed – Equity Markets
This October marked 30 years since the market drop of 1987, when the Dow Jones Industrial Average fell to 1,738, losing 508 points. The 22.6 percent collapse in 1987 is equivalent to a drop of about 5,200 points in the index today. The benchmark U.S. S&P 500 index plunged 20.5 percent on that same day in October 1987, equal to a drop of over 520 points today, and the Nasdaq dropped 11.4 percent, comparable to a drop of about 750 points. Another historical note is that October has been recognized as the most volatile month of the year. This past October was an exception, with the least amount of volatility of any October going back to 1928.
Earnings, the single most important factor for stock prices, have been rising in sync with stock prices, meaning that improved earnings validate higher equity prices.
International markets are following the rise of U.S. equity markets, reflecting optimism about world economic growth. Steady buying in U.S. markets has transitioned over to European, Asian, and emerging markets over the past few trading sessions. Broad-based economic growth internationally is fueling stock market appreciation as well as inflationary pressures. A weak dollar has also continued to buoy large U.S. multinationals allowing their products to be priced more competitively worldwide. (Sources: Dow Jones, S&P, Nasdaq, Bloomberg)
Car Prices Are Falling – Auto Industry
Seven consecutive years of increasing U.S. auto sales have put a glut of vehicles on U.S. highways. In addition, a significant number of those sales were with a lease, leading to a rising tide of cars flowing back into the market as lease terms expired.
As automakers have added manufacturing capacity, they have also been aggressive in offering larger incentives on new vehicles in order to maintain record sales momentum. That has put downward pressure on the entire market.
Consequently, the number of drivers that owe more on their cars than they’re worth is surging. Americans are paying on 108 million auto loans currently, according to the most recent Federal Reserve data. That represents roughly half of all licensed drivers in the U.S. Among those that carry loan balances, the Federal Reserve says auto loans make up between 10 percent and 23 percent of their total financial obligations.
The average used car lost 17 percent of its value in the past 12 months, dropping from $18,400 to $15,300, according to data from Black Book, an auto analytics company. That annual depreciation figure has also been increasing steadily, with the average used car today depreciating nearly twice as fast at it did in 2014, when the annual rate was just 9.5 percent. (Sources: Black Book, Federal Reserve)
IMF Revises Global Growth Upward – International
Revisions to the initial World Economic Outlook were released in October, revealing stronger than expected estimates for the remainder of 2017 and all of 2018. Growth estimates now are 3.6% for 2017 and 3.7% for 2018, an acceleration from the 3.2% growth that occurred in 2016.
The IMF report states that a global cyclical upswing that began in the middle of 2016 is still intact and gradually gaining momentum. Financial conditions remain buoyant in the U.S. and internationally regardless of any monetary stimulus efforts discontinued by global central banks.
The IMF did attest that the global economy has achieved a level of momentum during a short term that has not occurred for many years. The identified growth is also broad based, more so than any other time over the past decade. Global growth is expected to be the strongest this year since 2014, with the majority of developed economies strengthening. (Source: IMF; World Economic Outlook Report revised October 2017)
Shift In Bond Yields – Fixed Income Markets
The yield curve for U.S. government bonds is flattening while shorter-term rates have risen as Fed hike expectations have increased. The 2-year Treasury reached 1.60% in October, its highest level since 2008. Rising shorter-term maturity bonds with little or no change in longer-term maturities is viewed by economists as a pick up in shorter-term inflation as well as the expectation of a coming rate increase by the Federal Reserve.
The 10-year U.S. Treasury is becoming more of an attractive option for international investors as the yield on the benchmark bond has risen versus its developed market peers. The yield on the 10-year Treasury at the end of October was 2.38%, compared to a 0.04% yield on the Japanese 10-year government bond, 0.36% on Germany’s and 1.26% on the British 10-year government bond. (Sources: Bloomberg, Fed.)
Executive Orders – Historical Note
The National Archives, which is also the same entity that maintains presidential records and has recently made available additional files surrounding the JFK assassination, keeps track of Presidential Executive Orders. Its database showcases detailed executive orders back to Franklin D. Roosevelt.
Executive Orders are presidential directives issued by the President and directed towards agencies of the U.S. federal government. The orders usually overturn previous mandates and orders established by a prior administration. 
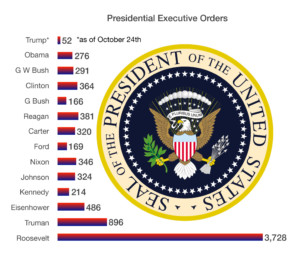
Executive Orders have been part of Presidential capabilities since George Washington, yet became more utilized during the 20th century. During his 12 years in office, Franklin D. Roosevelt signed 3728 Executive Orders, the most amount of any sitting President. The only President with no Executive Orders executed was William Henry Harrison, who died only 31 days after being elected.
As of Oct 24, 2017, President Donald Trump has executed 52 Executive Orders following 277 days in office. (Source: The U.S. National Archives and Records Administration)
Consumers Are Spending More & Saving Less – Consumer Behavior
Recent government data reveals that Americans have been supporting their spending with their savings. The increase in spending is also recognized by economists as a sign of optimism and consumer confidence. Commerce Department data show that consumers have been spending more, as measured by the Personal Consumption Expenditures (PCE), and saving less, as measured by the savings rate, which fell to a ten-year low of 3.1% in September.
For many Americans that save diligently, using credit to spend is usually a last resort. So, for those consumers, spending from savings occurs before tapping a credit card. The most recent data show that consumers, as measured by the PCE, have been spending more over the past year. The concern is that consumers are concurrently saving less, meaning that savings are starting to go towards expenditures. Economists view this dynamic as a possible rise in prices and inflationary pressures where current income may not be keeping up with rising inflation.
Continued job and wealth gains have inspired consumers to spend more confidently. Another notable data set, tracked by the Federal Reserve, is household net worth, which revealed an increase in its most recent release, adding to consumer confidence. (Sources: BLS, Federal Reserve Bank of St. Louis)
Social Security Numbers May Go Away – Consumer Awareness
Following the recent Equifax data breach that affected 143 million Americans, the administration has called on various federal departments and agencies to look into the vulnerabilities of the Social Security number system and what alternatives may exist.
Several proposed encryption methods are being considered to replace the current vulnerable 9-digit numbers. An idea being looked at is a private key that is basically a very long encrypted number that would require a pass code or pin, similar to a chip coded credit/debit card. Fortunately for Medicare users, Medicare cards will no longer brand Social Security numbers on them. Instead they will be replaced by a new set of number identifiers starting in April 2018.
When the Social Security Administration started issuing numbers in 1936, the intent was to track U.S. workers’ earnings in order to determine their Social Security benefits. Over the decades various government agencies and private companies started using the numbers as a general identifier, which was never the original intent. In order to do away with Social Security numbers, it would need to be voted on and approved by Congress. (Sources: Social Security Administration, Medicare.gov)