November 2018 Market Update and Economic Review
Market Update
(all values as of 04.30.2024)

Stock Indices:

Dow Jones 37,815
S&P 500 5,035
Nasdaq 15,657

Bond Sector Yields:

2 Yr Treasury 5.04%
10 Yr Treasury 4.69%
10 Yr Municipal 2.80%
High Yield 7.99%

YTD Market Returns:

Dow Jones 0.34%
S&P 500 5.57%
Nasdaq 4.31%
MSCI-EAFE 1.98%
MSCI-Europe 2.05%
MSCI-Pacific 1.82%
MSCI-Emg Mkt 2.17%
 
US Agg Bond 0.50%
US Corp Bond 0.56%
US Gov’t Bond 0.48%

Commodity Prices:

Gold 2,297
Silver 26.58
Oil (WTI) 81.13

Currencies:

Dollar / Euro 1.07
Dollar / Pound 1.25
Yen / Dollar 156.66
Canadian /Dollar 0.79
 

Macro Overview

Historically volatile October was validated once again by dramatic price swings for both stocks and bonds. Among the catalysts behind the volatility were rising rates, a strong dollar, tariffs, and waning benefits stemming from the tax cuts.

Markets are transitioning from a deflationary environment to an inflationary environment, returning to levels that the Fed classifies as normalized. Rising rates are encroaching upon various consumer driven areas, including mortgages, auto loans, and lines of credit. Rising mortgage rates are weighing on the housing market, hindering certain buyers from affording higher payments.

The long awaited rise in interest rates is spurring a shift in equity valuations as company assets and profits are being reassessed as rates start to gradually rise for both consumers and businesses. Most analysts and economists agree that rising rates tend to signal that a broader economic expansion is underway. Optimistically, valuations for equities have fallen, making prices more attractive for active investors and buyers.

Earnings released for the nation’s largest banks this past month revealed that economic expansion is taking hold. Consumer and business loans are fundamental to the banking business and act as a gauge of the strength of the economic environment. Banks noted that their consumer and business loans were in exceptionally good standing with no issues of borrowers staying current on their loan payments.

The federal deficit, which ended its fiscal year for 2018 in September, grew 17% to $779 billion. A drop in government revenue from personal and corporate tax cuts is the primary reason.

Energy forecasts by the U.S. Energy Department and International Energy Agency are expecting a higher than average price for gasoline this fall, diverting from the normalized drop in prices following the summer months. Factors affecting prices include less available supply from domestic and international producers as well as reimposed sanctions on Iranian oil exports.

As the holidays approach, turkey will once again be the favored bird for millions of Americans. The National Turkey Federation estimates that about 46 million turkeys are consumed each Thanksgiving. 
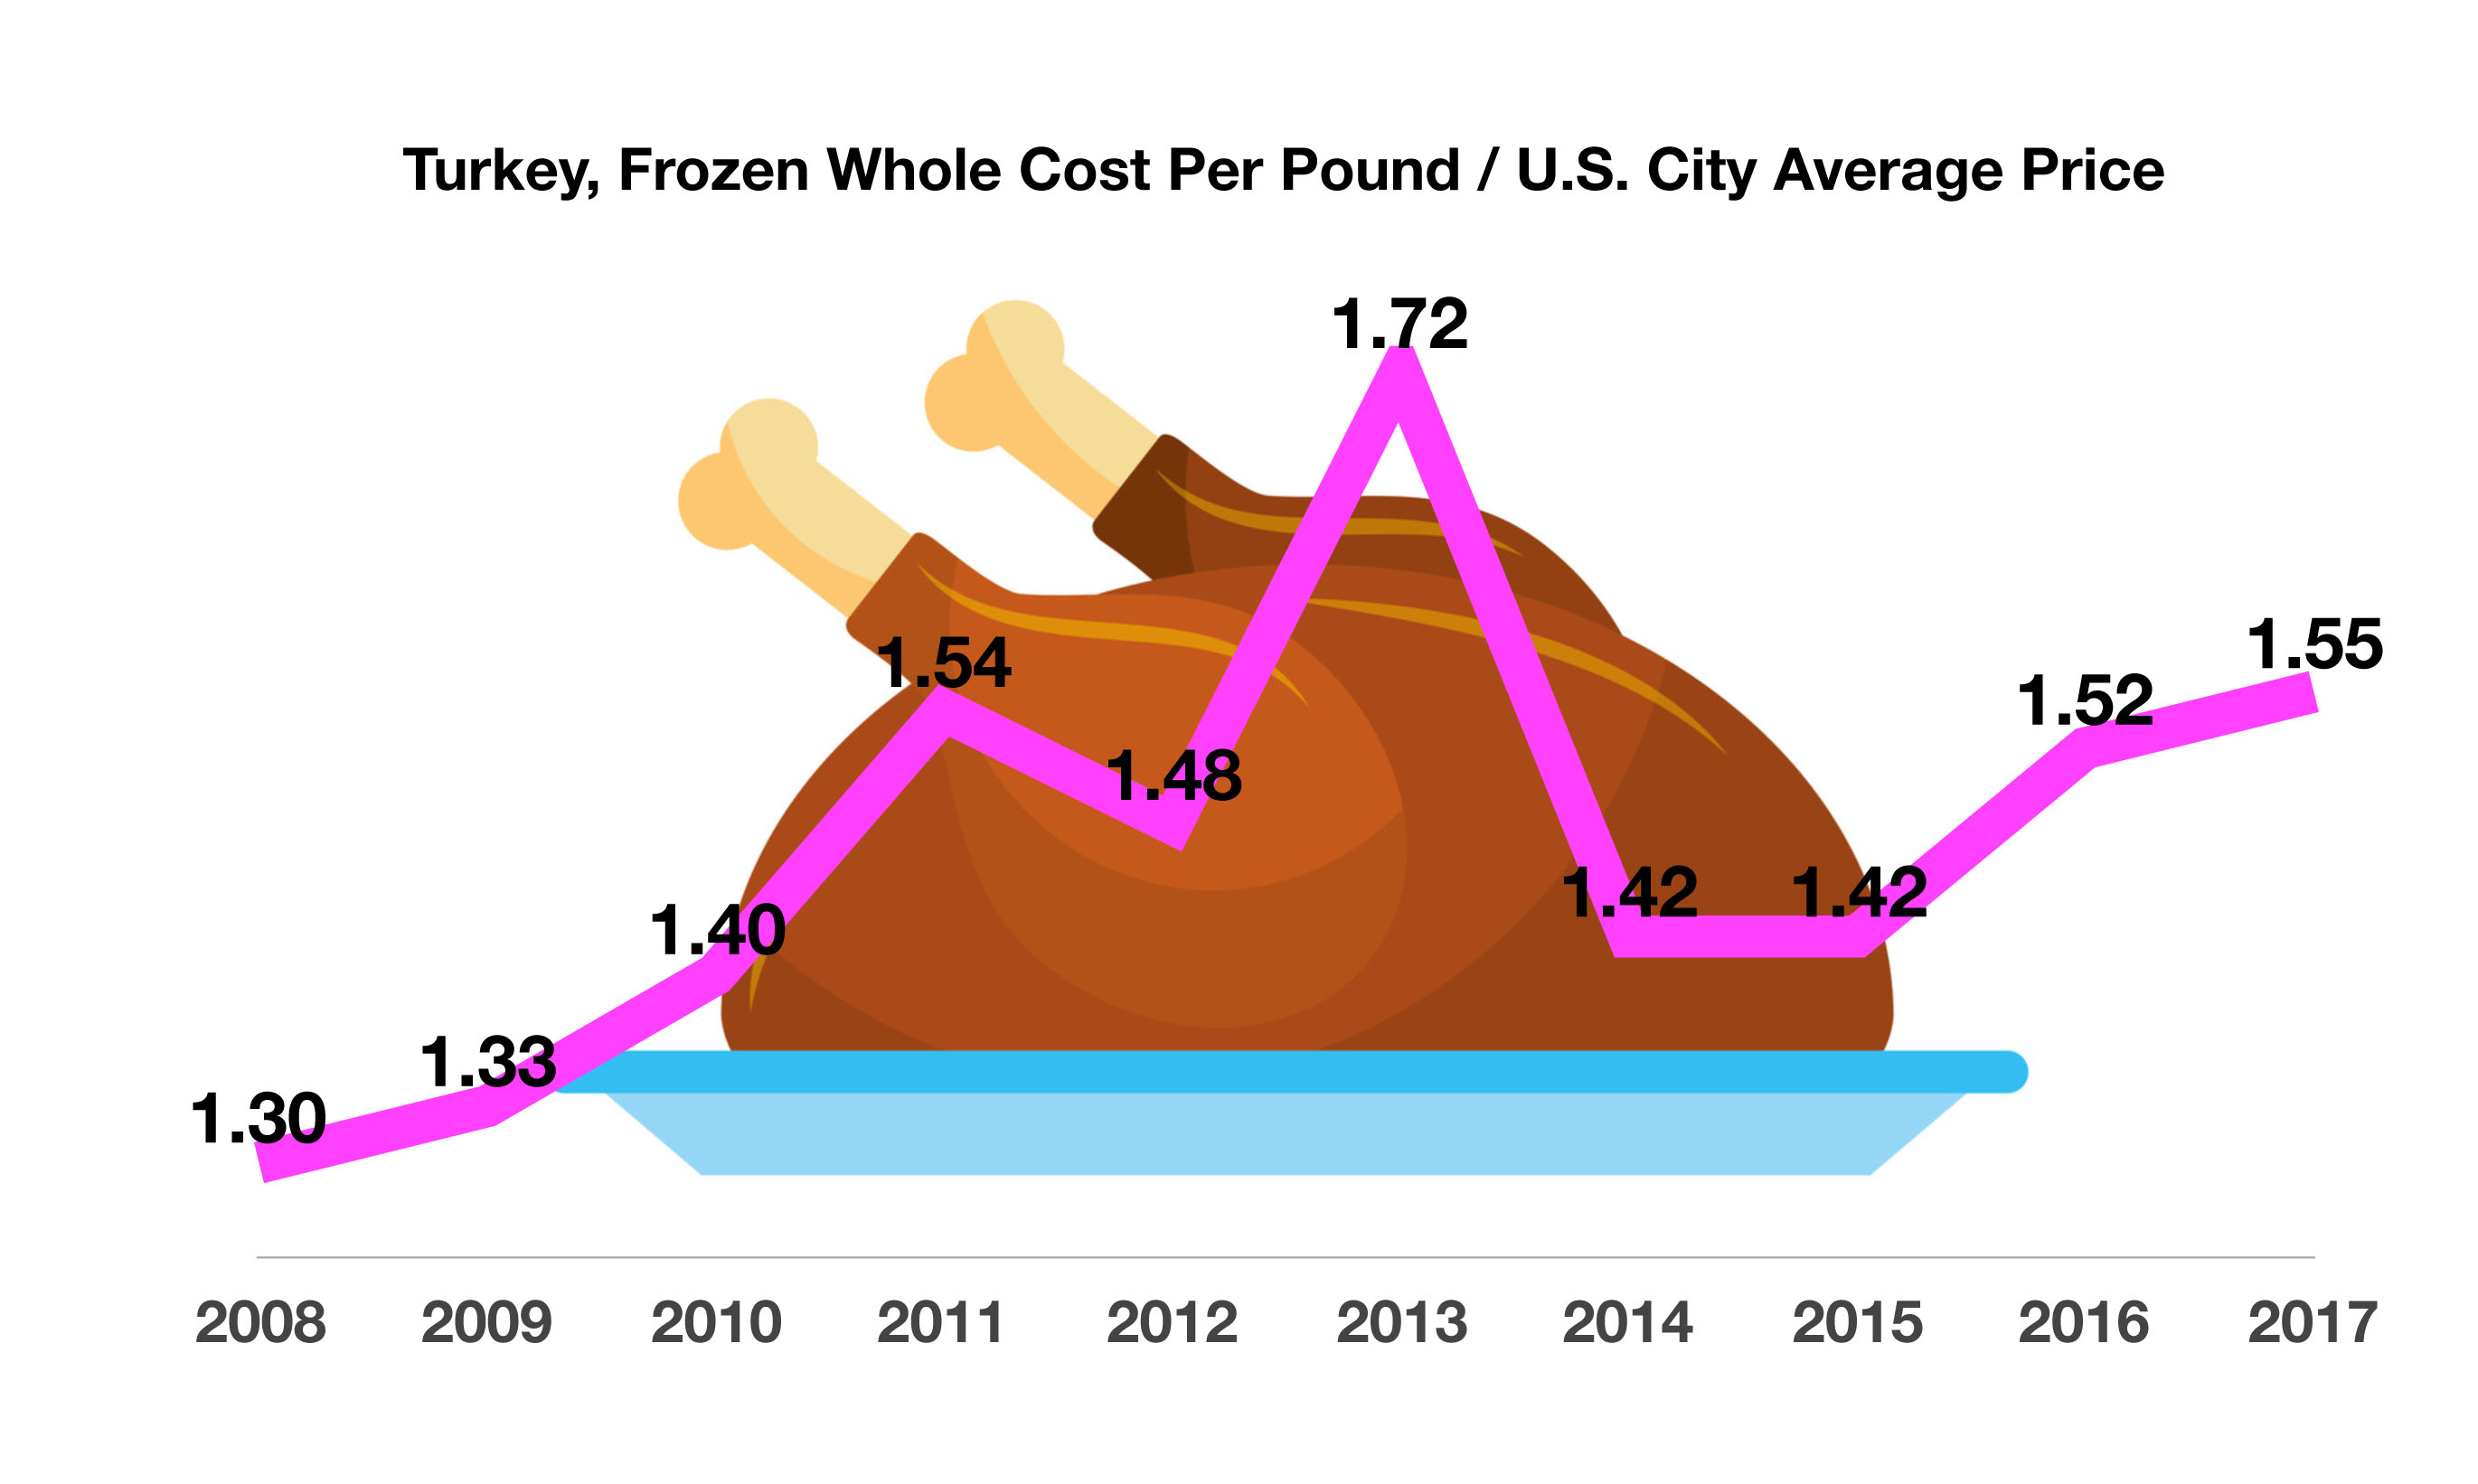
Turkey, relative to other items in the grocery store, has remained relatively inexpensive over the years, having risen by roughly 17% over the past decade.

(Sources: U.S. Department Of Energy, International Energy Agency, Federal Reserve, BLS; CPI-Average Price Data, National Turkey Federation)

 
30-year conforming mortgage rates hit a record high of 16.63% in 1981

Historically Volatile October Did It Again – Domestic Equity Markets

Stocks in all categories suffered in October as the month saw declines across all major indices. The initial imposition of tariffs hit U.S. company earnings in October as well with rising material costs hindering profits. Aluminum, steel and smaller components were among the items affecting manufacturing costs the most. Several U.S. companies plan to increase prices on their products in order to maintain margins and profitability levels.

Rising U.S. Treasury yields derailed an upward trend in the market, raising borrowing costs for companies. Some analysts believe that operating margins may have peaked in the 2nd quarter as operating expenses such as wages are on the rise. A rotation from growth to value stocks were key trades during the market pullback as buyers favored value.

The drop in equity valuations during October has adjusted the expected price/earnings (PE) ratio for the S&P 500 from 18.8 times to 15.6 times, thus attracting buyers at lower valuations.

(Sources: U.S. Treasury Dept., Reuters, Bloomberg)

Mortgage Rates Rise To Seven Year High – Housing Market Review

Thirty-year mortgage rates have surged to the highest levels in seven years, increasing borrowing costs at a time when the housing market is slowing and prices have been falling. The 4.86% conforming rate at the end of October was the highest rate since April 2011, according to data from Freddie Mac. The average 15-year conforming mortgage rate climbed to 4.29% over the same period of time.

Optimism about economic growth has led to higher inflationary expectations, which eventually translate into higher interest rates and mortgage rates. Over the past two years, the yield on the 10-year U.S. Treasury has increased from a historical low of 1.35% in 2016 to 3.15% at the end of October. As a gauge for mortgage rates nationally, the increase in the 10-year Treasury has led to an overall increase in mortgage rates. The concern economists have is that as mortgage rates continue to increase, home sales and affordability may begin to falter. 
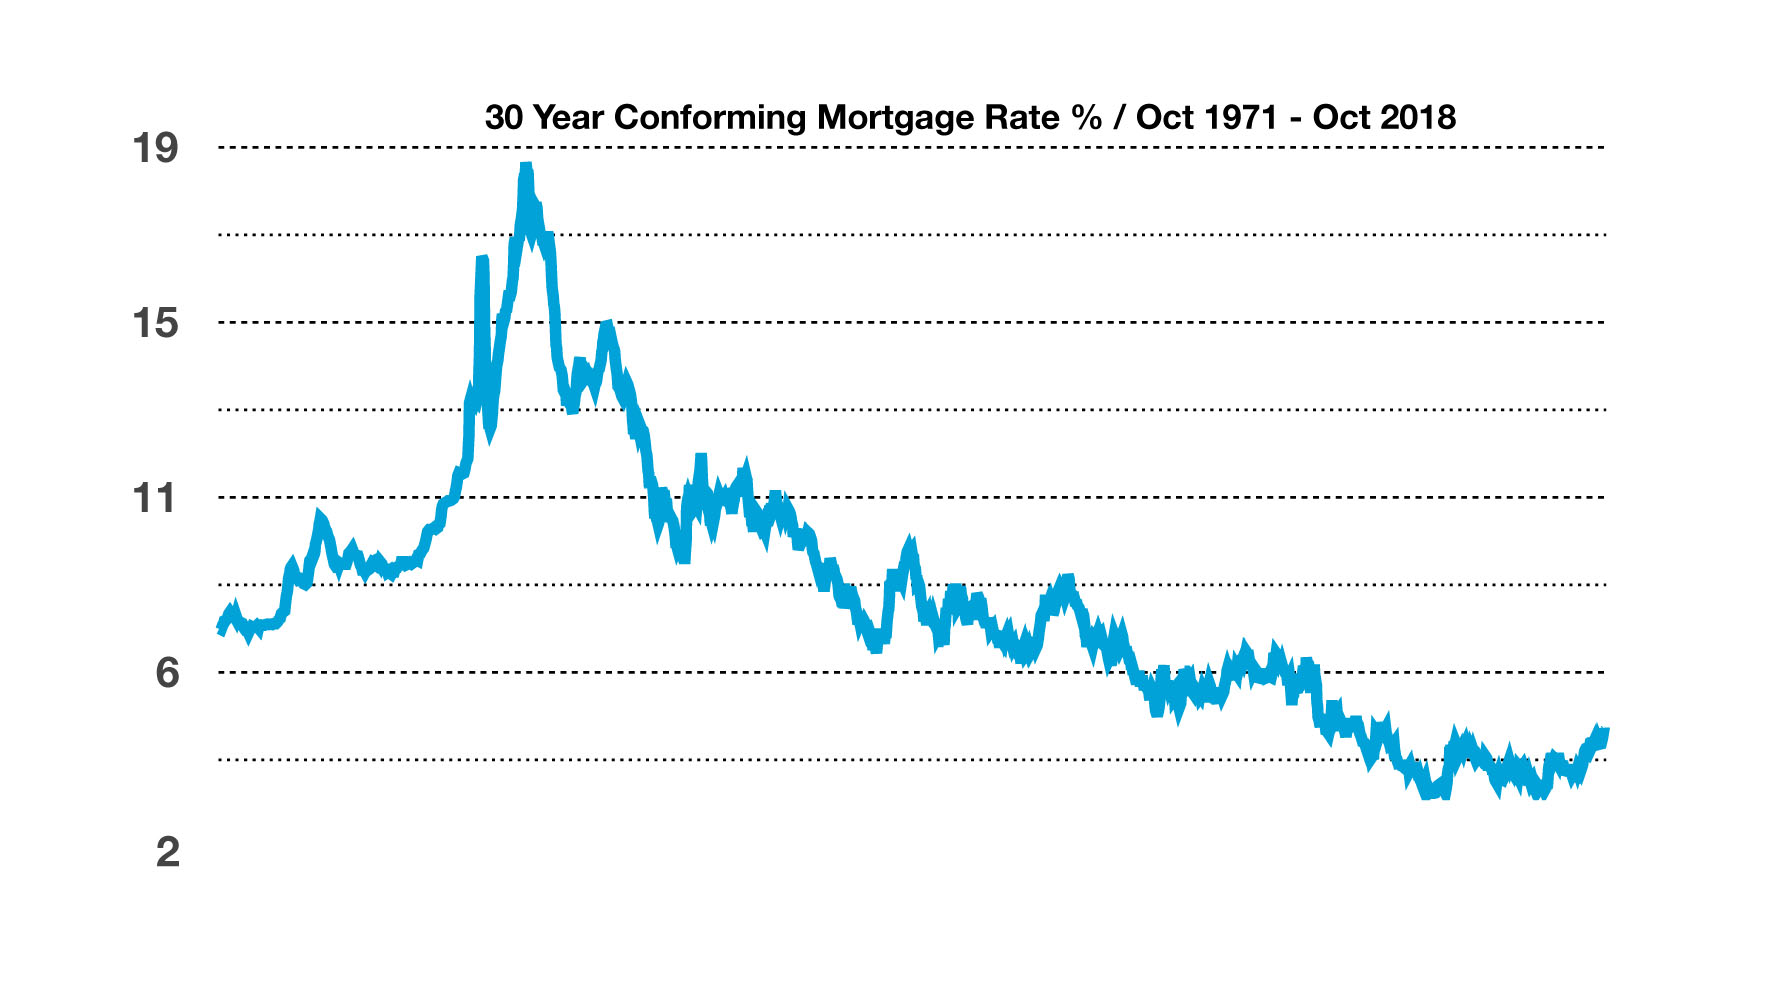
A tight job market and rising wages may help alleviate the rise in mortgage rates, as a strong labor market and higher payrolls help maintain demand for homes.

Even with the recent rise in mortgage rates, rates are still low on a historical basis. As of this past month, the average mortgage rate since 1971 has been approximately 8.09%. Over the past 46 years, mortgage rates have transitioned from the 5% range in the early 70s to over 14% in the late 70s and early 80s, with the 30-year conforming rate hitting a record high of 16.63% in 1981.

(Sources: Freddie Mac, Bloomberg, U.S. Treasury)

 
China will rely on energy imports for 80% of the country’s energy needs by 2040

Yields On A Rise – Fixed Income Overview

Yields rose across all fixed income sectors in October, with the benchmark 10-year U.S. Treasury yield rising from 2.99% to 3.23% mid-month. Even with the current rise in rates, yields are still below historical averages.

Some analysts are expecting a slow and moderate rise in rates over the next few months as the Fed orchestrates its monetary policy strategy. There is a growing consensus among analysts that the Federal Reserve is raising rates in order to have the ability to lower rates as a stimulus, should an economic slowdown ensue.

As long as economic growth prevails, heavily-leveraged companies have the ability to expand during a healthy economic environment.

A positive dynamic noted by economists and analysts is that a recession may be averted as the yield curve has not inverted, meaning that long-term rates are still higher than short-term rates. (Sources: U.S. Treasury Department)

China Not Placing Tariffs On Imported Oil From U.S. – International Trade

Part of the tariffs imposed by China on U.S. goods from the United States included crude oil when first announced in June. The Chinese have since reconsidered the tariff and have left it off the initial list of $16 billion worth of U.S. imports.

As reliance on imported oil has dramatically fallen for the United States, the reliance has increased for China. The International Energy Agency (IEA) estimates that China will rely on energy imports for 80% of the country’s energy needs by 2040, up from 70% currently.

Refineries in China have become accustomed to the higher quality of light sweet crude oil imported from the U.S., among the easiest and least expensive to refine in the world. China’s largest suppliers of oil are currently Russia and Saudi Arabia, supplying a heavier and more costly crude to refine than U.S. crude oil. Many analysts believe that even if China does eventually place tariffs on American oil imports, other buyers in Asia will step in and buy the supply due to the favorable characteristics.

(Sources: U.S. Dept. of Energy, IEA, Commerce Dept.)


The 2.8% increase is the largest increase since a 3.6% increase in 2012.

Social Security Payments Increasing By 2.8% – Retirement Planning

Social Security recipients are due to receive the largest increase in benefits in seven years. But for many recipients, the increase in payments will go towards higher Medicare costs. As of September 2018, over 67.6 million Americans currently receive Social Security benefit payments, with 46.3 million aged 65 or older.

The Social Security Administration announced a 2.8% increase in benefit payments effective in late December 2018 for disability beneficiaries and in January 2019 for retired beneficiaries. The 2.8% increase is the largest increase since a 3.6% increase in 2012. Many are concerned that the 2.8% increase may not cover expenses that are rising at a faster rate, including other essential items such as food and housing. The latest increase also affects the premiums for Medicare Part B, which covers doctor visits and outpatient care. Medicare premiums are expected to increase at the beginning of the year, minimizing net increases in Social Security payments.

The establishment of Social Security occurred on August 14, 1935, when President Roosevelt signed the Social Security Act into law. Since then, Social Security has provided millions of Americans with benefit payments. The payments are subject to automatic increases based on inflation, also known as cost-of-living adjustments or COLAs which have been in effect since 1975. Over the years, recipients have received varying increases depending on the inflation rate. With low current inflation levels, increases in benefit payments have been subdued relative to years with higher inflation. The COLA adjustment for 2019 is 2.8%, a steep increase from the 2017 adjustment of only 0.3%.

Over the decades, Americans have become increasingly dependent on Social Security payments, however, for some Americans it may not be enough to rely on Social Security alone. Unfortunately, Social Security is a major source of income for many of the elderly, where nine out of ten retirees 65 years of age and older receive benefit payments representing an average of 41% of their income. Over the years, Social Security benefits have come under more pressure due to the fact that retirees are living longer. In 1940, the life expectancy of a 65-year old was 14 years, today it’s about 20 years. By 2036, there will be almost twice as many older Americans eligible for benefits as today, from 41.9 million to 78.1 million. There are currently 2.9 workers for each Social Security beneficiary, by 2036 there will be 2.1 workers for every beneficiary. (Source: Social Security Administration)

 
Every 2 years the full House and one-third of the Senate are up for re-election.

Midterm Elections: What Do They Mean for Markets?

While the outcomes of the elections are uncertain, one thing we can count on is that plenty of opinions and prognostications will be floated in the days to come. In financial circles, this will almost assuredly include any potential for perceived impact on markets. But should long-term investors focus on midterm elections?

Markets Work
We would caution investors against making short-term changes to a long-term plan to try to profit or avoid losses from changes in the political winds. For context, it is helpful to think of markets as a powerful information-processing machine. The combined impact of millions of investors placing billions of dollars’ worth of trades each day results in market prices that incorporate the aggregate expectations of those investors. This makes outguessing market prices consistently very difficult.[1] While surprises can and do happen in elections, the surprises don’t always lead to clear-cut outcomes for investors.

The 2016 presidential election serves as a recent example of this. There were a variety of opinions about how the election would impact markets, but many articles at the time posited that stocks would fall if Trump were elected.[2] The day following President Trump’s win, however, the S&P 500 Index closed 1.1% higher. So even if an investor would have correctly predicted the election outcome (which was not apparent in pre-el
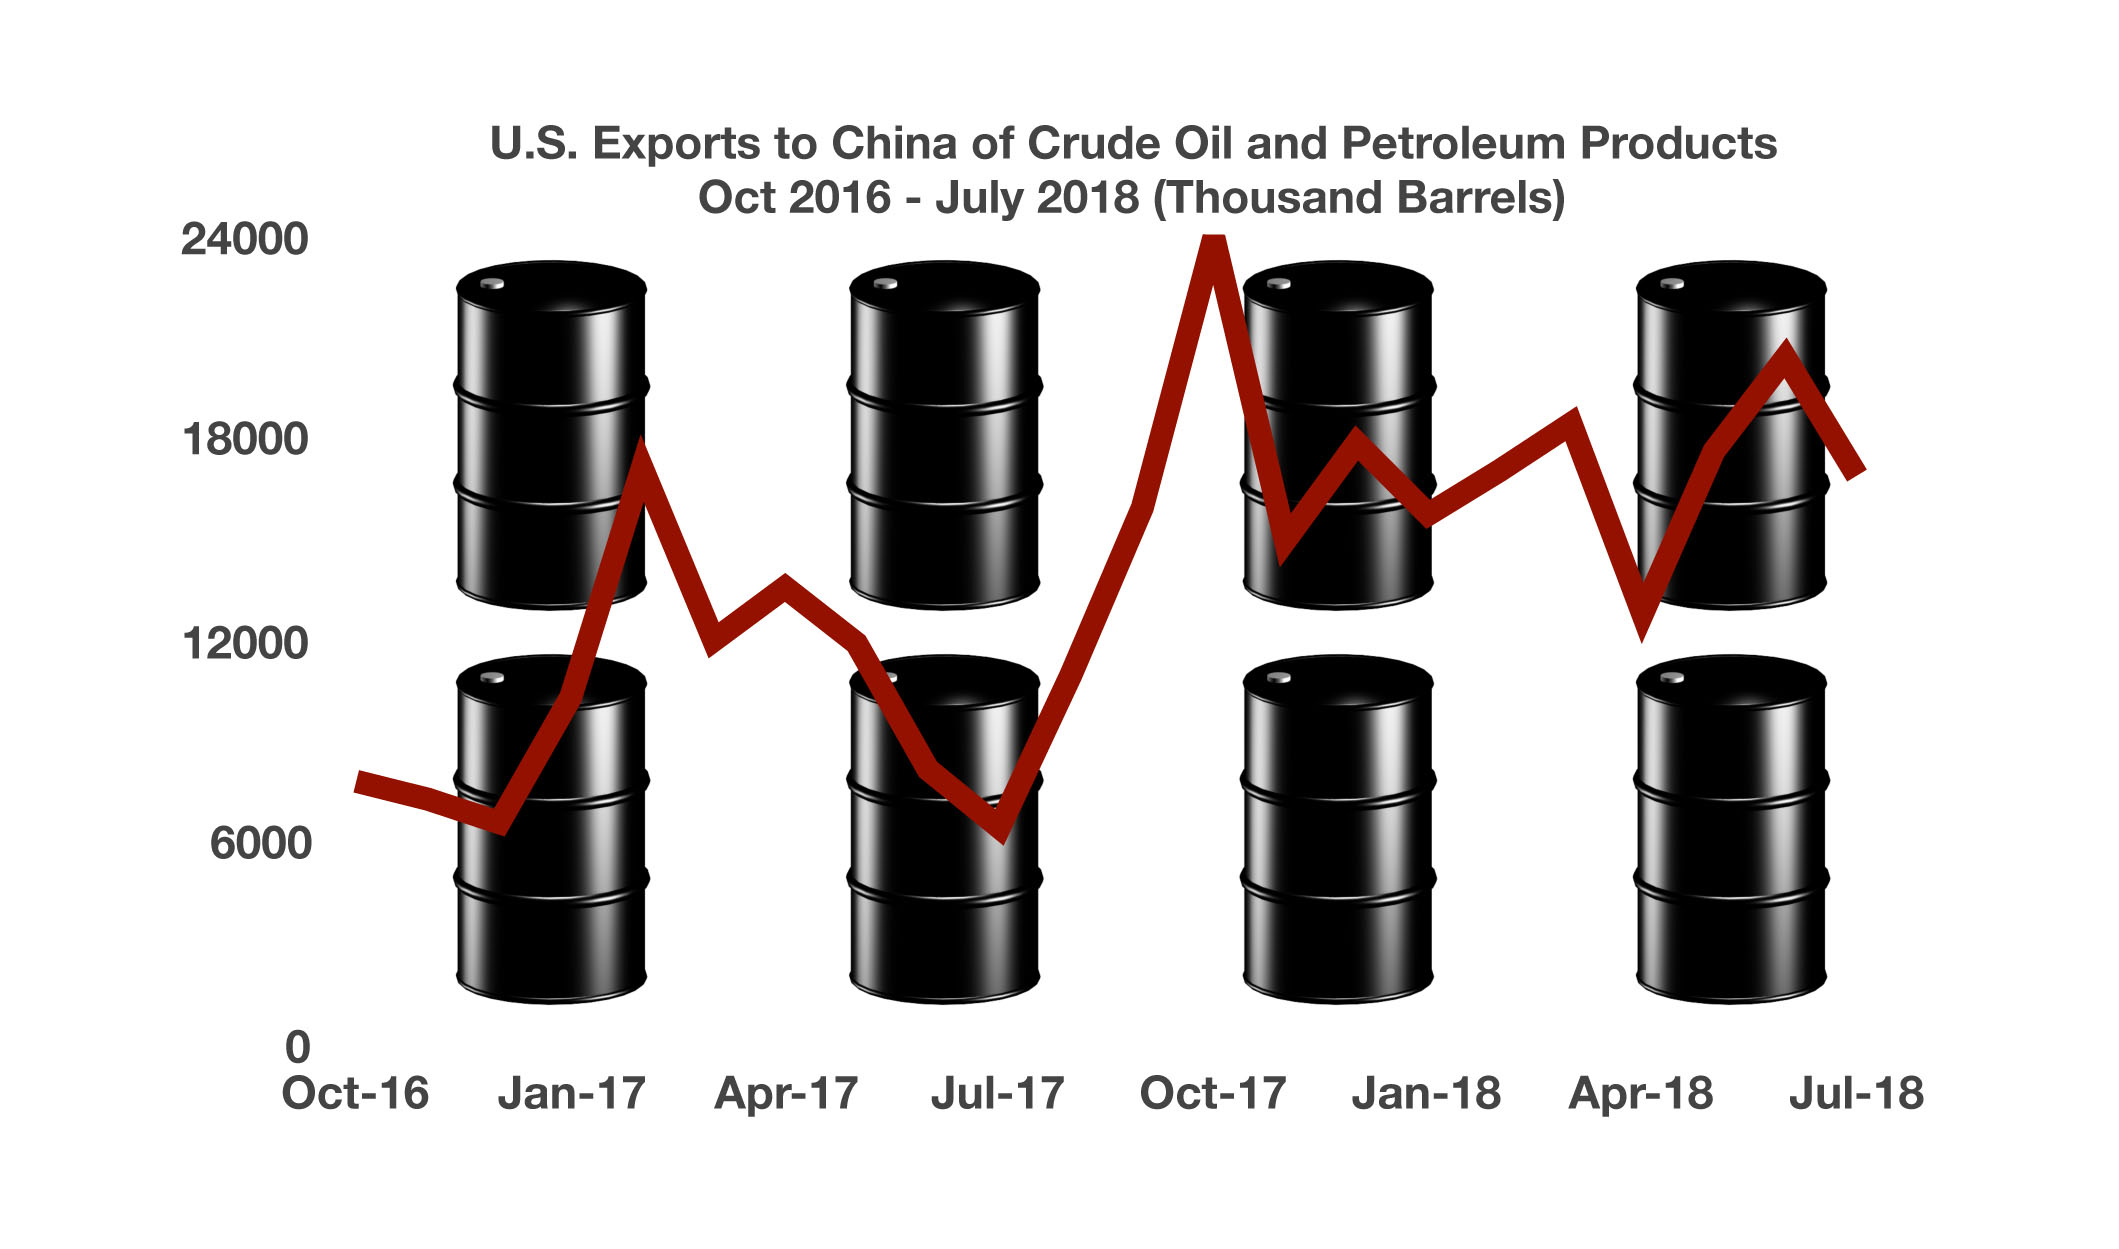
ection polling), there is no guarantee that they would have predicted the correct directional move, especially given the narrative at the time.

But what about congressional elections? For the upcoming midterms, market strategists and news outlets are still likely to offer opinions on who will win and what impact it will have on markets. However, data for the stock market going back to 1926 shows that returns in months when midterm elections took place did not tend to be that different from returns in any other month.

Exhibit 1 shows the frequency of monthly returns (expressed in 1% increments) for the S&P 500 Index from January 1926–August 2018. Each horizontal dash represents one month, and each vertical bar shows the cumulative number of months for which returns were within a given 1% range (e.g., the tallest bar shows all months where returns were between 1% and 2%). The blue and red horizontal lines represent months during which a midterm election was held, with red meaning Republicans won or maintained majorities in both chambers of Congress, and blue representing the same for Democrats. Striped boxes indicate mixed control, where one party controls the House of Representatives, and the other controls the Senate, while gray boxes represent non-election months. This graphic illustrates that election month returns were well within the typical range of returns, regardless of which party won the election. Results similarly appeared random when looking at all Congressional elections (midterm and presidential) and for annual returns (both the year of the election and the year after). {continued on page 6}


Investment returns not dependent on party in control of Congress

{Midterm Elections continued}

Exhibit 1.    Midterm Elections and S&P 500 Index Returns, Histogram of Monthly Returns January 1926–August 2018

Past performance is not a guarantee of future results. Indices are not available for direct investment; therefore, their performance does not reflect the expenses associated with the management of an actual portfolio. S&P data © 2018 S&P Dow Jones Indices LLC, a division of S&P Global. All rights reserved.

In It For The Long Haul
While it can be easy to get distracted by month-to-month or even one-year returns, what really matters for long-term investors is how their wealth grows over longer periods of time. Exhibit 2 shows the hypothetical growth of wealth for an investor who put $1 in the S&P 500 Index in January 1926. Again, the chart lays out party control of Congress over time. And again, both parties have periods of significant growth and significant declines during their time of majority rule. {continued on page 7}

 
Investing is a long-term endeavor requiring discipline and patience

{Midterm Elections continued}

However, there does not appear to be a pattern of stronger returns when any specific party is in control of Congress, or when there is mixed control for that matter. Markets have historically continued to provide returns over the long run irrespective of (and perhaps for those who are tired of hearing political ads, even in spite of) which party is in power at any given time.

Exhibit 2. Hypothetical Growth of $1 Invested in the S&P 500 Index and Party Control of Congress January 1926–August 2018

Past performance is not a guarantee of future results. Indices are not available for direct investment; therefore, their performance does not reflect the expenses associated with the management of an actual portfolio. S&P data © 2018 S&P Dow Jones Indices LLC, a division of S&P Global. All rights reserved.

Equity markets can help investors grow their assets, and we believe investing is a long-term endeavor. Trying to make investment decisions based on the outcome of elections is unlikely to result in reliable excess returns for investors. At best, any positive outcome based on such a strategy will likely be the result of random luck. At worst, it can lead to costly mistakes. Accordingly, there is a strong case for investors to rely on patience and portfolio structure, rather than trying to outguess the market, to pursue investment returns.

[1]. This is known as the efficient market theory, which postulates that market prices reflect the knowledge and expectations of all investors and that any new development is instantaneously priced into a security.
[2]. Examples include: “A Trump win would sink stocks. What about Clinton?” CNN Money, 10/4/16, “What do financial markets think of the 2016 election?” Brookings Institution, 10/21/16, “What Happens to the Markets if Donald Trump Wins?” New York Times, 10/31/16.

 
Dollar has seen consistent & steady increase since beginning of the year

The Dollar’s Supremacy – Currency Update

Some believe that the dollar’s rise may continue as investors seek stability in the world’s healthiest economy. U.S. capital markets remain the largest and most liquid of all financial markets globally, attracting international investors. The Trade Weighted U.S. Dollar Index, as compiled and tracked by the Federal Reserve, has seen a consistent and steady increase since the beginning of the year. 

A challenge at home when the dollar rises is the dynamic of U.S. exports becoming more expensive worldwide. As the dollar increases in value versus other currencies, U.S. exported goods become less affordable in the international markets. Conversely, the strengthening dollar has also made it more affordable for imported goods, which become less expensive as the dollar elevates.

In the $5.1 trillion daily foreign exchange market, the U.S. dollar accounts for about 88% of all transactions, according to the Bank for International Settlements. The dollar is also the ruling reserve currency accounting for 62.5% of the $10.4 trillion in allocated reserves, as tracked by the International Monetary Fund (IMF).  Sources: U.S. Commerce Dept., Eurostat, IMF: World Currency Composition

65 Year Olds Projected To Exceed 18 Year Olds – Demographics

Demographics and population data are carefully tracked by the Census Bureau in order to better determine what the United States may look like in the future.

Over 73 million minors, under 18 years of age, currently out number 49 million older Americans, 65 and over. Younger citizens help spur economic growth and provide essential workers for the labor market. The demographical make-up of the country has been driven by the baby boom generation for decades. Those born   
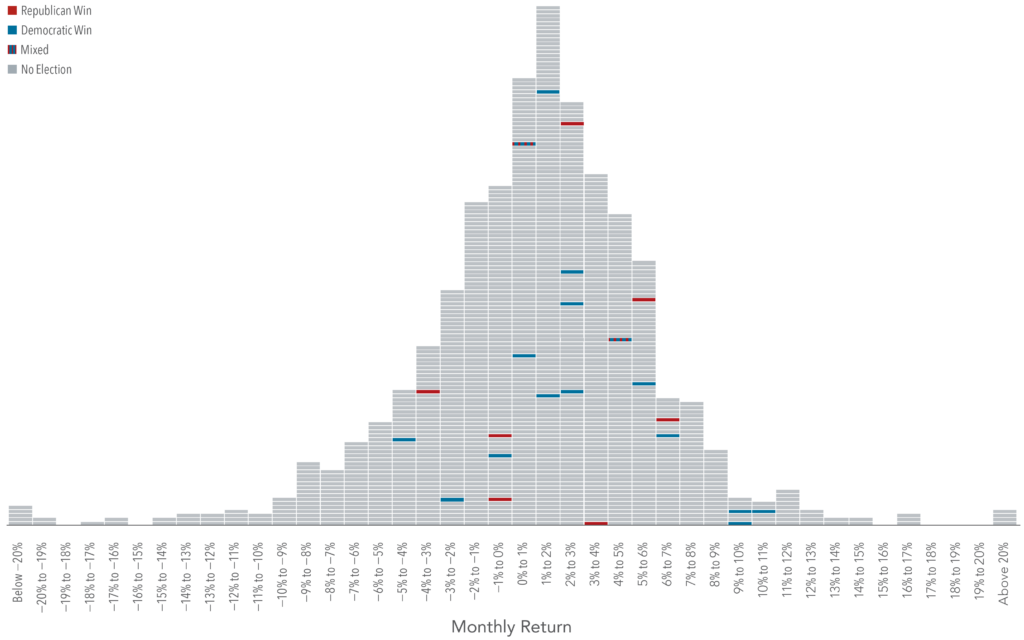
between 1946 – 1964 have shaped the economic status of our country while providing economic growth and vitally skilled workers. The first wave of baby boomers reached 65 years of age in 2011, starting a massive shift of individuals from working status to retirement status.

The Census Bureau estimates that by 2035, those age 65 and older will begin to out number 18 and under. The number of 65 year olds and older will rise much faster than those 18 and younger creating a strain on the U.S. job market and economy. The shrinking pool of minors will eventually lead to lower population growth thus creating a drag on economic growth. A growing elderly population is expected to impact already strained Medicare and Social Security benefits.  (Source: U.S. Census Bureau)