November 2019
Market Update
(all values as of 09.30.2024)

Stock Indices:

Dow Jones 42,330
S&P 500 5,762
Nasdaq 18,189

Bond Sector Yields:

2 Yr Treasury 3.66%
10 Yr Treasury 3.81%
10 Yr Municipal 2.63%
High Yield 6.66%

YTD Market Returns:

Dow Jones 12.31%
S&P 500 20.81%
Nasdaq 21.17%
MSCI-EAFE 12.90%
MSCI-Europe 12.10%
MSCI-Pacific 13.80%
MSCI-Emg Mkt 16.80%
 
US Agg Bond 4.44%
US Corp Bond 5.32%
US Gov’t Bond 4.39%

Commodity Prices:

Gold 2,657
Silver 31.48
Oil (WTI) 68.27

Currencies:

Dollar / Euro 1.11
Dollar / Pound 1.33
Yen / Dollar 142.21
Canadian /Dollar 0.73
 

Macro Overview

Equity markets defied the historically negative month of October with equity indices moving higher despite ongoing trade dispute uncertainty and growing concerns of global economic headwinds.

Major domestic and international equity indices rose in sync as interest rates remained low worldwide, driving assets into stocks. Monetary policy that prompted rate cuts by central banks around the world are expected to provide stimulus and bolster global growth as the cost to borrow remains low.

Some concerns do exist surrounding a global economic slowdown, with attention on economic data becoming a focal point for analysts and economists. U.S. equities have continued to perform as a result of an accommodative monetary policy driven by the Federal Reserve and consistent consumer demand which have buoyed stock valuations.

Trade talks between the U.S. and China have continued to roil markets as inconsistent messages regarding any progress on trade discussions have not yielded any formal trade agreements. The ongoing trade dispute has brought about revisions to economic growth estimates by economists and international organizations such as the International Monetary Fund (IMF) and the World Trade Bank.

Bond yields rose in October, a possible indication that growth dynamics are propelling some prices and interest rates higher. Economists view a slight rise in rates optimistically due to healthy economic forces driving expansion. Treasury bond yields saw modest increases in October, with the 10-year Treasury yield rising to 1.69% on October 31st from 1.68% on September 30th.

The Federal Reserve cut its key interest rate for the third time this year. The most recent cut in late October was preceded by two cuts earlier in the year, the first in July and the second in September. The Fed hinted that no further rate cuts were anticipated unless weaker economic data warranted additional cuts.

The Treasury and the Federal Reserve are closely monitoring the possibility of year end volatility when banks are hesitant to part with cash reserves, which affects money markets. Short-term rates briefly spiked in September as the cost for banks to borrow cash against Treasuries jumped. Banks actively participate in Fed driven strategies that indirectly affect short-term rates and liquidity in the bond markets.

Following several failed attempts to formally extract Great Britain from the European Union (EU), also known as Brexit, the prime minister of Great Britain has given the vote back to the people of Great Britain with an election on December 12th. British voters originally voted on exiting the EU in 2016, but with no formal agreement ever having been reached between the British government and the EU. The vote is expected to garner enormous attention from other EU countries considering an EU exit vote.

Sources: Federal Reserve, U.S. Treasury, EuroStat
 
the cost of health insurance has climbed over 18% in the past year

Stock Indices Move Higher In October – Global Equity Review

Both domestic and international equity markets advanced in October, lodging new highs for various indices. The S&P 500 Index and the Nasdaq Index both closed at record levels as of November 1st. Developed and emerging market indices propelled higher in October buoyed by a continued low rate environment and a weaker dollar.

Volatility, as measured by the Chicago Board Options Exchange (CBOE) Volatility Index, or VIX, fell to a near annual low in October, as subdued risk concerns dominated.

The technology and health care sectors were the top performing large cap sectors in October, with energy as the worst performing sector in the S&P 500 Index. Market analysts are seeing a shift or rotation towards value from growth, reminiscent of a more cautionary environment. (Sources: S&P, CBOE, Bloomberg)

Bond Yields Stabilize – Fixed Income Overview

The Federal Reserve injected additional amounts of funds into the overnight lending markets, also known as the repo market, in October. The move served to dampen concerns that a repeat of volatility that hit markets in December 2018 would occur again.

The Federal Reserve cut interest rates for the third time this year but signaled that it would not cut them further unless economic growth slowed amid concerns.

Yields on government and corporate bonds remained stable in October as expectations of economic growth and a pause to further rate cuts stabilized bond markets. Bond prices have risen since the beginning of the year, with government and corporate bond yields still hovering near record low levels. Bond prices move in the opposite direction to yields.(Sources: Federal Reserve, U.S. Treasury)

What Prices Have Changed The Most – Consumer Markets

Government agencies compile and track prices on a multitude of products from various sources. Dramatic price swings help economists determine who may be influenced and how the overall economy may be affected.

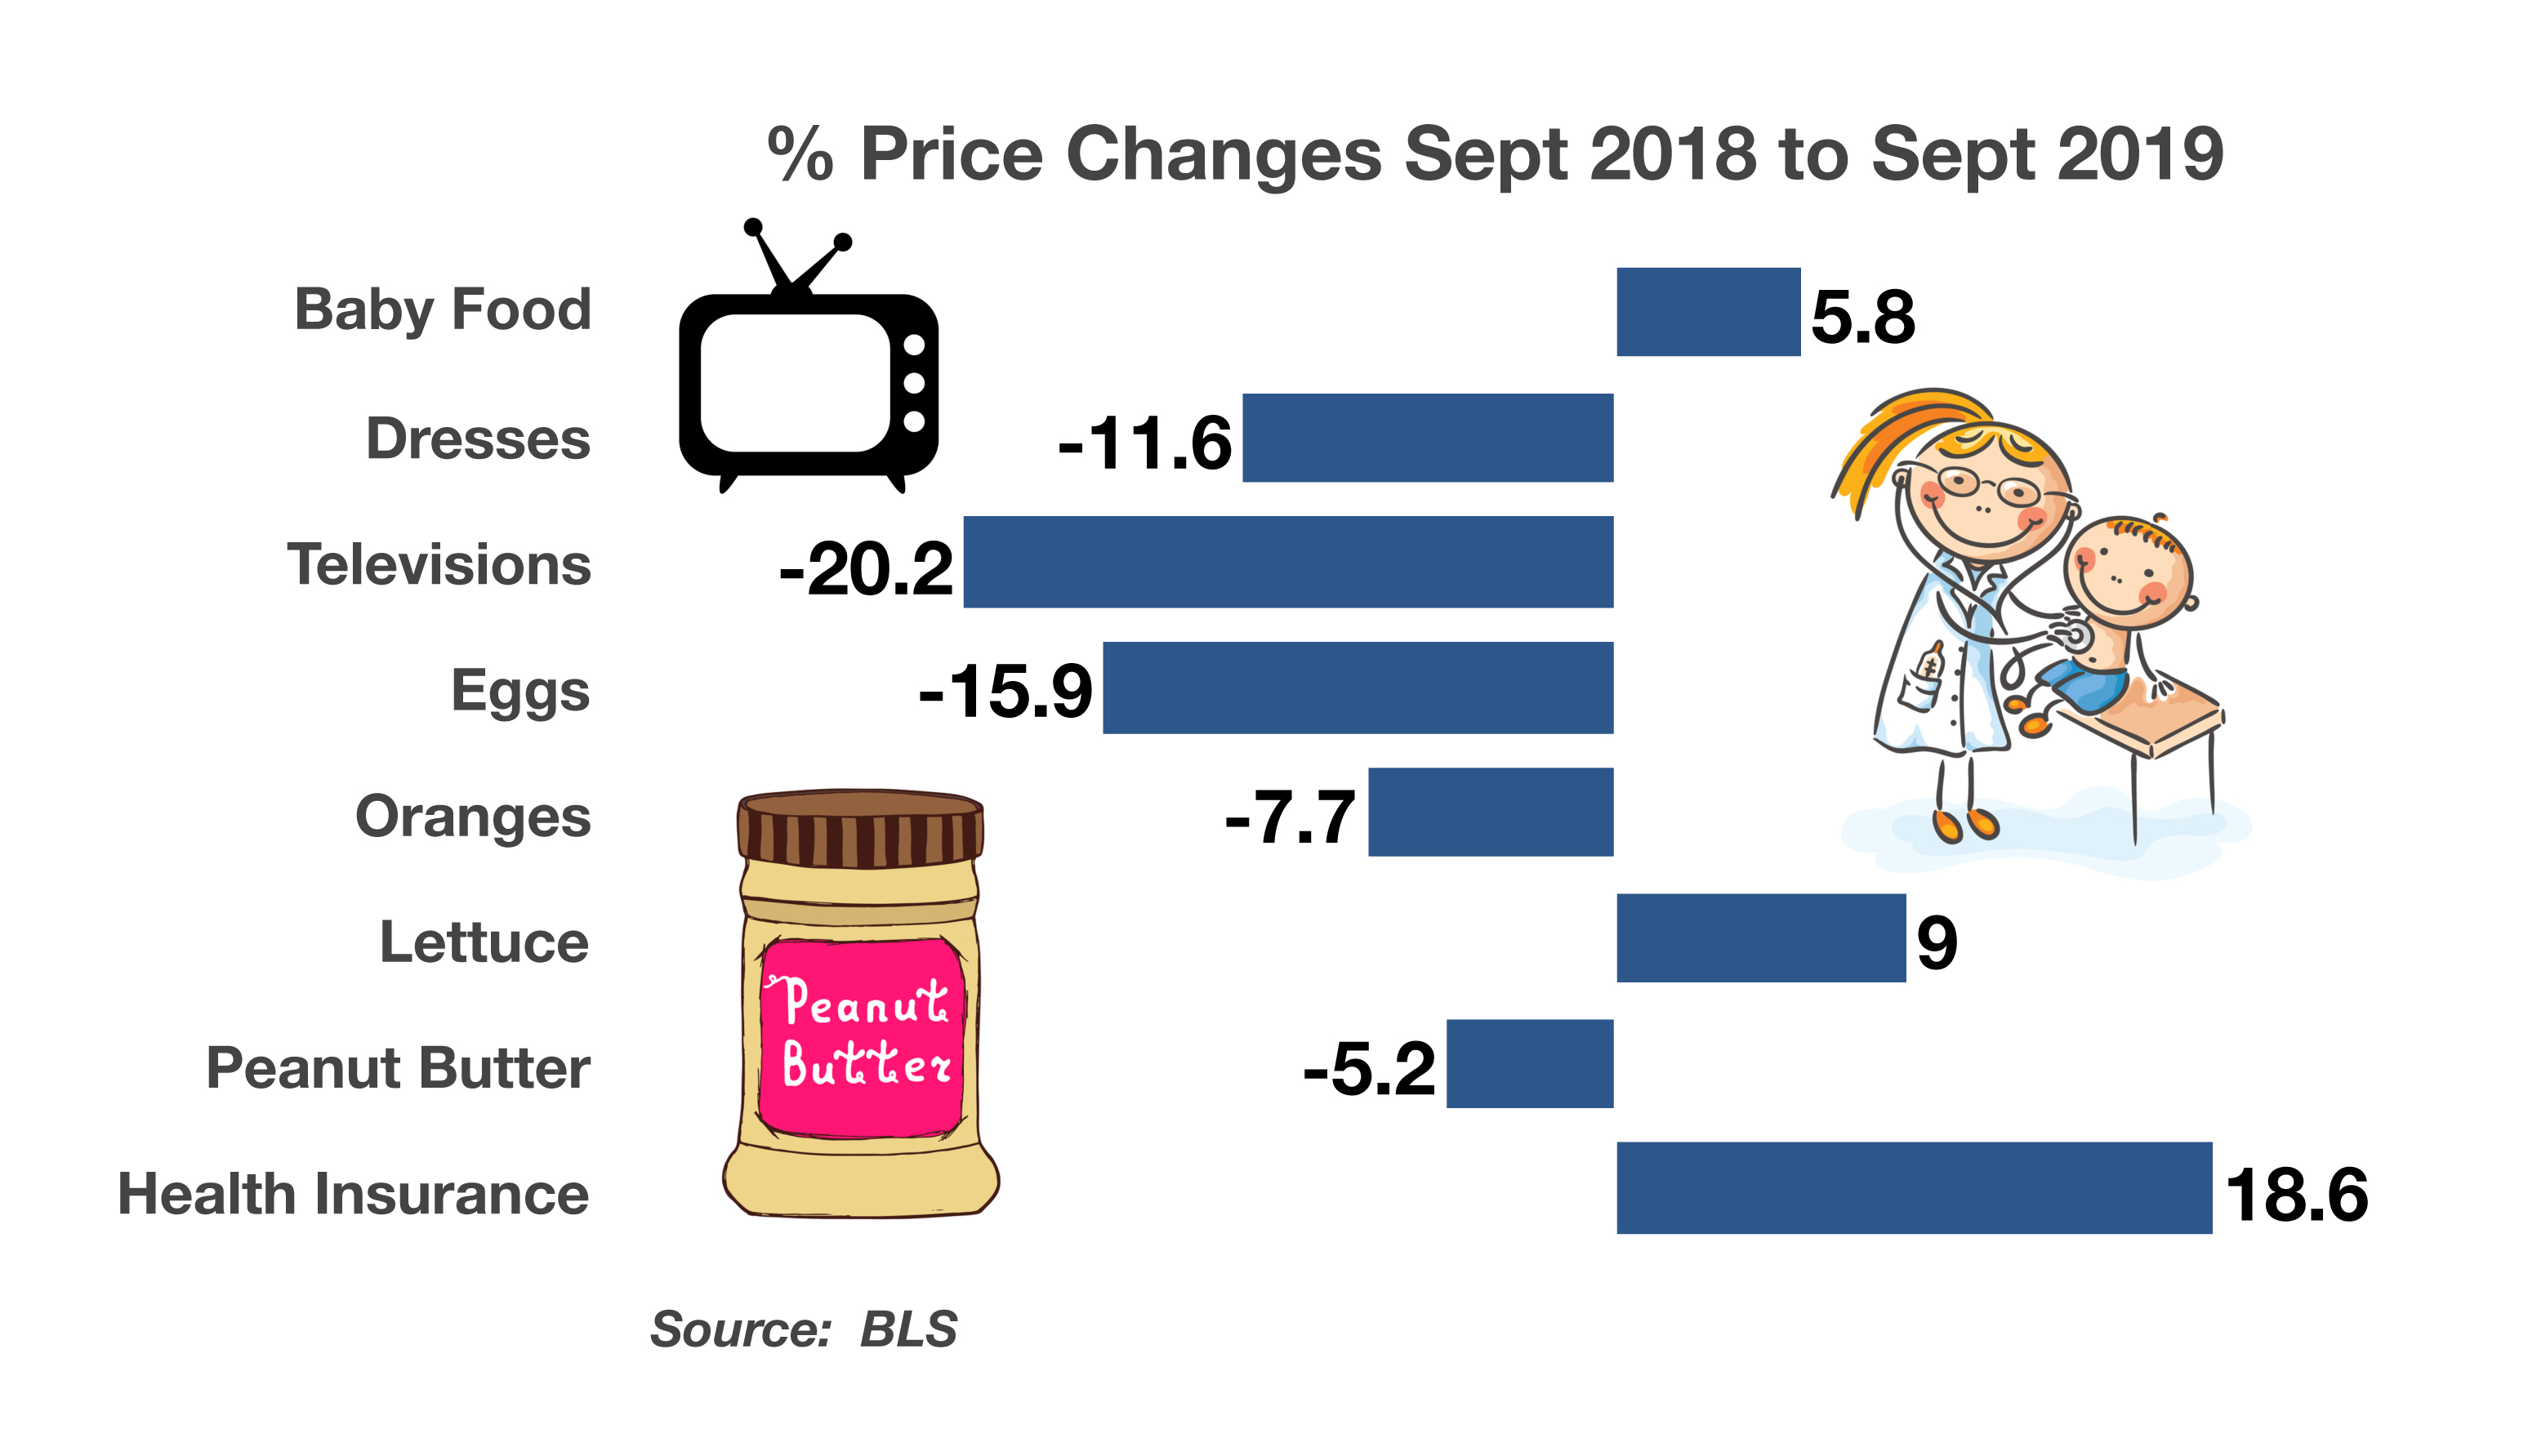
Price changes on certain products tend to affect a larger portion of the population more so than other products. Over the past year, the cost of health insurance has climbed over 18%, affecting nearly everyone paying for health coverage. However, the increase in baby food of 5.8% over the same period is limited to younger families across the country.

Televisions, dresses, and eggs saw formidable price drops over the past year, affecting a more concentrated group of consumers.

Source: Bureau of Labor Statistics

 
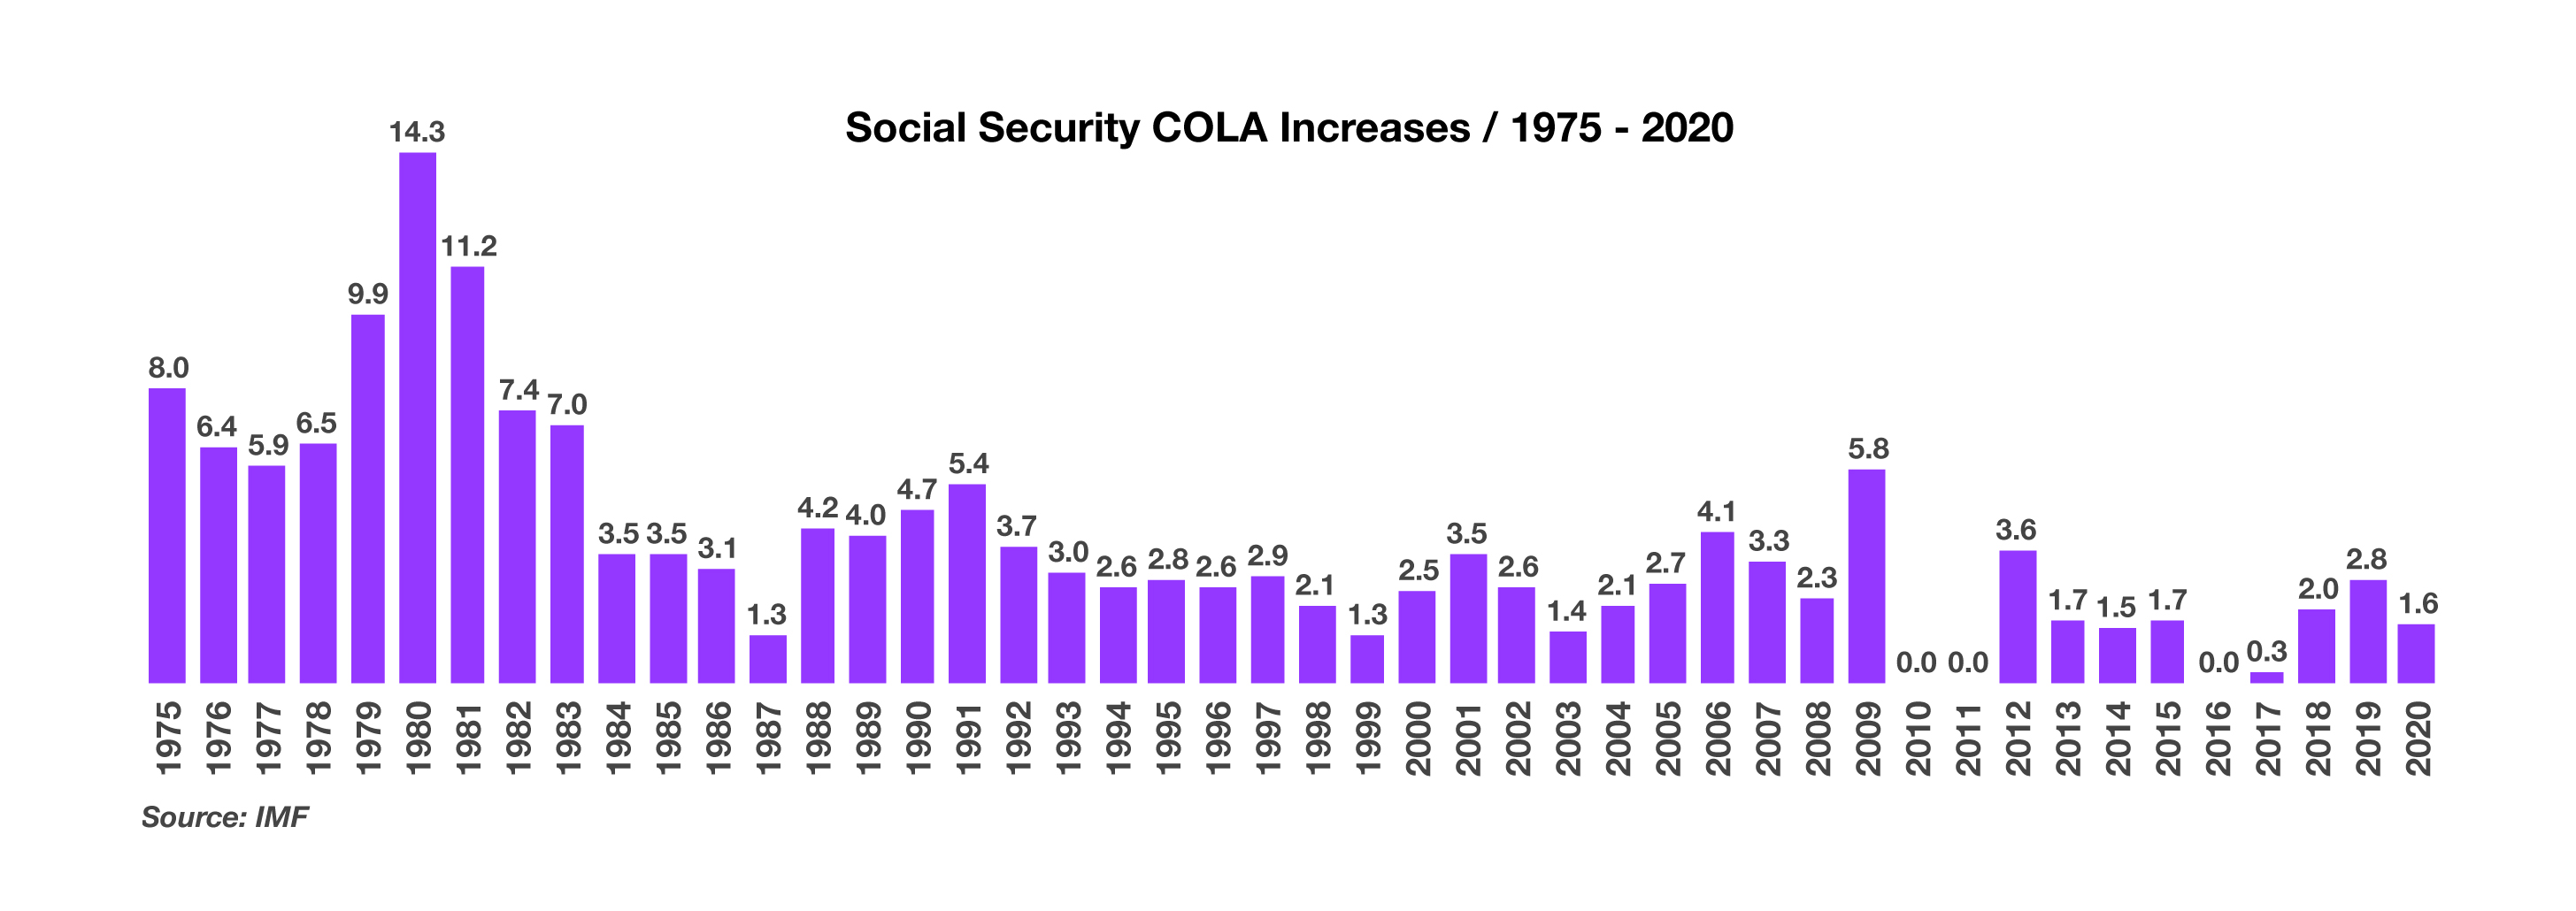
The Social Security Administration announced a 1.6% increase in payments for 2020

Social Security Payments Increasing By 1.6% For 2020 – Retirement Planning

Social Security recipients are due to receive a modest increase in benefit payments payable in 2020. But for many recipients, the increase in payments will go towards higher Medicare costs. The increase will affect over 63 million Americans receiving Social Security benefit payments.

The Social Security Administration announced a 1.6% increase in benefit payments effective in late December 2019 for disability beneficiaries and in January 2020 for retired beneficiaries. The 1.6% increase is slightly less than the increase of 2.8% for 2019.

Many are concerned that the 1.6% increase may not cover expenses that are rising at a faster rate, including other essential items such as food and housing.

The establishment of Social Security occurred on August 14, 1935, when President Roosevelt signed the Social Security Act into law. Since then, Social Security has provided millions of Americans with benefit payments. The payments are subject to automatic increases based on inflation, also known as cost-of-living adjustments or COLAs, which have been in effect since 1975. Over the years, recipients have received varying increases depending on the inflation rate. With low current inflation levels, increases in benefit payments have been subdued relative to years with higher inflation.

Over the decades, Americans have become increasingly dependent on Social Security payments, however, for some Americans it may not be enough to rely on Social Security alone. Unfortunately, Social Security is a major source of income for many of the elderly, where nine out of ten retirees 65 years of age and older receive benefit payments representing an average of 41% of their income. Over the years, Social Security benefits have come under more pressure due to the fact that retirees are living longer. In 1940, the life expectancy of a 65-year old was 14 years, today it’s about 20 years.

By 2036, there will be almost twice as many older Americans eligible for benefits as today, from 41.9 million to 78.1 million. There are currently 2.9 workers for each Social Security beneficiary, by 2036 there will be 2.1 workers for every beneficiary.

Source: Social Security Administration, https://www.ssa.gov/news/cola/

 
25 million taxpayers replaced itemized deductions with standard deductions

Tax Actions To Consider As The Year End Approaches – Tax Planning

The Tax Cuts & Jobs Act passed in 2017, brought about various tax changes that affected most individual tax payers. Following are various changes to consider as we reach the end of the year.

Withholdings & Estimates:

Withholdings and estimated taxes should be verified before year end, as the IRS withholding tables have been unclear since the tax law changes. Employees should check their withholdings before year end and make any necessary adjustments. Quarterly payments made by business owners and 1099 taxpayers should be caught up and revised.

Most taxpayers must pay 90% of their income and self-employment taxes by year end or face penalties. This past tax season, the IRS forgave these penalties for some taxpayers, but intends to enforce them this year.

Itemized Deductions:

Of the various changes that came about by the new tax rules, itemized deductions affected essentially all taxpayers. Over 25 million taxpayers opted to replace itemized deductions with a standardized deduction. The increase in the standard deduction to $12,200 for single filers and $24,400 for married couples simplified the deduction quandary for many taxpayers. Simply taking the standard deduction fulfilled and exceeded itemized deductions for many, with no need for receipts or documentation to back up submitted expenses.

Retirement Savings Deadlines:

IRAs and Roth IRAs for tax year 2019 can be opened and funded up to April 15, 2020.

Self employed earners may have up to October 15, 2020, to set up and fund a SEP IRA if filing an extension for the business return. Solo, or one person, 401k plans must be set up before December 31, 2019, but may be funded thereafter depending on the details of the plan.

Required Minimum Distributions:

IRA owners over the age of 70.5 are required to take a minimum distribution, also known as a RMD, before December 31, 2019. Congress is currently considering increasing the RMD age to 72, but it hasn’t been signed into legislation yet.

A single RMD may be taken for multiple IRAs, but an RMD must be taken from each individual 401k account if more than one exists. This is starting to affect more taxpayers since more retirees are leaving retirement plan balances in their 401k plans.

Sources: Tax Policy Center, Tax Foundation, IRS

 
Performance Review

PERFORMANCE

2018

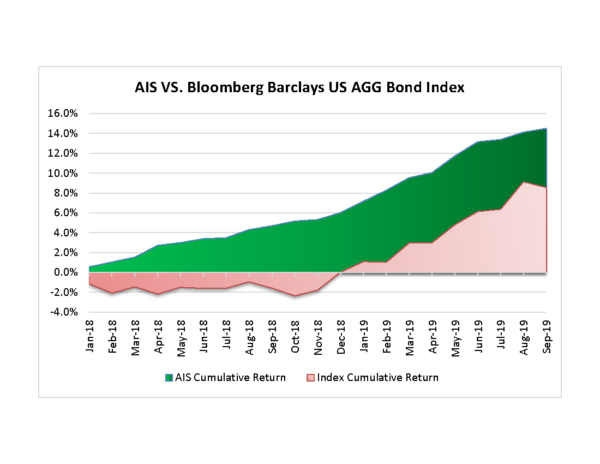
Last year (2018) was a lackluster year for bond investors – the index returned almost exactly 0%.  Remember it is not possible to invest in an index so most investors purchase funds which track the index meaning in 2018 most bond investors had negative returns after fund commissions, fees and expenses.  If you were unfortunate enough to pay an adviser to passively invest you into bond funds, you were likely down between 1%-2% for the year.  Our separately managed discretionary accounts (SMA’s) had an average return after fees of 6.015% in 2018 – a testament to active portfolio management in a tough interest rate and market environment.

2019

In 2019 the bond market has done some catching up with the index up 8.5% YTD through September. This performance is almost entirely attributable to the huge rally in bonds (lower interest rates).  This was especially pronounced in August as the 10-year treasury yield plummeted from slightly over 2% to under 1.5% sending the index up by almost 3% in one month.  YTD our SMA’s are up an average of 8%.  However, it is important to note that while we have under performed the index by 50 basis points on a risk-adjusted basis we are actually OUTPERFORMING the index.

RISK ADJUSTED RETURNS

The most common measure of risk-adjusted returns is the Sharpe ratio.   The Sharpe ratio is the average return earned in excess of the risk-free rate (treasury bills) per unit of volatility.  It is calculated by taking the excess return of the investment (return – risk free rate) and dividing it by the investments standard deviation.  The higher the number the better the risk-adjusted return.

On a monthly basis our average monthly return has been 0.654% vs. the index average monthly return of 0.395%.  The monthly risk free rate has been approximately 0.17% meaning our average excess monthly return has been 0.49% vs. the index excess return of 0.23% – our excess return has been more than DOUBLE the return of the index.

So what about the second part of the equation – volatility?  The index has a monthly standard deviation of 1.05%, our average monthly standard deviation has been less than HALF of the index at only 0.42%. On an annualized basis, our standard deviation was 1.87% vs. the index of 4.01%.

It should be clear where this is headed – DOUBLE THE RETURN WITH LESS THAN HALF THE VOLATILITY = a pretty impressive Sharpe ratio.  Our annualized Sharpe ratio is 5.22 vs. the index of 0.98% for the reporting period of Jan 2018 – Sept 2019.  It has been an extremely volatile 2-years for the index which has pushed the Sharpe ratio for the period well below it’s historical norm. Historically the index has had a Sharpe ratio in the 2 – 3 range which is still half the risk-adjusted return of our SMA’s.  The graphic on the next page shows our cumulative return as well as the returns and ratios for several of the largest bond funds.

 
RETURNS AND RATIOS

As the chart shows, our SMA’s have beaten the index by approximately 6% on a cumulative basis since inception and with half the volatility.  Note that for ALL of 2018 the index was down for the year and only  broke-even thanks to the high volatility in the stock market in the 3rd quarter which sent bond prices higher.

STANDARD DEVIATION SHARPE RATIO PERIOD RETURN
AIS SMA’S  1.87 5.22 14.50%
BOND INDEX FUND (AGG) 4.01 2.35 8.5%
PIMCO TOTAL RETURN FUND 3.93 1.87 8.70%
WESTERN ASSET CORE BOND FUND 3.93 2.71 10.28%
SEI INT DURATION BOND FUND 4.38 2.47 10.50%
VANGUARD INT BOND FUND 4.15 2.44 10.39%
FEDERATED HY FUND 5.01 1.41 9.30%


SUMMARY

Our outlook remains unchanged at cautiously optimistic.  As we wrote in our special report on recessions, the question isn’t if we will have a recession but when it will start and how deep will it be.  There have been many “one-off” warning signs in the last few months (such as the spike in overnight lending rates) that taken alone mean very little but in aggregate could spell trouble.  It is exactly these types of “cracks” that appear before a major market sell-off or recession.

Interest rates remain historically low and credit spreads are still extremely tight meaning investors are not getting rewarded for taking risk.  With interest rates at under 2% it is important for investors searching for income to find an active manager that can generate sufficient returns without taking unnecessary risk.  We recently put an article on our website discussing passive vs. active fixed income management that we encourage you to read.  As we stated, in 2018 the bond index returned 0% which means after fees most income investors lost money.  Our SMA’s earned 6% and while we probably do not have to say it – there is a big difference in the lifestyle you can expect in retirement earning 6% vs. 0% (or even -1% in most cases).

We continue to avoid risk in our portfolios, choosing to keep our duration at approximately 2-3 years and stay in high cash-flow and high credit quality positions.  As stated above and in multiple previous newsletters, not only are rates low but risk premiums are near the lowest in history and investors are not getting paid for taking risk.  For instance, you can purchase a short bond for either the same or higher yield than a longer maturity bond but short term bonds have very little price risk.

We believe a recession is eminent and would be surprised if we didn’t see some major volatility moving into next year and throughout next year.  We have written extensively about the debt and credit bubbles and at the risk of sounding insensitive we welcome it.  As regular readers know, it is during times of high volatility and major market disruptions that bonds become one of the best asset classes to purchase and we have positioned our portfolios to take advantage of the coming “opportunity of a lifetime” in the bond market.  During the great recession, even a novice could have locked in double-digit yields for a decade or longer (20+% was not uncommon) and we look forward to that opportunity.

As always, happy investing and we welcome any questions or input on the content of this newsletter.


Sincerely,

David Dellinger