Ocean Park Capital Management

2503 Main Street

Santa Monica, CA 90405

Main: 310.392.7300

Daily Performance Line:  310.281.8577

October 2019
Market Update
(all values as of 04.30.2024)

Stock Indices:

Dow Jones 37,815
S&P 500 5,035
Nasdaq 15,657

Bond Sector Yields:

2 Yr Treasury 5.04%
10 Yr Treasury 4.69%
10 Yr Municipal 2.80%
High Yield 7.99%

YTD Market Returns:

Dow Jones 0.34%
S&P 500 5.57%
Nasdaq 4.31%
MSCI-EAFE 1.98%
MSCI-Europe 2.05%
MSCI-Pacific 1.82%
MSCI-Emg Mkt 2.17%
 
US Agg Bond 0.50%
US Corp Bond 0.56%
US Gov’t Bond 0.48%

Commodity Prices:

Gold 2,297
Silver 26.58
Oil (WTI) 81.13

Currencies:

Dollar / Euro 1.07
Dollar / Pound 1.25
Yen / Dollar 156.66
Canadian /Dollar 0.79
 

Fund Overview

Equities gained ground in October, as did the Ocean Park funds.  Within our portfolio, technology stocks–particularly semiconductors—were strong while consumer stocks were relatively weak.  Our results were within the range of performance of the major indices (above the Dow, below the S&P and the NASDAQ).  We remain ahead of the HFRI Equity Hedge Index, which is up 9.25% for the year to date.

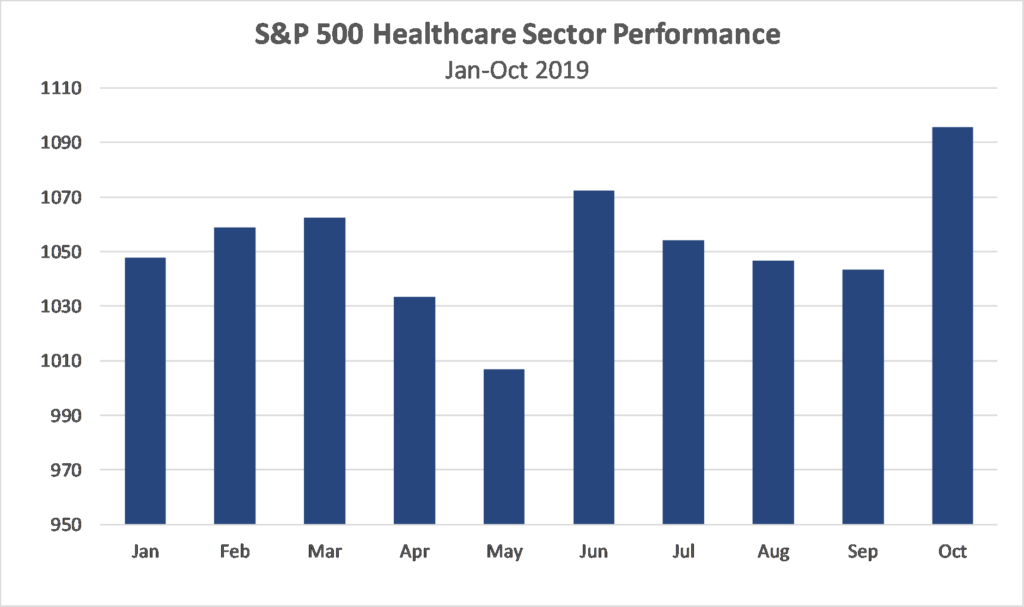
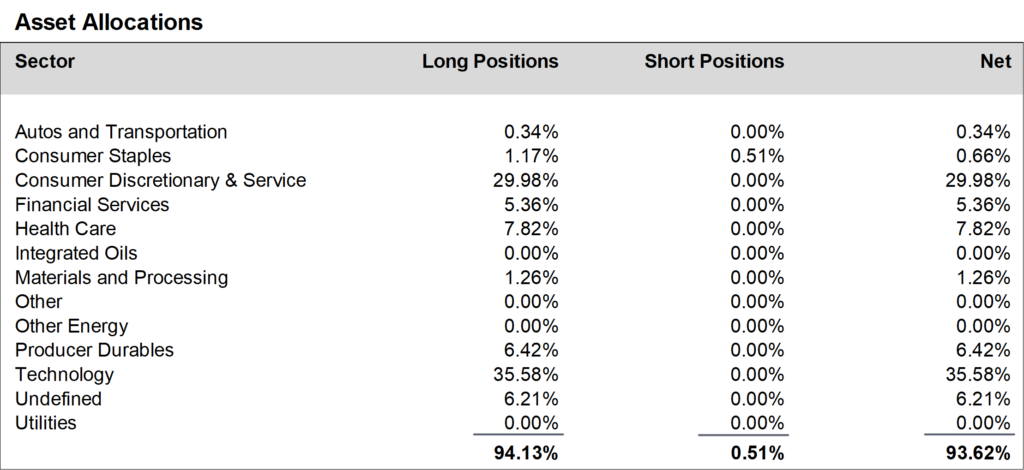
During October, we added to positions in the producer durables sector, and reduced positions in the health care and the consumer discretionary and service sectors.  We ended the month at about 94% net long, down from about 95% in September.

A schedule showing the performance of the Investors Fund is included below, along with our Asset Allocation Chart. Daily updates on our activity are available on our Results Line, at
310-281-8577, and current information is also maintained on our website at www.oceanparkcapital.com. To gain access to the site enter password opcap.


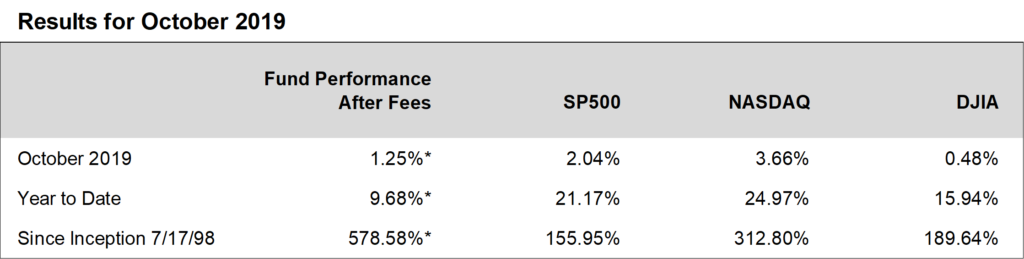
*These results are pro forma. Actual results for most investors will vary. See additional disclosures on page 4. Past performance does not guarantee future results.

 
Equity Overview - October 2019

Equity Overview

Reversing the trend in September, investors in October favored growth stocks over value stocks.  Health care stocks, which were the worst sector in September, were the best performers in October.  Energy stocks were the worst.  Volatility was modest, as 5 of 23 trading days saw gains or losses above 1% in the S&P 500.

The forward 12-month price-earnings ratio for the S&P 500 rose to 17.2, modestly above the five-year average of 16.6.

Third quarter corporate earnings reported in October were generally better than expected.  With 71% of S&P 500 companies reporting, the blended growth rate was negative at -2.7%, but this was better than the consensus projection of -4.0%.  In addition, 76% of companies have beaten consensus earnings estimates and 61% have beaten consensus revenue estimates, in both cases better than the one-year and five-year averages.


Macro Overview - October 2019

Macro Overview

Economic data reported in October were again mixed.  Employment was strong, but manufacturing was weak.  The services sector continued to expand, but retail sales were lower.  Sales of new and existing homes were higher, but housing starts declined.

Taking into account what it perceives as risk to the continued economic expansion, the Fed lowered interest rates for the third time this year.

On the international front, the trade war with China remains at an impasse.  In Britain, Brexit hit a roadblock as Parliament rejected the prime minister’s October 31 deadline and forced him to get an extension to January 31, 2020.  Meanwhile, a general election is scheduled on December 12.  This may or may not resolve the matter, depending on the makeup of the new Parliament.


Additional Disclosures

Additional Disclosures

Performance data for OPI reflect the reinvestment of dividends and other earnings on the fund’s assets.  Performance data for the major indices reflect only changes in the value of those indices, and would be higher if dividends were included. However, the index data do not reflect fees that would be paid to index fund managers and transaction costs that would be incurred when their component stocks are bought or sold, while OPI’s data do reflect quarterly fees and expenses incurred by the fund.  The information provided is believed to be reliable, but its accuracy or completeness is not warranted. This material is not intended as an offer or solicitation for the purchase or sale of any stock, bond, mutual fund, or any other financial instrument. The views and strategies discussed herein may not be appropriate and/or suitable for all investors. This material is meant solely for informational purposes, and is not intended to suffice as any type of accounting, legal, tax, or estate planning advice. Any and all forecasts mentioned are for illustrative purposes only and should not be interpreted as investment recommendations.