Ocean Park Capital Management

2503 Main Street

Santa Monica, CA 90405

Main: 310.392.7300

Daily Performance Line:  310.281.8577

October 2020
Market Update
(all values as of 09.30.2024)

Stock Indices:

Dow Jones 42,330
S&P 500 5,762
Nasdaq 18,189

Bond Sector Yields:

2 Yr Treasury 3.66%
10 Yr Treasury 3.81%
10 Yr Municipal 2.63%
High Yield 6.66%

YTD Market Returns:

Dow Jones 12.31%
S&P 500 20.81%
Nasdaq 21.17%
MSCI-EAFE 12.90%
MSCI-Europe 12.10%
MSCI-Pacific 13.80%
MSCI-Emg Mkt 16.80%
 
US Agg Bond 4.44%
US Corp Bond 5.32%
US Gov’t Bond 4.39%

Commodity Prices:

Gold 2,657
Silver 31.48
Oil (WTI) 68.27

Currencies:

Dollar / Euro 1.11
Dollar / Pound 1.33
Yen / Dollar 142.21
Canadian /Dollar 0.73
 

Portfolio Overview

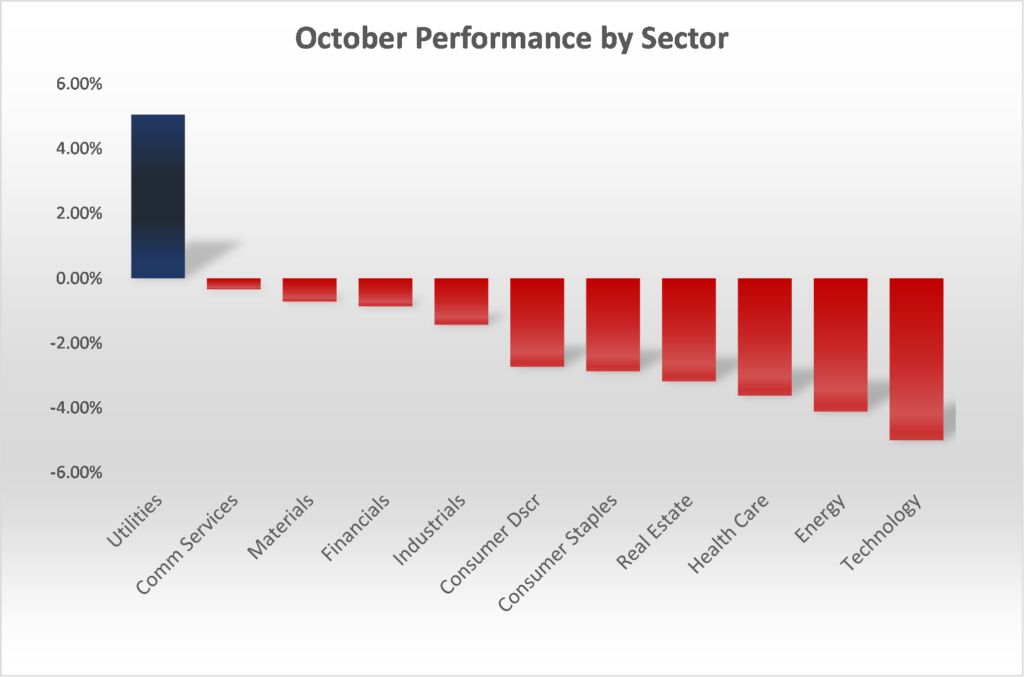
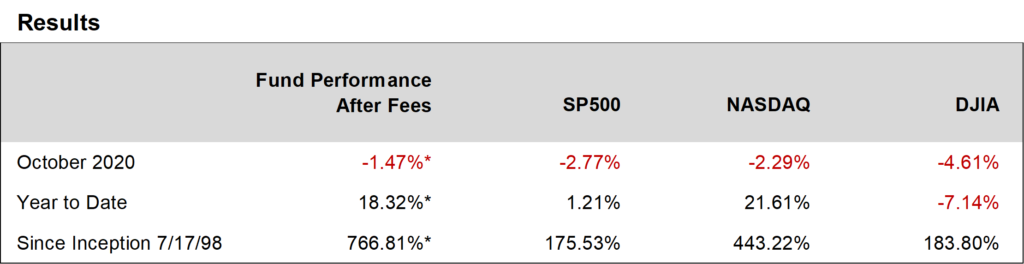
Ocean Park Investors Fund lost 1.47%* in October, but outperformed the major indices including the S&P 500 which lost 2.77%.  For the year to date through October, the fund was up 18.32%* while the S&P 500 was up 1.21%.  Notwithstanding our modest overall loss in October, many of our consumer discretionary stocks had outstanding results, including Bed Bath and Beyond (up 32%, after a 23% gain in September) and Crocs (up 22%).  Our QQQ short and QQQ option hedge also helped our results.

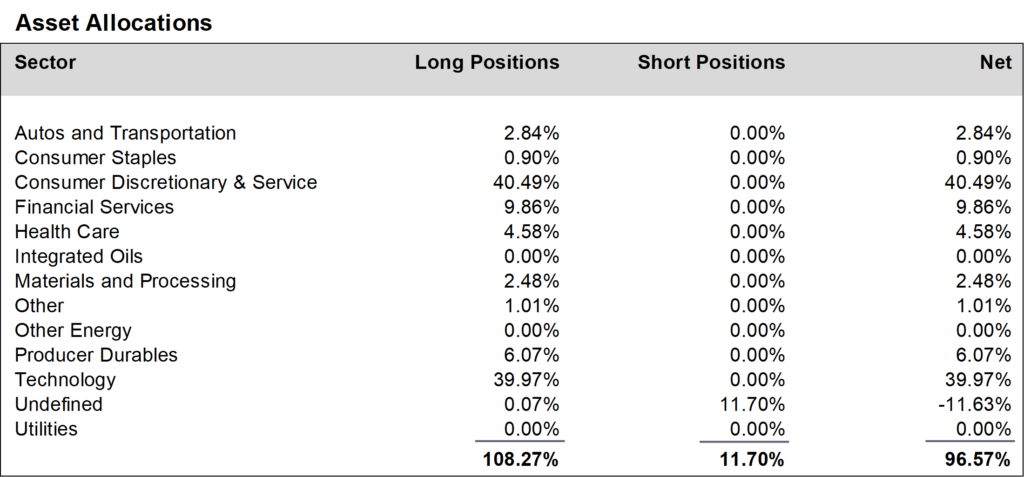
During October, we increased positions in the technology sector and reduced positions in the producer durables and health care sectors.  Exclusive of our short position in QQQ options, we finished the month at about 97% net long, down from about 99% in September.  However, taking into account our QQQ short option hedges, our effective net long exposure was closer to 80%.


Daily updates on our activity are available on our Results Line, at 310-281-8577, and current information is also maintained on our website at www.oceanparkcapital.com. To gain access to the site enter password opcap.

*These results are pro forma. Actual results for most investors will vary. See additional disclosures on page 4. Past performance does not guarantee future results.

 
Equity Overview

Equity Overview

All the major indices lost ground in October and the downturn extended across all sectors except utilities.

Reversing the recent trend, value stocks outpaced their growth counterparts across all capitalization levels.

Equities gained about 5% with modest volatility until midmonth, when the rally stalled. Volatility spiked in the last week of the month when the S&P 500 swung by more than 1% on 4 of 5 trading days, dropping 5.6% for the week.  Following suit, the NASDAQ Composite dropped 5.5% for the week, and both indices finished the month in the red.

All this occurred against a background of generally excellent 3rd quarter earnings results.  With 64% of S&P 500 companies reporting, the blended earnings growth rate came in at negative -9.8%, significantly better than the consensus of negative -21%.  Moreover, 86% of companies reporting beat consensus earnings estimates and 81% beat consensus revenue estimates, in both cases meaningfully above the one-year and five-year averages.  If these are the final beat rates at the end of the reporting season, they will be the highest since FactSet began tracking them in 2008.


Macro Overview

Macro Overview

Markets continued to react to pandemic news and on-again off-again stimulus talks in Congress.  Meanwhile, economic data reported in October was mixed.  Manufacturing continued to expand, as did retail sales, housing, and durable goods orders.  But employment remained stubbornly depressed, with 23-million Americans still receiving some form of unemployment assistance.

The Commerce Department released its initial estimate of third quarter GDP, indicating that the economy bounced back at a 33.1% annual rate.  This was the fastest rate on record, but failed to make up for the even more historic losses earlier in the year.  Moreover, the gain was largely attributed to the $3-trillion fiscal stimulus, which has now run its course.

To keep the economy on track, Fed Chairman Powell repeated his support for another round of strong fiscal intervention, pointing out that “even if policy actions ultimately prove to be greater than needed, they will not go to waste.”  Unfortunately, his concerns fell on deaf ears as Congress again failed to reach agreement on another stimulus package.  It remains to be seen if legislation can be enacted in the lame duck session, but prospects are not encouraging.


Additional Disclosures

Additional Disclosures

Performance data for OPI reflect the reinvestment of dividends and other earnings on the fund’s assets.  Performance data for the major indices reflect only changes in the value of those indices, and would be higher if dividends were included. However, the index data do not reflect fees that would be paid to index fund managers and transaction costs that would be incurred when their component stocks are bought or sold, while OPI’s data do reflect quarterly fees and expenses incurred by the fund.  The information provided is believed to be reliable, but its accuracy or completeness is not warranted. This material is not intended as an offer or solicitation for the purchase or sale of any stock, bond, mutual fund, or any other financial instrument. The views and strategies discussed herein may not be appropriate and/or suitable for all investors. This material is meant solely for informational purposes, and is not intended to suffice as any type of accounting, legal, tax, or estate planning advice. Any and all forecasts mentioned are for illustrative purposes only and should not be interpreted as investment recommendations.