First Kentucky Trust

297 N. Hubbards Lane, Suite 202

Louisville, KY 40207

web:  www.firstkytrust.com

email: info@firstkytrust.com

November 2020
Market Update
(all values as of 09.30.2024)

Stock Indices:

Dow Jones 42,330
S&P 500 5,762
Nasdaq 18,189

Bond Sector Yields:

2 Yr Treasury 3.66%
10 Yr Treasury 3.81%
10 Yr Municipal 2.63%
High Yield 6.66%

YTD Market Returns:

Dow Jones 12.31%
S&P 500 20.81%
Nasdaq 21.17%
MSCI-EAFE 12.90%
MSCI-Europe 12.10%
MSCI-Pacific 13.80%
MSCI-Emg Mkt 16.80%
 
US Agg Bond 4.44%
US Corp Bond 5.32%
US Gov’t Bond 4.39%

Commodity Prices:

Gold 2,657
Silver 31.48
Oil (WTI) 68.27

Currencies:

Dollar / Euro 1.11
Dollar / Pound 1.33
Yen / Dollar 142.21
Canadian /Dollar 0.73
 

Macro Overview

With the election over, a lingering uncertainty has been removed as expectations of how fiscal policy and stimulus programs funded by government debt may evolve. Some economists and market analysts project eventual higher taxes along with an expanding fiscal deficit.

The delay in getting a second stimulus bill through Congress hindered markets throughout October due to indecisiveness among politicians. Millions have been awaiting a second wave of stimulus benefits in order to meet expenses. With no new bill in place, a number of relief programs will expire at the end of the year which have benefited both individuals and small businesses.

A weakening U.S. dollar contributed to emerging equity market performance in October, as emerging currencies and stocks fared better than U.S. equities and developed international equities. Countries throughout Europe announced national lockdowns in order to stem a rapid resurgence of the COVID-19 virus in Europe. Some fear that similar restrictions and state imposed lockdowns may resurface in the United States.

Market dynamics started to shift in October as anticipated election results were expected to offer a long-awaited secondary stimulus program, reigniting economic expansion throughout the economy. Fiscal policy initiatives have become forefront as the Fed meddles with monetary policies that have essentially become exhausted.

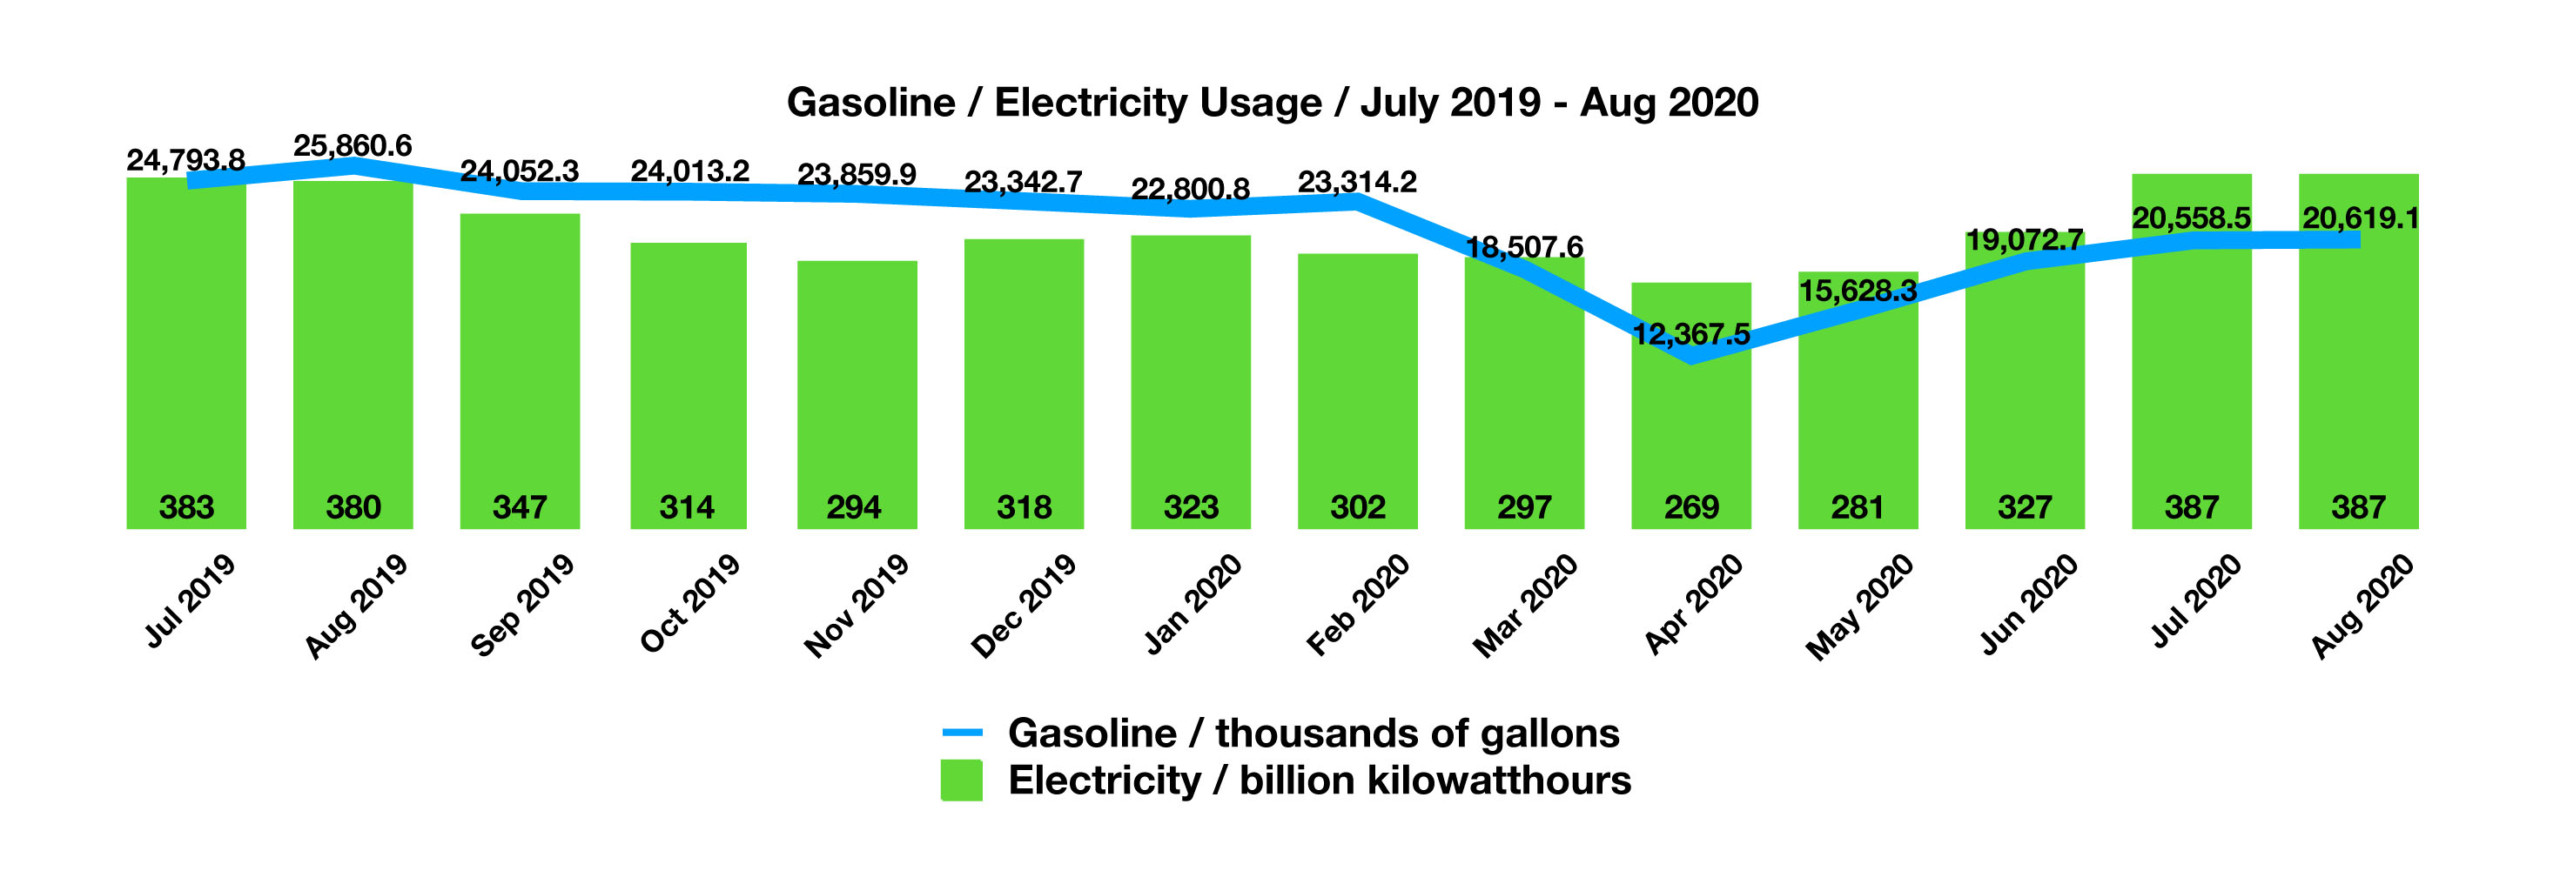
COVID-19 has brought about possibly some of the largest shifts in consumer trends ever, as demand for online shopping, eating out, and energy consumption have dramatically changed in a matter of months. Gasoline usage cratered as electricity usage simultaneously soared, the result of millions of workers transitioning to home based offices.

Sources: Federal Reserve, U.S. Energy Department, S&P
 
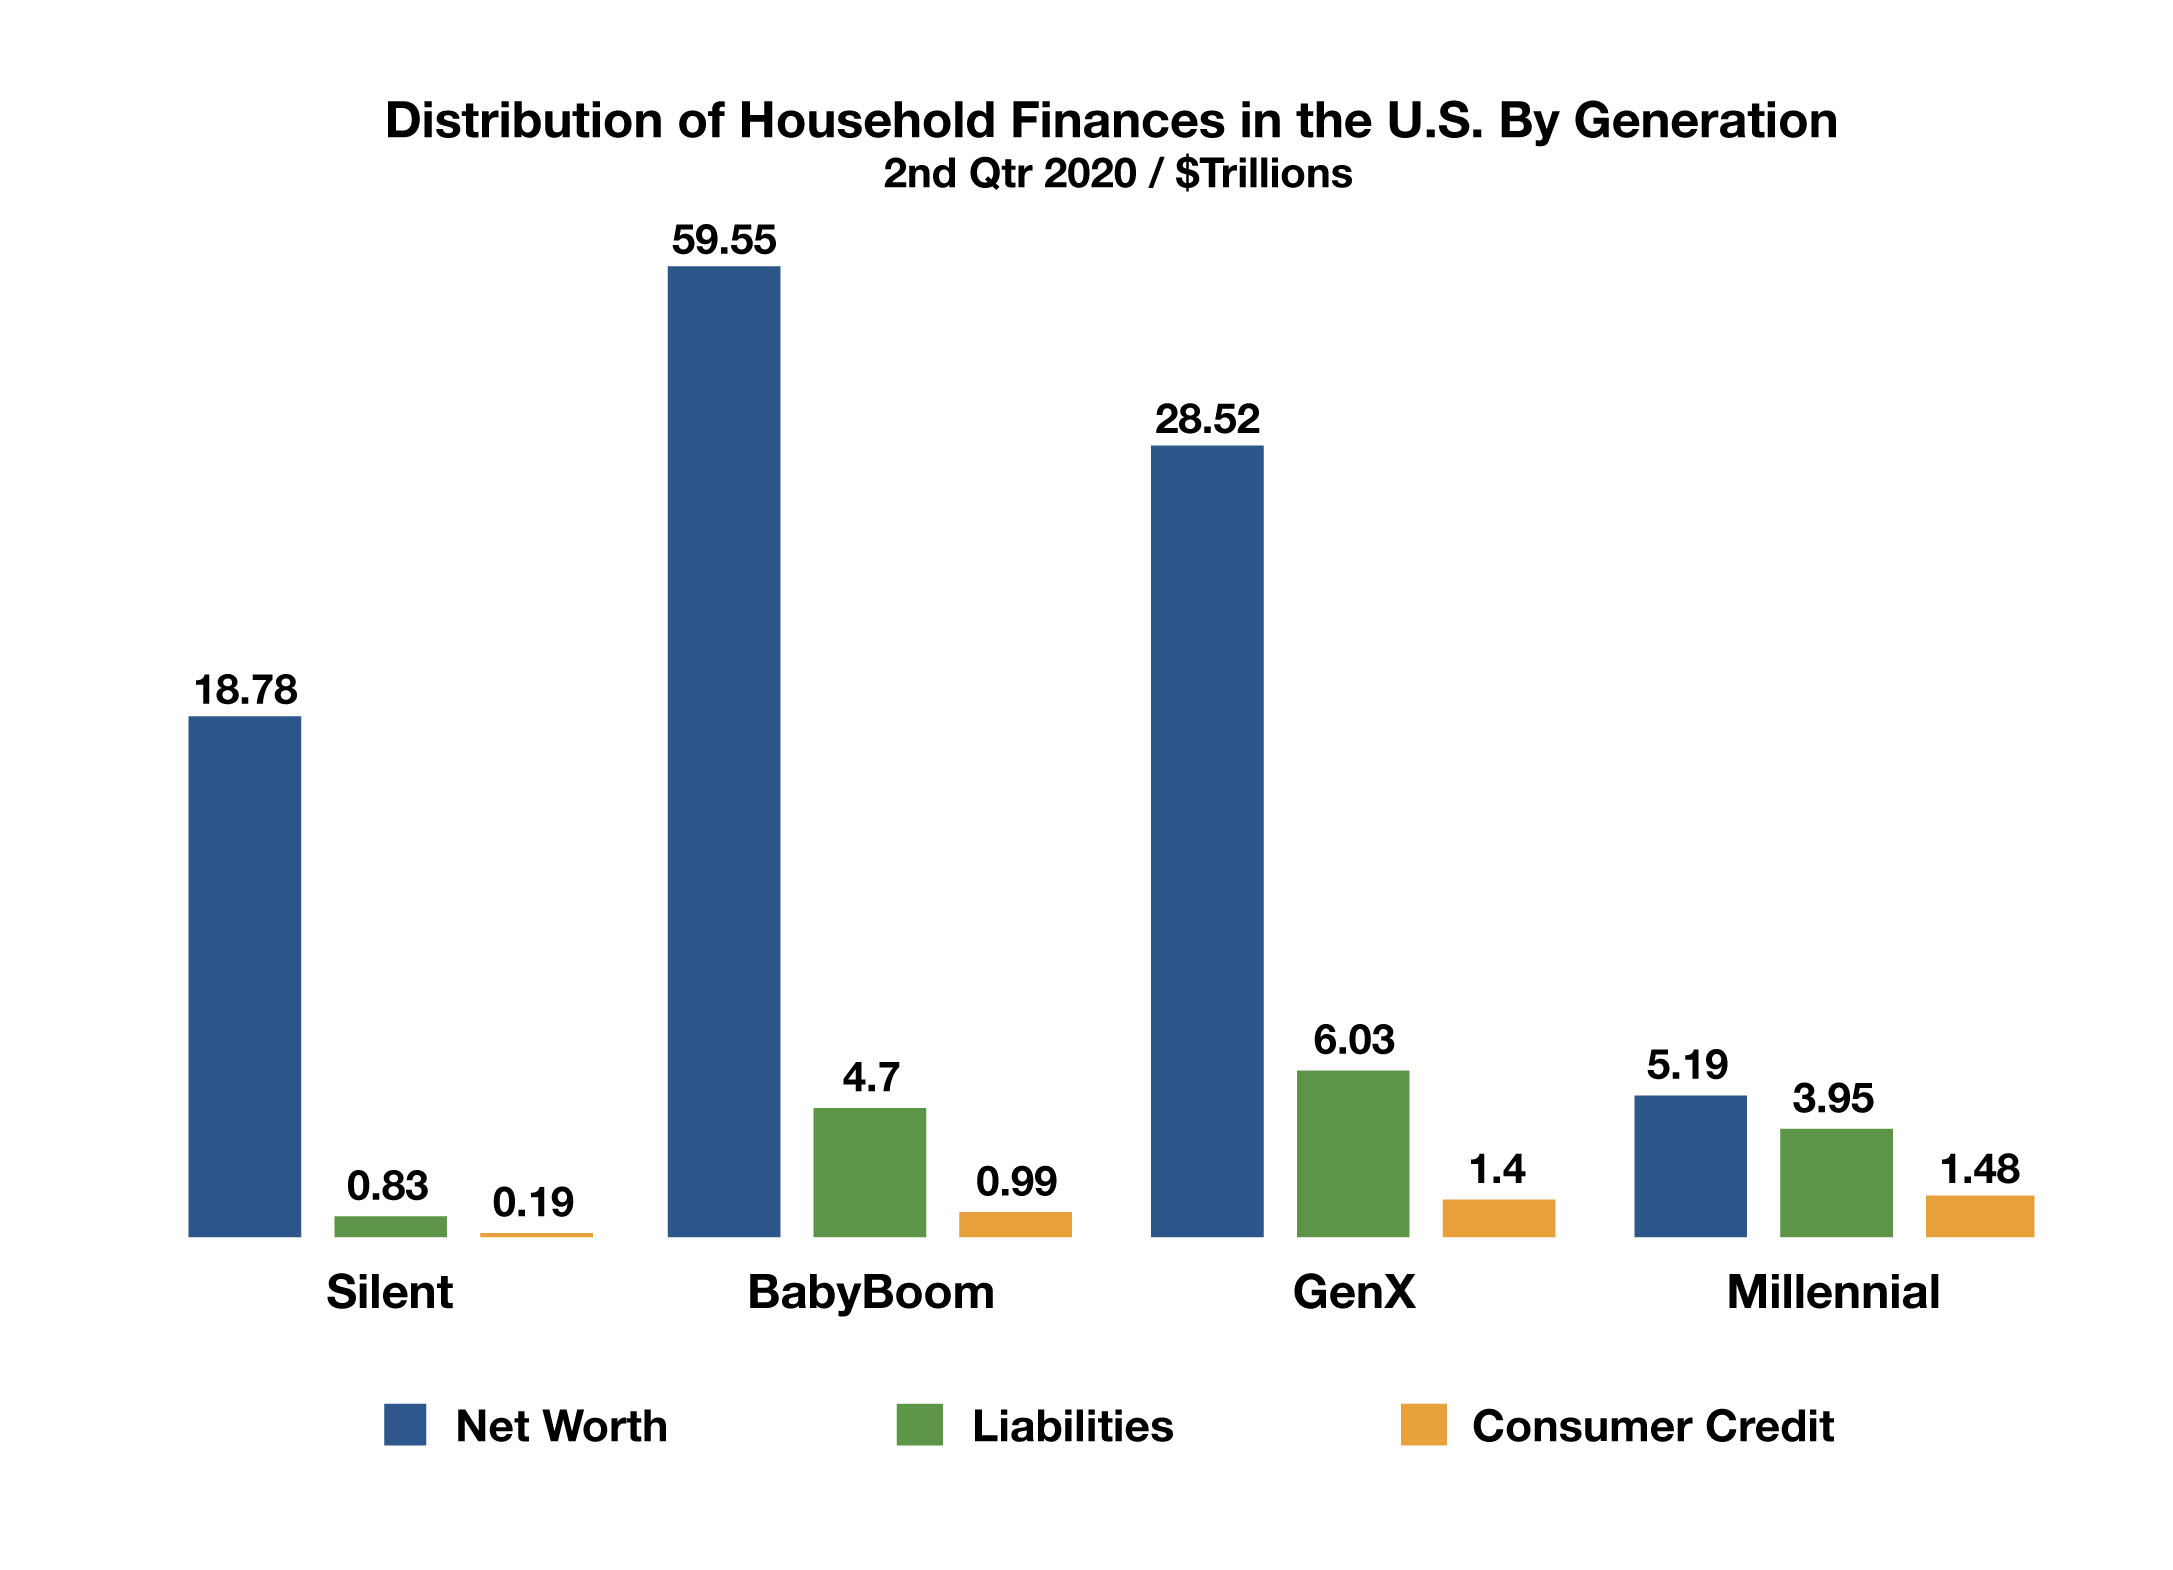
Millennials control just 4.6% of U.S. wealth

Uncertainty From Presidential Race Drove Volatility In October – Equity Overview

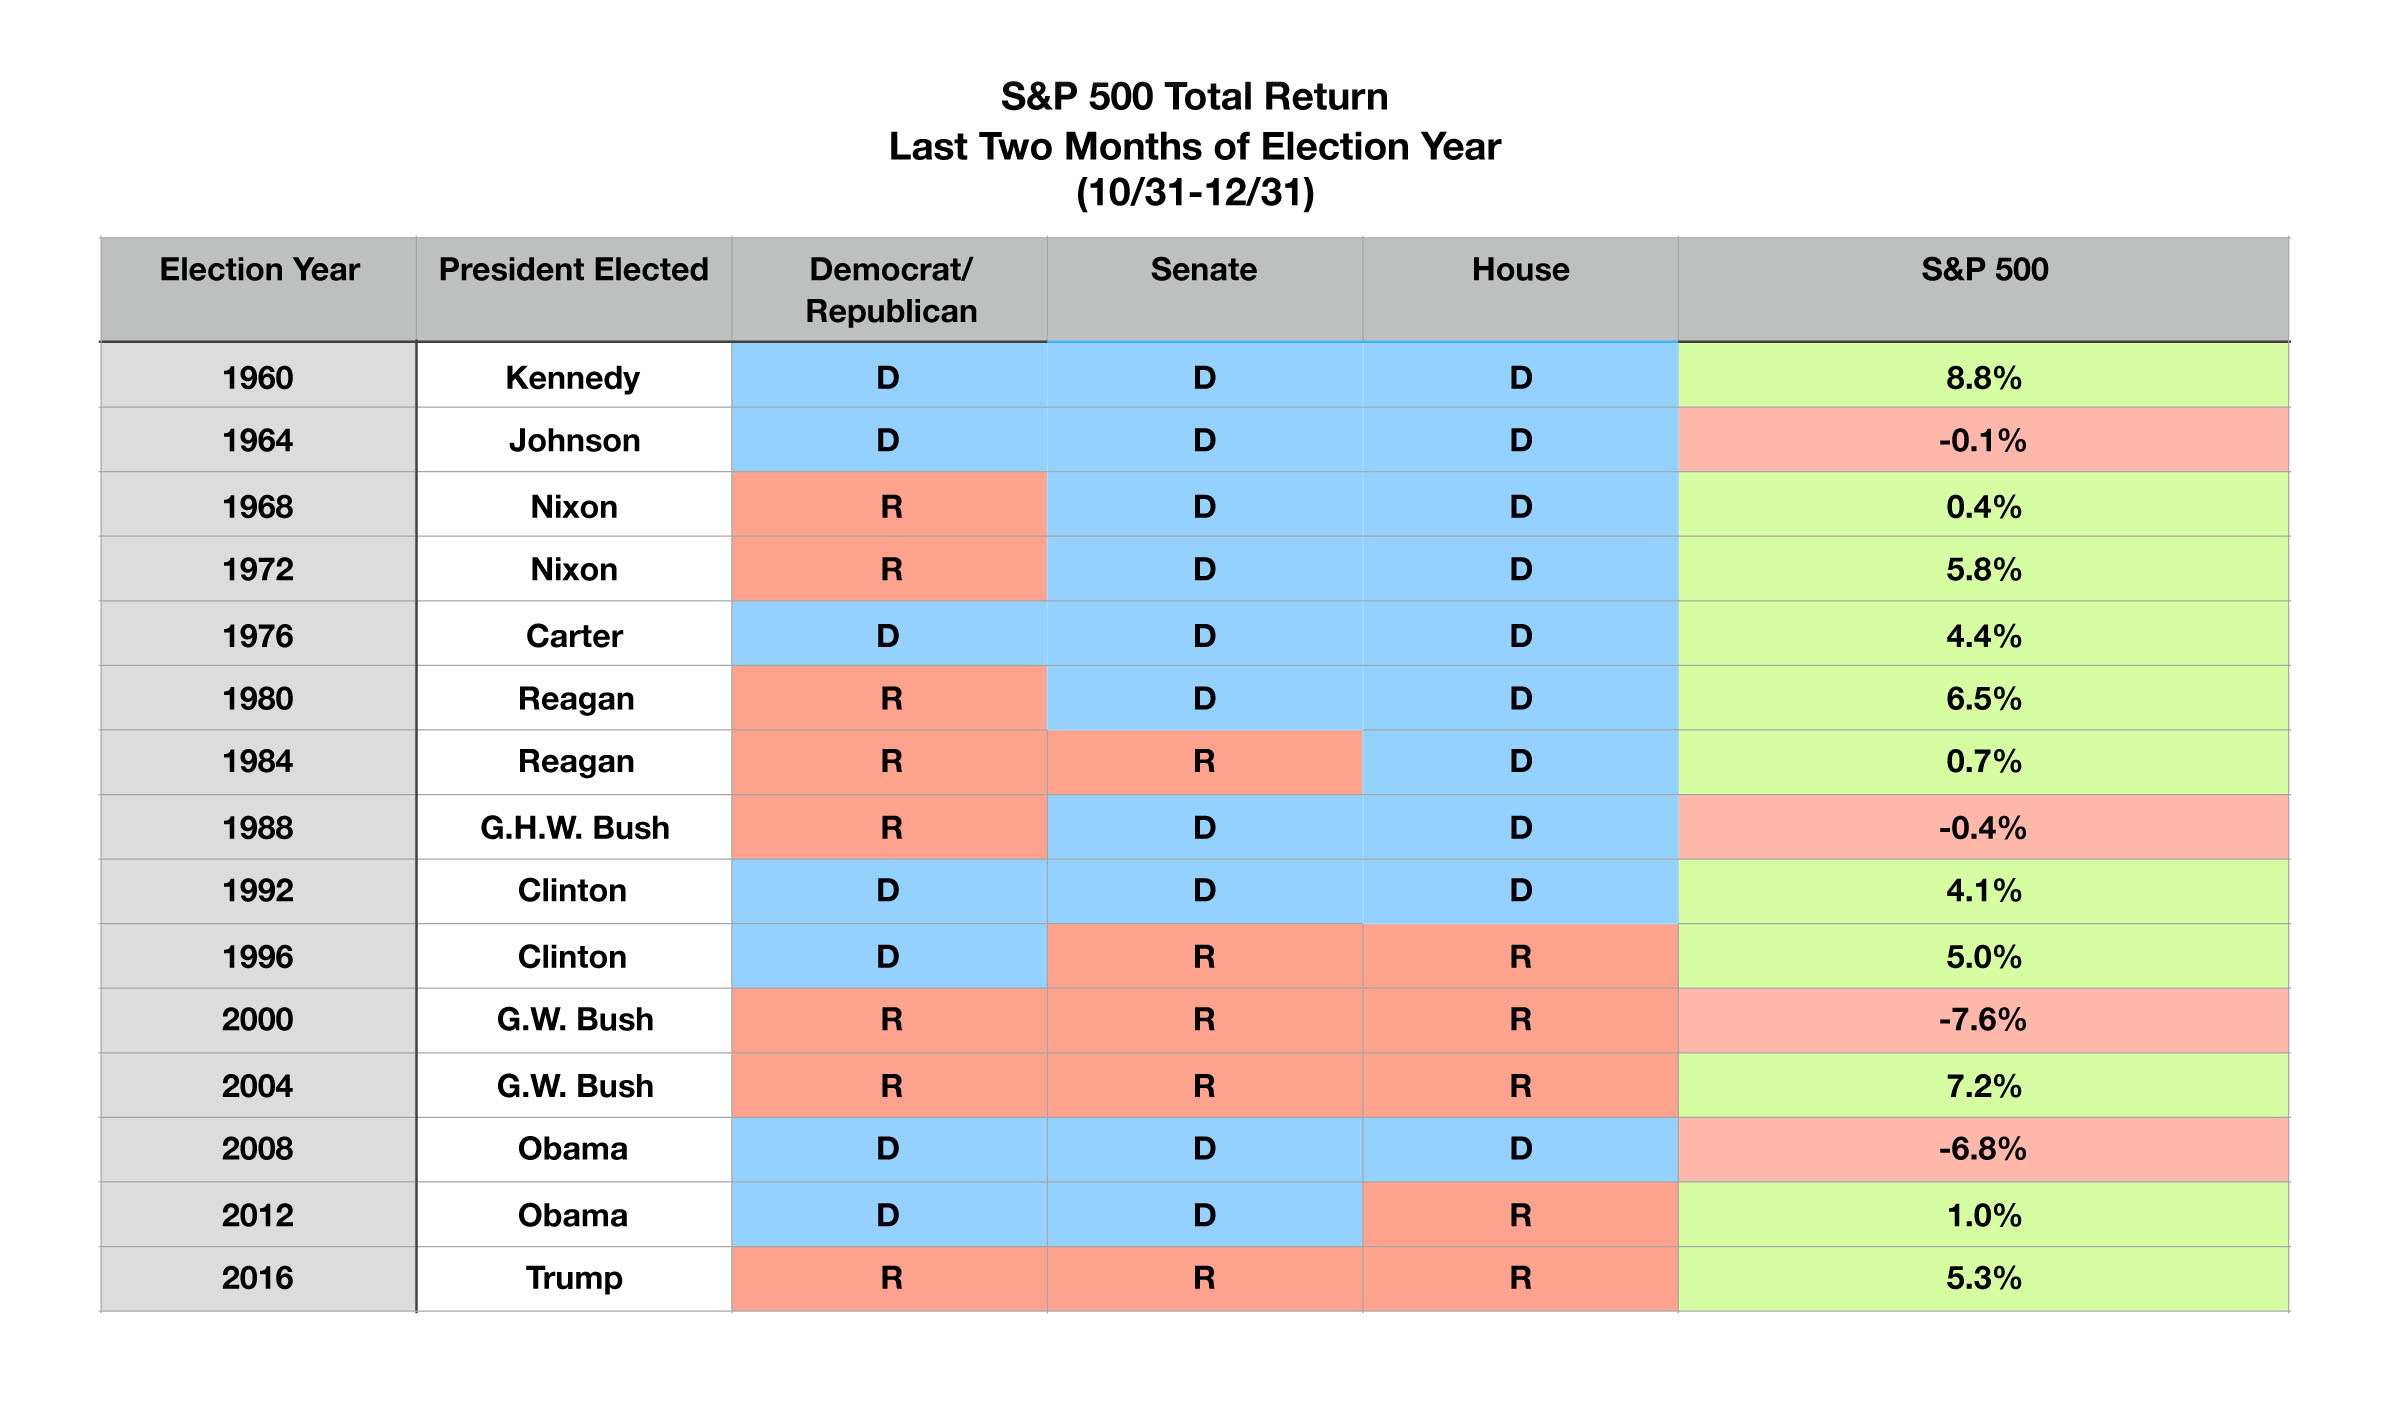
U.S. equities zigzagged throughout October as uncertainty surrounding the election and a second stimulus package instilled volatility. Growth, momentum, and quality factors of the S&P 500 Index led markets up until October when a reverse occurred, shifting focus back to higher beta, more volatile stocks. Analysts believe that election results may eventually offer a fiscal stimulus program that may help reignite some economic expansion. 

Global developed market equities declined in October as earnings became more of a concern among companies throughout various industries. In the U.S., the S&P 500 Index dropped the most ever for the week leading up to a presidential election. Emerging market equities faired better than developed markets in October, as a weakening U.S. dollar helped buoy emerging market currencies and stocks. (Sources: Bloomberg, Standard & Poors)

Election Results May Affect Rates – Fixed Income Update

Interest rates gravitated slightly higher in October, driven by the anticipation of eventual inflation and growing federal debt levels. The yield on the 10-year Treasury bond rose from 0.69% in September to 0.88% at the end of October. The rise in yields was the largest increase since June.

Election results are expected to determine the direction of interest rates over the next few years. It is expected that the continuation of new stimulus program funds may influence rates to rise as newly issued government debt is used to pay for the enormous benefit payments. (Sources: U.S. Treasury, Federal Reserve)

Millennials Lagging Relative To Their Parents & Grandparents – Demographics

The Federal Reserve tracks and compiles data on all of the generational members which include the Silent, Baby Boomer, Gen X, and Millennials. The data is revealing that the millennial generation, born between 1981 to 1996, are lacking in their finances. Fed data for the four generations shows that millennials have already accumulated nearly as much debt as Boomers and have the most use of consumer credit of all the generational groups. Millennials control just 4.6% of U.S. wealth even though they represent the largest segment of the U.S. workforce. Economists view that millennials are far behind their previous generations when it comes to finance and assets, creating anticipated financial struggles for millions.

Some credit the easy money policies enacted by the Fed as well as a robust economy for the decades that drove wealth for the GenXers and the Boomers. Millennials haven’t been as fortunate to have had economic tailwinds to push them along, making it that much more difficult to build wealth and establish themselves financially. (Sources: Federal Reserve Bank of St. Louis: Survey of Consumer Finances & Financial Accounts)

 
Demand for gasoline dropped to the lowest levels since 1990

Pandemic Shifts What Energy We Are Using – Consumer Energy Usage

COVID-19 has upended and completely altered the way we use energy. What has been conventional wisdom and consistent for decades has all changed in a matter of months. For the first time since 1960, U.S. consumers have spent more on electricity than on gasoline, representing a dramatic shift in energy usage.

Reasons for the shift are attributed to an enormous drop in driving, as millions of U.S. workers began working from home. Demand for gasoline dropped to the lowest levels since 1990, in turn transferring demand to electricity which has seen the largest usage spike in 20 years. The growing use of laptops, printers and other home office equipment has elevated home electricity consumption. Any additional stay at home mandates may continue to affect gasoline and electricity consumption as millions of workers continue to adjust working from home.

Sources: U.S. Energy Information Administration

How Lower Credit Limits Affect Your Credit Score Due To The Pandemic – Personal Finance

Millions of Americans are having their credit scores adversely affected  by the pandemic, as banks and finance companies modify the extension of credit. As consumers struggle to retain a fragile balance between joblessness, lower wages, and household expenses, lenders are cutting credit limits, lines of credit, and credit card charge limits. The result has been a reduction in scores for millions of Americans even though many continue to manage their credit and payments successfully.

Lenders have been reducing their risk of exposure since March by reducing credit limits on consumer accounts. Since many of these credit accounts carry a balance, the credit utilization ratio rises as a credit limit is reduced. This ratio is a critical component used by the three major credit reporting firms in determining a consumer’s credit score. As ratios rise because of a credit limit reduction, credit scores tend to drop. It is assumed that the higher the ratio, the greater the risk for lenders.

Consumers have been surprised by lower credit scores, since lenders are not obligated to warn customers about a pending credit limit reduction, but only do so after it has been done.

In order to try to curtail the effects of a higher utilization ratio, it is suggested that consumers contact their credit lenders directly and request a reinstatement of their prior credit limit. It is also suggested that simply paying down an existing balance may help in alleviating the threat of a credit score drop.

Source: Federal Reserve

 
new visas and permits fell by 46% in the half of 2020

International Migration Plummets – International Dynamics

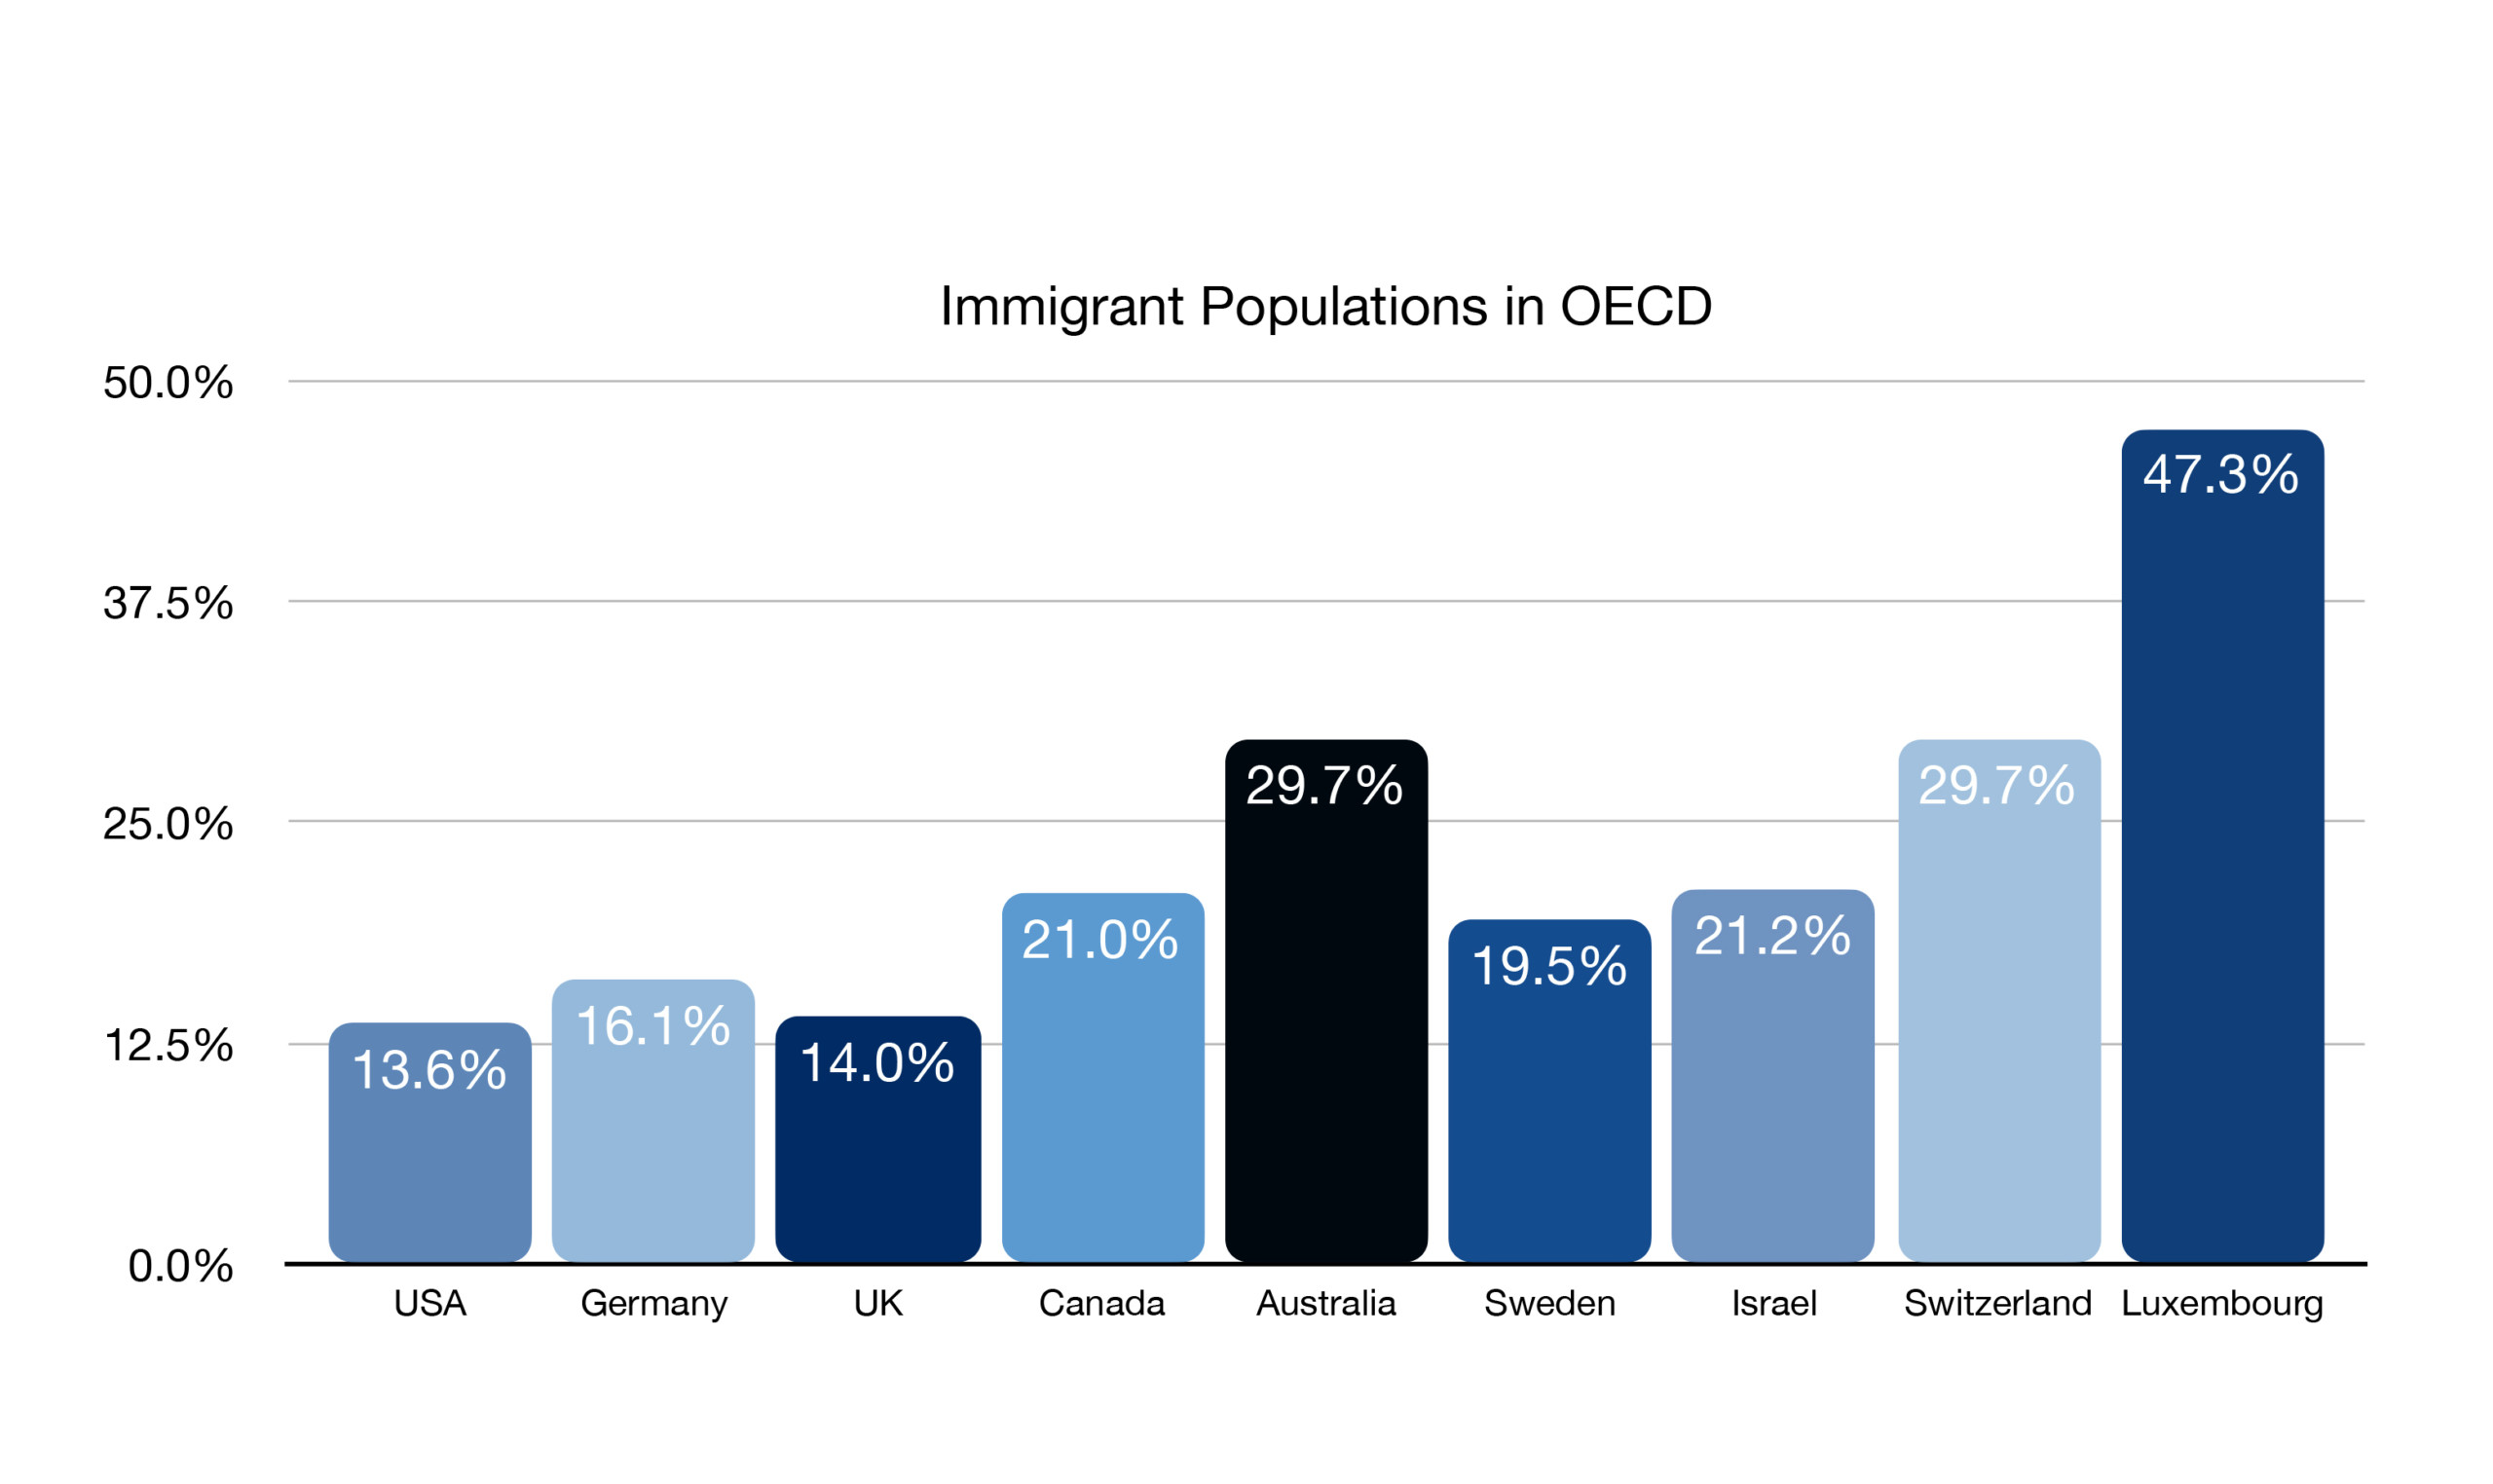
International migration plunged 46% over the past year as the pandemic has hindered mobility for millions of migrant workers worldwide. The Organization for Economic Cooperation and Development (OECD) tracks the issuance of new visas and permits by the organization’s 37 member countries, including the United States. The OECD found that new visas and permits fell by 46% in the first half of 2020 versus the first half of 2019. Prolonged travel restrictions along with remote working has made it difficult for migrant workers to transition from country to country for high demand jobs.

Larger populations of immigrant workers are usually characteristic of industrialized countries with ample jobs and industries. Besides the United States, several European countries also host higher percentages of immigrant worker populations. According to the OECD, the U.S. currently maintains roughly 13.6% of an immigrant population, lower than some other developed economies. (Source: OECD)

The Reemergence of Stagflation – Economic Trends

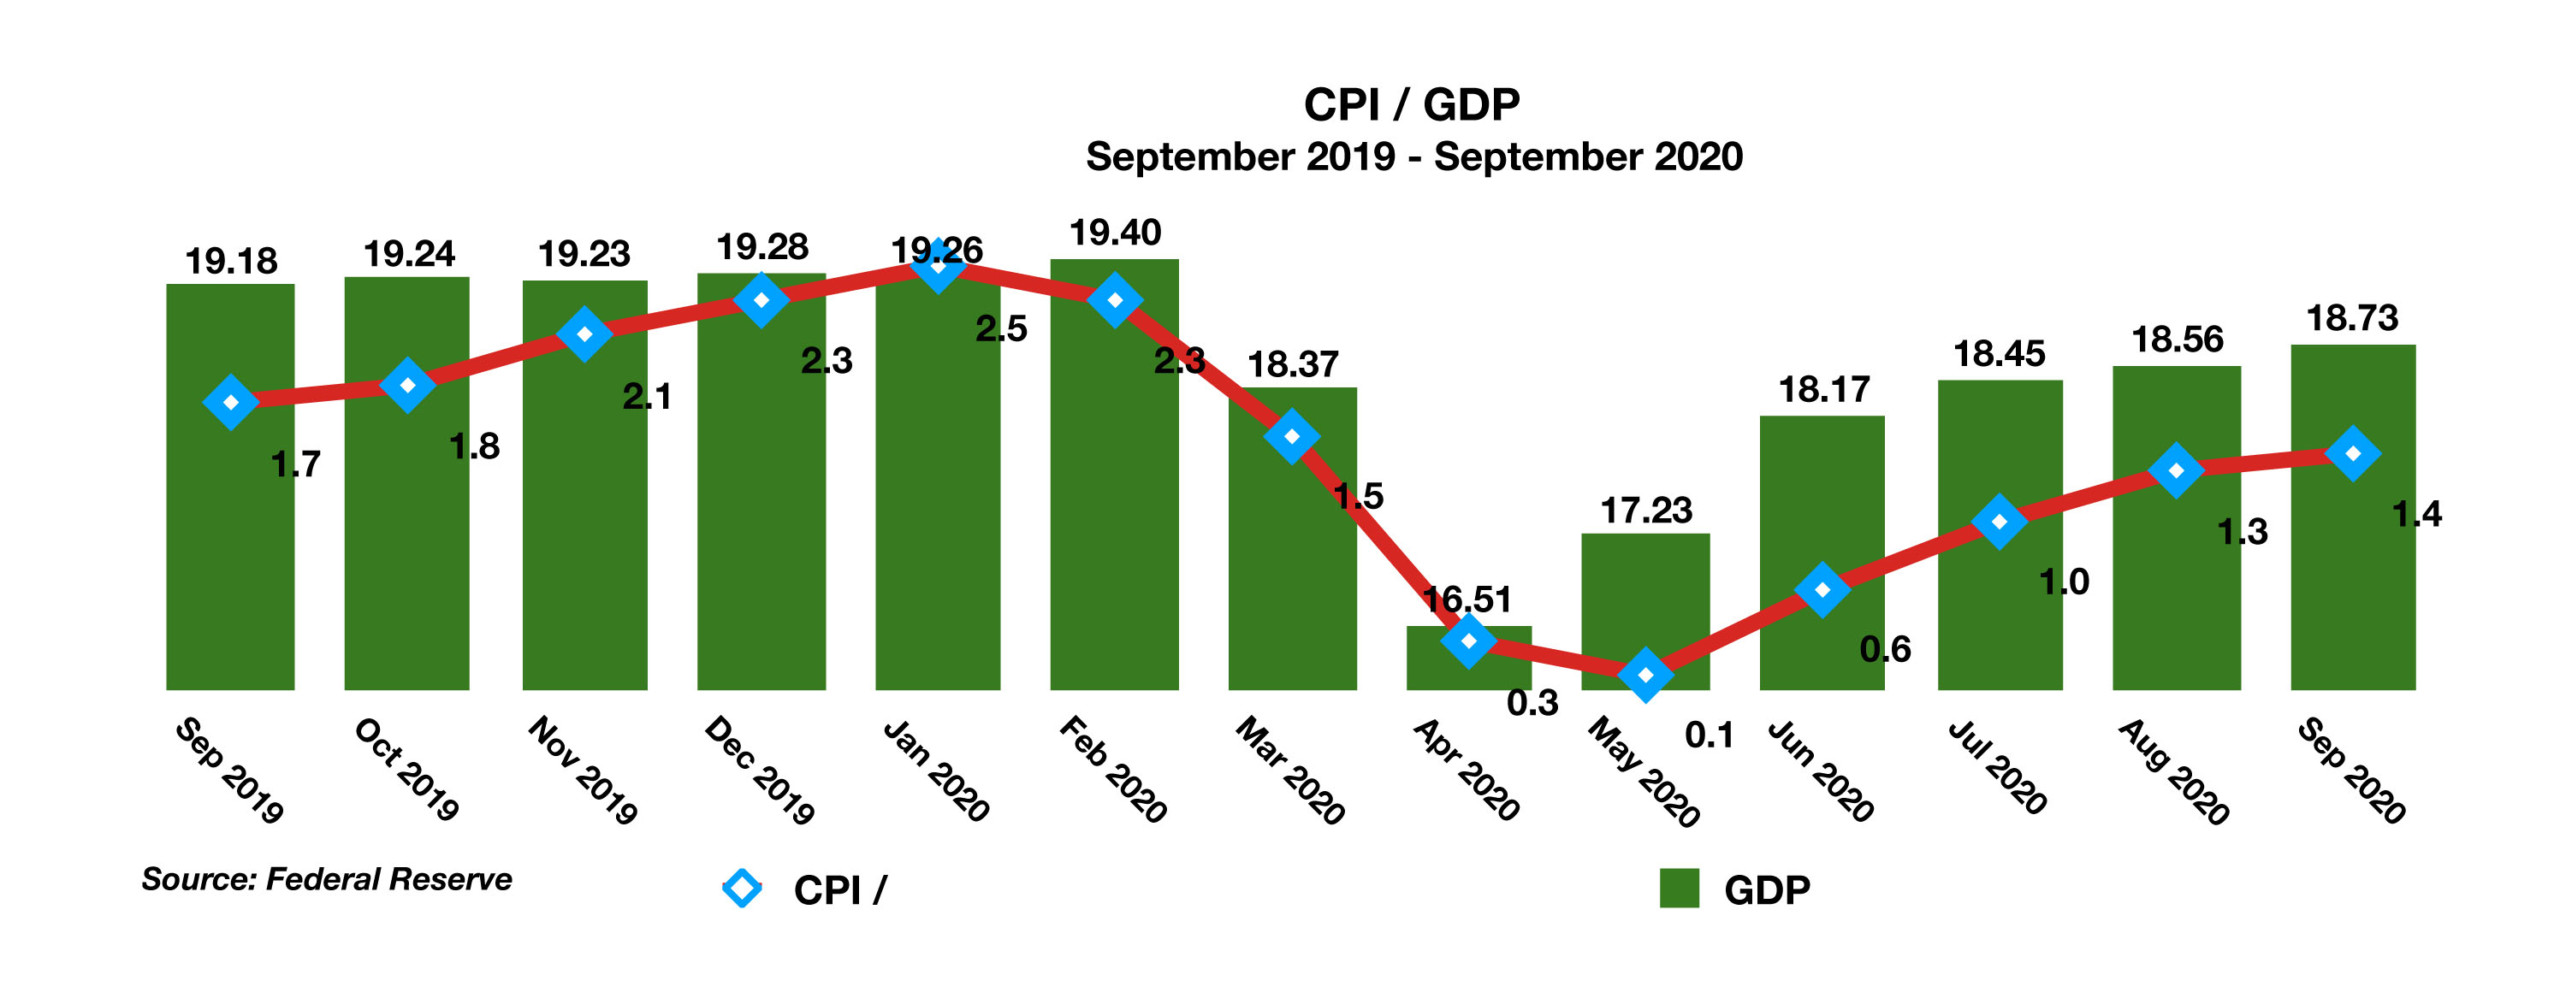
Recent government data that tracks inflation, known as the Consumer Price Index (CPI), has been rising steadily since the onset of the pandemic in March. Economists believe that the rise can be construed as either a rebounding economy or as a general rise in overall prices. The concern is that the current economic environment continues to display signs of dismal expansion and stagnant employment growth. Simultaneously higher prices for food, clothes, healthcare, and toilet paper validate broad inflationary pressures, creating a stagflation scenario.

The dynamics of stagflation can diminish a person’s income as the cost of essential services and goods rise, while no wage increases occur. The textbook inflation years of the late 70s were different from what is occurring now, as there is no wage inflation today like there was in the 70s. As a result, a growing number of workers today are experiencing higher prices but with the same or less income.(Source: BEA)