Ocean Park Capital Management
2503 Main Street
Santa Monica, CA 90405
Main: 310.392.7300
Daily Performance Line: 310.281.8577
Dow Jones | 44,910 |
S&P 500 | 6,032 |
Nasdaq | 19,218 |
2 Yr Treasury | 4.13% |
10 Yr Treasury | 4.18% |
10 Yr Municipal | 2.83% |
High Yield | 6.88% |
Dow Jones | 19.16% |
S&P 500 | 26.47% |
Nasdaq | 28.02% |
MSCI-EAFE | 6.50% |
MSCI-Europe | 4.60% |
MSCI-Pacific | 9.00% |
MSCI-Emg Mkt | 7.90% |
US Agg Bond | 2.93% |
US Corp Bond | 4.14% |
US Gov’t Bond | 2.89% |
Gold | 2,673 |
Silver | 31.10 |
Oil (WTI) | 68.15 |
Dollar / Euro | 1.05 |
Dollar / Pound | 1.26 |
Yen / Dollar | 151.58 |
Canadian /Dollar | 0.71 |
In October, Ocean Park Investors Fund and the major indices rebounded sharply from September losses and reached all-time highs. The Fund rose 5.27%*, the S&P 500 gained 6.91%, and the NASDAQ Composite gained 7.27%. Technology stocks drove the Fund’s results, led by Nvidia (up 23%) and Advanced Micro Devices (up 17%).
During October, we increased positions in the health care sector and the consumer discretionary and service sector, and reduced positions in the producer durables sector. We finished the month approximately 90% net long, unchanged from September.
Daily updates on our activity are available on our Results Line, at 310-281-8577, and current information is also maintained on our website at www.oceanparkcapital.com. To gain access to the site enter password opcap.
*These results are pro forma. Actual results for most investors will vary. See additional disclosures on page 4. Past performance does not guarantee future results.
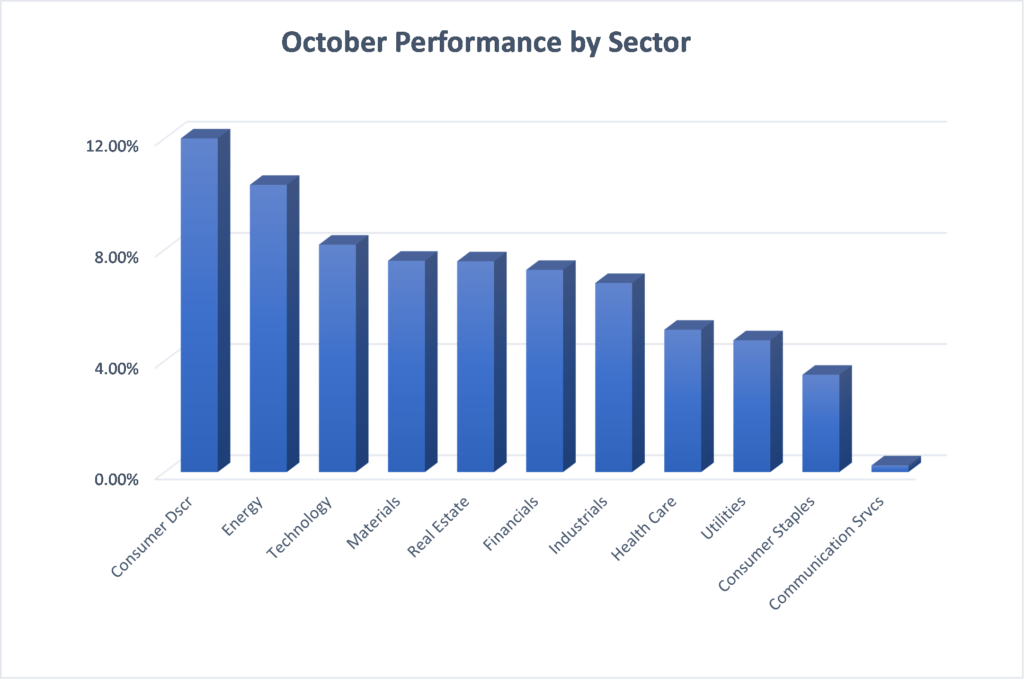
All market sectors rose in October, led by consumer discretionary, energy, and technology stocks. Growth stocks outperformed value stocks. Volatility was modest. Performance was lackluster at the start of the month but improved as earnings season got underway.
Third quarter earnings results reported in October exceeded expectations, albeit at a slightly lower rate than second quarter results. With 56% of S&P 500 companies reporting, the blended earnings growth rate came in at +36.6%, better than the consensus of +27.5%. In addition, 82% of companies reporting beat consensus earnings estimates and 75% beat consensus revenue estimates, in both cases above the five-year average but below the one-year average.
Economic statistics reported in October were mixed. Manufacturing and retail sales showed gains, and home sales were strong. In addition, consumer confidence rose after three previous months of decline. On the other hand, nonfarm payrolls disappointed significantly, showing a gain of 194,000 versus an expectation of 500,000. And the Commerce Department estimate of third quarter GDP growth was only 2% annualized, compared with 6.7% annualized in the second quarter. Crude oil prices reached their highest level in 7 years, good for the energy sector but bad for consumers at the gas pump.
But far and away the most dominant themes in October were the ongoing supply chain disruption caused by the Covid-19 pandemic, and the disconcerting rise in inflation. (Consumer prices reported in October rose at a 5.4% annual rate and showed no sign of abating.) The phenomena are related as supply chain problems decrease availability of goods, while demand continues strong — leading to price increases. Both issues were supposed to be short-lived but are now expected to continue into next year. Meanwhile, the Fed is keeping its finger off the interest rate trigger — for now.
Performance data for OPI reflect the reinvestment of dividends and other earnings on the fund’s assets. Performance data for the major indices reflect only changes in the value of those indices, and would be higher if dividends were included. However, the index data do not reflect fees that would be paid to index fund managers and transaction costs that would be incurred when their component stocks are bought or sold, while OPI’s data do reflect quarterly fees and expenses incurred by the fund. The information provided is believed to be reliable, but its accuracy or completeness is not warranted. This material is not intended as an offer or solicitation for the purchase or sale of any stock, bond, mutual fund, or any other financial instrument. The views and strategies discussed herein may not be appropriate and/or suitable for all investors. This material is meant solely for informational purposes, and is not intended to suffice as any type of accounting, legal, tax, or estate planning advice. Any and all forecasts mentioned are for illustrative purposes only and should not be interpreted as investment recommendations.