Ocean Park Capital Management

2503 Main Street

Santa Monica, CA 90405

Main: 310.392.7300

Daily Performance Line:  310.281.8577

October 2025
Market Update
(all values as of 10.31.2025)

Stock Indices:

Dow Jones 47,562
S&P 500 6,840
Nasdaq 23,724

Bond Sector Yields:

2 Yr Treasury 3.60%
10 Yr Treasury 4.11%
10 Yr Municipal 2.73%
High Yield 6.53%

YTD Market Returns:

Dow Jones 11.80%
S&P 500 16.30%
Nasdaq 22.86%
MSCI-EAFE 23.69%
MSCI-Europe 25.44%
MSCI-Pacific 25.83%
MSCI-Emg Mkt 30.32%
 
US Agg Bond 6.80%
US Corp Bond 7.29%
US Gov’t Bond 6.51%

Commodity Prices:

Gold 4,013
Silver 48.25
Oil (WTI) 60.88

Currencies:

Dollar / Euro 1.15
Dollar / Pound 1.31
Yen / Dollar 153.64
Canadian /Dollar 0.71

Portfolio Overview

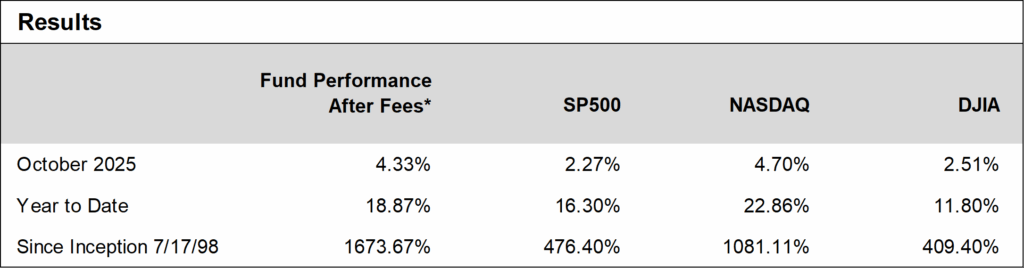
Ocean Park Investors Fund rose 4.33%* in October, while the S&P 500 gained 2.27% and the NASDAQ Composite gained 4.70%.  Once again the fund’s technology holdings led the way, with Lumentum, Micron, Snowflake, and Western Digital all posting gains in excess of 20% for the month.

The Fund’s strong October showing also reflected notable one-day post-earnings gains among several holdings which rallied following quarterly beats.  These included Amazon (+9.6%), Reddit (+7.5%), Western Digital (+8.7%), and Seagate Technology (+19.1%).  These results highlight continued positive momentum across select AI, software, and data-infrastructure exposures.

We actively managed our market exposure for both risk and opportunity, finishing the month at about 97% net long.


Daily updates on our activity are available on our Results Line, at 310-281-8577. Current information is also maintained on our website at www.oceanparkcapital.com. Use password opcap.

*These results are pro forma. Actual results for most investors will vary. See additional disclosures on page 4. Past performance does not guarantee future results.


Equity Overview

Equity Overview

Equities reached new highs in October but performance was uneven as six of eleven sectors rose and five declined.  Technology was the best sector and Materials was the worst.  Growth stocks again outperformed value, highlighted by results for the so-called Magnificent Seven which comprise about 36% of the S&P 500 but accounted for about 82% of the monthly gain in the index.  Volatility was moderate as the S&P 500 moved more than 1% on 4 of 23 trading days.

Third quarter earnings reported in October were impressive.  With results tabulated for 64% of S&P 500 companies, 83% have beaten consensus earnings estimates which is above the 1-year and 5-year averages.  Even more encouraging, 79% have beaten revenue estimates which is far above the 1-year average of 67% and the 5-year average of 70%–and even further above the anemic 62% rate in the first and second quarters of 2025.

The forward price/earnings ratio for the S&P 500 at month’s end was 23.1, which is notably above the 5-year and 10-year averages but below the 30-year peak of 24.4.


Macro Overview

Macro Overview

The government shutdown dominated headlines in October, although it did not have a significant effect on stock markets.  It did have a major impact on economic data because government agencies that produce it have been closed.  Dozens of reports have been not been issued, including critical statistics on unemployment, retail sales, and housing.  One crucial report however–the Consumer Price Index—was delivered, and showed that inflation remained relatively benign at around 3%.

The main economic event in October was the Fed meeting at month’s end, at which the Fed reduced interest rates by an additional 0.25% to a range of 3.75-4.00%.  Chairman Powell acknowledged that the Fed was acting without its usual arsenal of data, but judged that concerns about employment outweighed concerns about inflation. Notably, however, he dampened hopes for an additional cut in December, stating that “Further reduction in the policy rate at the December meeting is not a foregone conclusion, far from it.”  This caused markets to reprice the likelihood of another rate cut in December from 90% to 60%.


Additional Disclosures

Additional Disclosures

Performance data for OPI reflect the reinvestment of dividends and other earnings on the fund’s assets.  Performance data for the major indices reflect only changes in the value of those indices, and would be higher if dividends were included. However, the index data do not reflect fees that would be paid to index fund managers and transaction costs that would be incurred when their component stocks are bought or sold, while OPI’s data do reflect quarterly fees and expenses incurred by the fund.  The information provided is believed to be reliable, but its accuracy or completeness is not warranted. This material is not intended as an offer or solicitation for the purchase or sale of any stock, bond, mutual fund, or any other financial instrument. The views and strategies discussed herein may not be appropriate and/or suitable for all investors. This material is meant solely for informational purposes, and is not intended to suffice as any type of accounting, legal, tax, or estate planning advice. Any and all forecasts mentioned are for illustrative purposes only and should not be interpreted as investment recommendations.