AIS October 2018 Newsletter
Market Update
(all values as of 06.28.2024)

Stock Indices:

Dow Jones 39,118
S&P 500 5,460
Nasdaq 17,732

Bond Sector Yields:

2 Yr Treasury 4.71%
10 Yr Treasury 4.36%
10 Yr Municipal 2.86%
High Yield 7.58%

YTD Market Returns:

Dow Jones 3.79%
S&P 500 14.48%
Nasdaq 18.13%
MSCI-EAFE 3.51%
MSCI-Europe 3.72%
MSCI-Pacific 3.05%
MSCI-Emg Mkt 6.11%
 
US Agg Bond -0.71%
US Corp Bond -0.49%
US Gov’t Bond -0.68%

Commodity Prices:

Gold 2,336
Silver 29.43
Oil (WTI) 81.46

Currencies:

Dollar / Euro 1.06
Dollar / Pound 1.26
Yen / Dollar 160.56
Canadian /Dollar 0.73

Macro Overview

The Fed raised rates for the third time this year, signaling it was on track for further hikes over the next few months. Rates moved higher across the fixed income spectrum, with the 10-year Treasury bond piercing the 3% mark, a level last reached in May of this year. The Federal Reserve also revised its estimates for GDP growth from 2.8% to 3.1% for 2018, with an eventual slowing to1.8% by 2021.

Newly imposed tariffs by the Department of Commerce on Chinese imports became effective in late September. The $200 billion worth of tariffs will begin at a 10% rate and increase to 25% by year end should the two countries not come to an agreement.

The Department of Commerce is incentivizing U.S. companies to shift production of goods in China to the U.S. by allowing companies to redirect production prior to year end before tariffs are scheduled to reach 25% on Chinese made products.

In September, equity markets brushed aside ongoing concerns over escalating international trade tensions and instead focused on economic expansion in the United States. Analysts are seeing the benefits of the recent tax cuts and deregulation translate into expanding earnings for U.S. companies. Economists are also citing the tax cuts as a monumental factor in economic expansion.

October has been a different story as volatility has returned with a vengeance.  After reaching nearly 27,000 in the first week the Dow moved significantly lower reaching 25,000 by October 11th.  The tech heavy Nasdaq dropped approximately 10%, after reaching 8100 in the first few days of the month it fell to 7323 on October 11th.  We expect to see volatility continue throughout the month of October and investors should buckle up.

Earnings season began last week and so far earnings have been strong and companies are reporting positive outlooks for the next year.  Continued positive earnings reports could be the impetus to tame this volatile market in the short run.  Another concern is the continuously tightening labor market should ultimately send wages higher increasing inflation concerns and move the Fed to increase interest rates quicker and higher than expected.

One positive for stock investors is the fear gauge is showing extreme levels of fear which generally means a rebound could be on the horizon.
 
Economic Update

Economic Data Influences Stocks – U.S. Equity Update

Major equity indices all posted gains for the third quarter, with the S&P 500 advancing 7.2%, the Dow Jones Index gaining 9%, and the Nasdaq rising 7.1%. It was the single best quarter for stocks since 2013, buoyed by recent corporate tax cuts, improving earnings, and stable economic growth.

A notable shift occurred in the third quarter as equities surpassed real estate as the largest portion of household wealth. Real estate has out-valued equities as a percentage of household wealth for nearly 20 years.

Investments by companies in the S&P 500 Index increased to $341 billion in the first half of 2018, exceeding the same period last year by 19 percent. The increase in investments is on pace to be the most significant in nearly 25 years.

Several analysts are forecasting that the positive effects of the recent tax cuts will begin to fade as higher interest rates begin to inflate capital borrowing costs.

Growth estimates from the Organization for Economic Cooperation and Development (OECD) place U.S. economic growth at 2.9% for 2018, up from 2.2% in 2017, making it the fastest pace of growth since 2005. (Sources: S&P, Bloomberg, OECD, Dow Jones, NASDAQ)

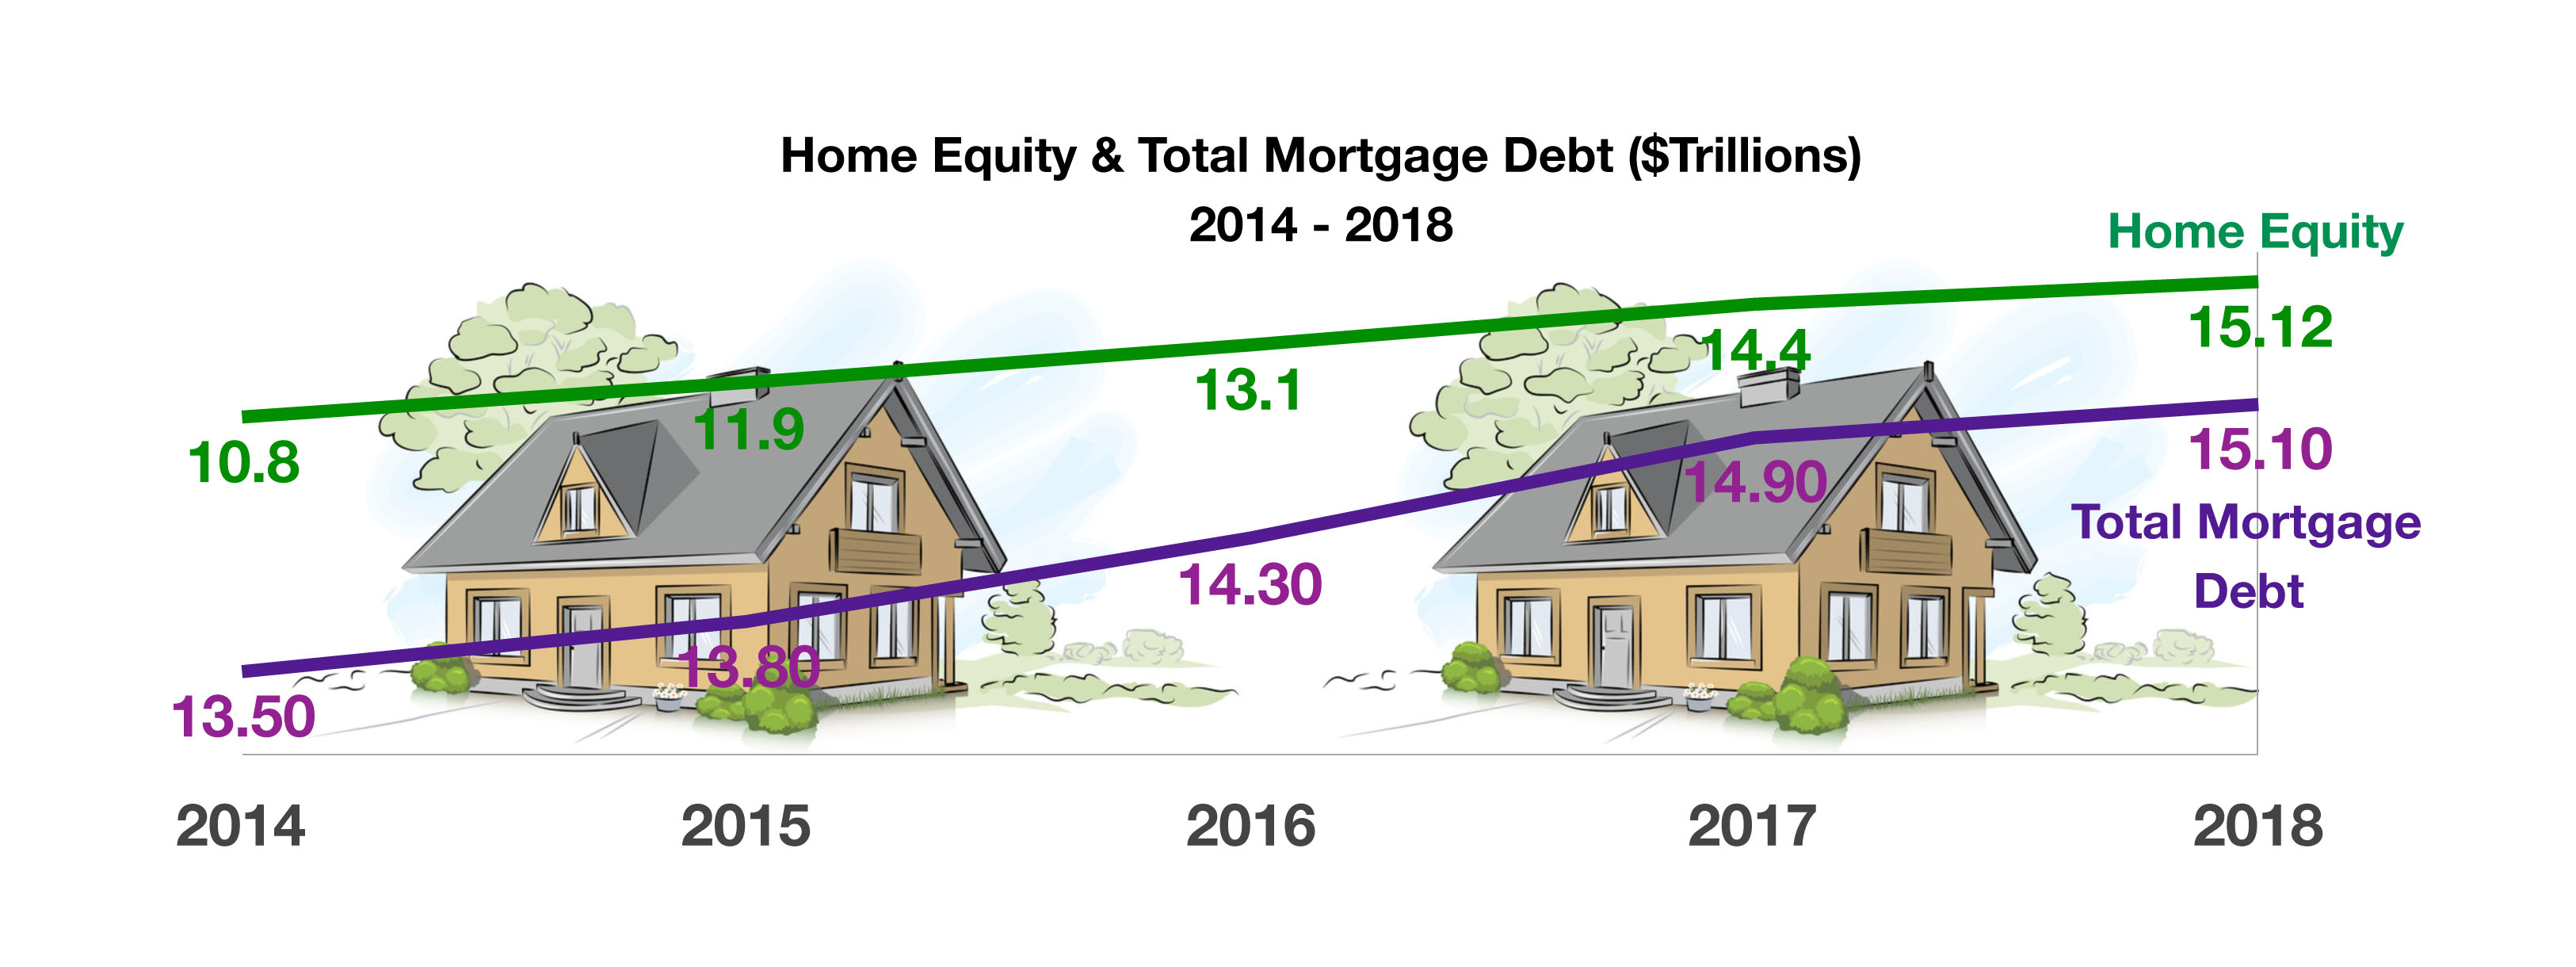
Household Equity Rising as Mortgage Debt Falling – Housing Market Overview

Following the debacle of the housing crisis from ten years ago, homeowners have become less ambitious and more conservative. Equity levels in homes across the country have respectfully increased past mortgage debt levels over the past few months. The latest data from the Fed shows that household equity is approaching $16 trillion, exceeding the level of mortgage debt standing at $15.1 trillion.

Contributing to the rise in home equity includes rising real estate values, a sustained low rate environment, limited housing supply, and an improving economic environment.

The amount of mortgage debt held by homeowners has not yet returned to the levels seen since before the housing crisis. Homeowners have become more conservative and less ambitious as they were during the crisis. Americans are also staying in their homes longer which helps build equity faster as opposed to moving and taking out a new loan laden with fees and interest payments. The Fed report notes that homeowners are taking much less equity out of their homes relative to the crisis period. The Fed data has also identified that more cash buys are prevailing throughout the market, helping to somewhat reduce the reliance on mortgage loans. (Sources: FRED; Federal Reserve Bank of St. Louis)

 
International Markets

International Markets Struggle – International Equities

European markets reacted to a possible impasse regarding negotiations surrounding the exit of Britain from the EU, also known as Brexit. Six months remain before the formal separation between the two occurs.

Developed and emerging market equity indices are having a tough time keeping up with U.S. equities, with most major international indices posting negative returns for the year. Emerging markets welcomed a weaker dollar as trade tensions wore on the U.S. currency.

Rising oil prices levied an additional burden on larger developing nations including Turkey, India, the Philippines, and South Africa as these countries import the majority of their oil. Higher oil prices tend to spur inflation for countries dependent on imports and laden with debt payments.

The big names in the Chinese markets have been crushed over the last several months with many names down 50% or more.  Alibaba (BABA) has fallen from $210 to $148, Baidu (BIDU) from over $280 to under $200 and YY has dropped from $140 to $60.  These are incredible moves in a very short period.  The Chinese economy has been a linchpin for the “synchronized global growth” myth that we were inundated with by the talking heads just a few short months ago.  It is amazing how quickly these talking head geniuses can shift the narrative – synchronized global growth has been replaced with the U.S. growth story as if somehow the debt burdened U.S. consumer can carry the global economy alone.  Only time will tell how this will play out but we get the feeling we are moving closer to the end of this decade long debt fueled increase in asset prices.  If we aren’t in the 9th inning we are certainly close to it and heading into extra-innings.  We have been proponents of the “melt-up” theory the question has the melt-up come and gone.  We are heading into what is traditionally the best time of year for stocks after what has been a volatile October.  We suspect the final leg of the melt-up could very well come in the last couple of months of 2018 and possibly run through (part) of the first quarter of 2019.  Often the largest gains are seen in this last inning of a bull market but investors need to take a hard look at how much pain they are willing to take to squeeze those last gains out of this bull market.

Sources: Eurostat, Reuters


Fixed Income Update

Rates On The Rise – Fixed Income Update

The Fed announced its third rate hike for the year, indicating another rate increase anticipated in December and three more to follow in 2019. The Fed’s key policy rate, the Federal Funds Rate, now stands at a range of 2% – 2.25%, the highest in ten years. Borrowing rates are gradually increasing in various consumer sectors including autos, appliances, and home mortgages. Many analysts believe that the current Fed Chairman, Jerome Powell, may have the ability to orchestrate a soft landing, meaning raising interest rates gradually without triggering a recession or economic slowdown.

Of the various fixed income sectors, U.S. corporate high-yield bonds had the least amount of price declines in September, outperforming both government and investment grade debt. Some analysts view this as a validation of improving financial conditions for U.S. companies and their ability to repay debt. (Sources: Treasury Dept., Federal Reserve, Bloomberg)

The benchmark 10-year treasury hit almost 3.25% in the first week of October and is currently sitting at 3.18%, up from 2.80% in late August. That may sound like a large move and considering the relative stability of interest rates for the last decade it certainly felt like a bloodbath to many younger investors who were in diapers when the 1994 bond massacre occurred. It was clearly enough to spook the stock market as the increase in rates brought about some extreme volatility in the stock market during the first two weeks of October.

The Fed is walking a tightrope between choking the economy by raising too much and risking inflation by not doing enough. Only time will tell if they can pull this trick off successfully but there are many factors that make todays economic different than past markets. As we have discussed ad nauseum in our previous newsletters, global debt has exploded and sits at over 3 times global GDP at $240 trillion. That is a lot of debt that needs to be continuously refinanced and as rates move higher this will become increasingly expensive and difficult for many borrowers – especially high yield corporate debt issuers. Even the worst products of our failing educational system should be able to figure that a 1% increase in rates equals an extra $2.4 trillion in financing cost on the $240 trillion in global debt. Obviously this is an over-simplification but is should illustrate the fact we are talking about a lot of money. In our last newsletter we introduced you to the new throw around term for debt, Quadrillion and at the rate we are accumulating debt of every type it won’t be long before we are hearing that term on a regular basis.

 
Fixed Income Update - Understanding Bond Risk

Understanding Bond Risk

We are currently in one of the most difficult economic environments for fixed income investors who seek safe, dependable income. Historically low interest rates and tight credit spreads have sent many investors chasing yield by increasing maturities and/or bonds with lower credit ratings to get the yield necessary to maintain their lifestyles. Many fixed income investors operate under the assumption that their bond holdings are safe and immune to large swings in price. While many things can affect the price of a bond, there are three concepts that every bond investor should understand which can have the most significant impact on the price volatility of a bond (or bond portfolio) – Duration, Spreads and Credit Spreads. Understanding these concepts is crucial for an investor to determine how much risk they are taking and how they should allocate their fixed income investments.

Duration is an approximate measure of a bond’s (or bond portfolio, mutual fund, etc.) price sensitivity to changes in interest rates and represents the percentage price move for a 1% shift in interest rates. The longer a bonds maturity date, the higher the duration and price risk. It is important to note that bond prices have an inverse relationship to interest rates, as rates fall the price of a bond will go up and as rates rise the price will fall. For instance, a 2-year bond has a duration of approximately 1.93 which means if rates rise 1% the price of the bond would fall by about 1.93%. By contrast, a 10-year has a duration of 8.5 meaning that the same 1% increase in interest rates would result in the price of the bond dropping by 8.5%.

Normally investors would be rewarded with higher yields for purchasing a bond or fund with a higher duration. If you are going to tie your money up for 8 additional years as in our example above, you would want to be rewarded for not just the time value but for the additional 6.5 in duration. However, today the yield curve (the difference between long-term and short-term treasury bonds) is historically flat with the 10-year treasury yielding 3.05% and the 2-year treasury yielding 2.81%. This means investors are being rewarded 0.24% for investing 8-years longer and run the risk of their bond dropping an additional 6.5% in price over the shorter bond. To put this in perspective, the average difference (spread) for the last ten years between 2 and 10-year treasuries is 1.69% vs. the current 0.24% today. Clearly by historical standards investors are not being rewarded for owning longer-term maturity bonds.

Credit risk is the risk of default by the issuer of a bond. The U.S. Treasury is considered the “risk-free” rate. As we discussed above the 10-year treasury bond is currently yielding 3.05% and is considered to have zero default risk and is rated AAA. Bond investors should understand the ratings system employed by the ratings agencies and most importantly that bonds rated below BBB are considered “junk” or high-yield (HY) and carry much higher risk of default than investment grade (IG). We will call this simply the spread, and as the chart below shows we are well below historical averages on both IG and HY bonds. IG bonds are currently earning a spread to the treasury of 115 basis points (bps) vs. the 18-year average of 196 and HY are trading at a spread of 324 vs. the average 0f 723.

 
Fixed Income Update - Understanding Bond Risk Continued

Understanding Bond Risk 

It is clear that investors are earning below average spreads but are investors being rewarded for taking more credit risk and purchasing lower rated bonds? The answer is not only no, but credit spreads are currently at one of the tightest levels in history.

Date IG HY Spread
Jan 00 122 487 365
Dec 00 202 907 705
Oct 02 246 1109 863
Feb 05 81 293 212
Dec 08 650 2182 1532
Apr 10 151 551 400
Jun 14 107 336 229
Dec 15 148 552 404
Feb 16 217 864 647
Apr 18 116 350 234
Sep 18 115 324 209
Average 196 723 527

In the table above, the spread column represents the difference in basis points between IG and HY bonds and is the additional risk premium investors are receiving for investing in HY bonds vs. IG. We are currently at 209bps which means you would earn an additional 2.09% purchasing junk bonds over IG. Notice that is the lowest spread to be found on the chart meaning investors are getting paid less today for taking risk than anytime in the last 18 years. It is also important to note how steady IG spreads have been compared to HY. If we remove the outlier of the credit crisis of 2008, IG spreads have remained in a relatively tight range with a low of 81bps and 246bps in October 2002 for a range of 165bps vs. HY which has had a range of 816 (1109 – 293). Now let’s put this into dollar terms. If an investor had a portfolio with a duration of 8.5 years and spreads moved simply back to their averages, the percentage loss of the IG portfolio would be approximately 6.7% vs. a loss of 28% for an investor in HY bonds. If you owned $1 million in bonds you would expect to see a paper loss of around $67,000 on the IG portfolio vs. $280,000 in the HY portfolio for earning the extra 2.09%. That is a lot of risk for a small reward, and that is just if we moved to the averages – If you examine the chart you will clearly see that spreads tend to overshoot their averages by a large margin once they begin to widen.

To summarize, fixed income investors who are taking excessive duration and credit risk are now receiving one of the lowest risk premiums in history. Investors are giving up very little by purchasing bonds with higher credit ratings and shorter maturities and will almost certainly save themselves a lot of pain down the road. By utilizing a short duration, high credit quality strategy investors put themselves in a position to profit when the next crisis or spread widening happens by locking in much higher spreads and yields. The lesson is don’t be shortsighted and fall into the yield chasing trap and set your portfolio up for massive success down the road.


Fixed Income Update - Tesla Bonds

We have used Tesla bonds as a bell weather issue to illustrate everything we believe is wrong with the credit markets since we began writing this newsletter last year.  In August of 2017 Tesla issued $1.8 billion in unsecured bonds with a 5.3% coupon and a rating of B3 (junk).  At the time we told readers that in our opinion this bond could very well have marked the height of investors greed and disregard for credit risk.  These bonds were issued at $100 with a yield of 5.3% and at the time of issue we wrote that in a normally functioning credit market these bonds should be trading at a yield of at least 10% to compensate investors for the risk they were taking.  Since that time the bonds have been downgraded to Caa1 by Moody’s and the price has dropped nearly every single month.  Today these bonds are trading at $85.93 for a yield of 8.016%.   Investors who purchased these bonds at new issue have seen the price drop 14% and in our opinion that still is not enough to reflect the risk being taken in these bonds.

The reason we have used this bond is to show investors the risk involved in purchasing high yield debt in a market where credit risk is not being priced appropriately.  We aren’t trying to pick on Tesla per say, most owners of their vehicles think they are the greatest thing since sliced bread – but this bond illustrates everything that has gone wrong in our credit markets – there are hundreds of companies that have issued junk rated debt with similarly poor terms for investors and this bond should warn investors about the risk they are taking in ALL non-investment grade debt.  Today it is Tesla, tomorrow it may be the issuer in your portfolio that is on the chopping block.

Retail bond investors have very few options available when it comes to evaluating credit risk and most rely on their brokers for recommendations about what to purchase.  It is important to understand that longer maturity bonds with lower credit ratings tend to be the bonds with the highest commissions for the broker creating an environment where a brokers interest may not be aligned with that of the client.  We urge investors to read and understand the Understanding Bond Risk sections of this newsletter to evaluate how much risk they may actually be taking in their portfolios.

 
Senior Bankruptcy - Retirement Planning

Senior Bankruptcy – Retirement Planning

The rate at which seniors file for bankruptcy has more than tripled since 1991 amid reductions in retirement and benefit payments. Of the people that are filing for bankruptcy each year, 12.2% are aged 65-74 versus 2.1% for the same age group in 1991.

Adding to financial burdens, the age at which full benefits are paid by Social Security has risen from 65 (those born in 1937 or earlier) to 67 (those born in 1960 or later).

Medical debt is the leading cause for bankruptcy filings nationwide, accounting for roughly 62% of all bankruptcies, as a growing number of medical procedures are not covered by insurance or Medicare.

Should bankruptcy become unquestionable, then assets need to be taken into careful consideration. Chapter 7 bankruptcy allows one to discharge most if not all debts and turn over nonexempt assets to the court. Determining whether or not Chapter 7 is an option is based on income. Chapter 13 bankruptcy allows one to keep assets, such as a home, and repay debt via a court approved payment schedule.

The most significant asset for many seniors happens to be their home, which in many circumstances, have large amounts of accumulated equity. Whether or not that equity is vulnerable to creditors in a bankruptcy filing is contingent on the state of residence. Some states have a homestead exemption provision, which excludes a home and home equity from creditor access. Homestead exemption rules vary from state to state and should be reviewed carefully before making any final decisions.

Since many seniors have large amounts of equity accumulated over the years, the biggest risk is losing accumulated equity or a home to creditors.

Social Security income can be a factor when filing for bankruptcy. With a Charter 7 bankruptcy, income received from Social Security is not counted and is protected from creditors. A Chapter 13 bankruptcy does include Social Security income when calculating what the arranged debt payments are.

Sources: American Bankruptcy Institute, National Council On Aging