Robert Krueger

Alexander Randolph Advisory Inc.

8200 Greensboro Drive, Suite 1125

McLean, VA 22102

703.734.1507

www.alexanderrandolph.com

October 2018
Market Update
(all values as of 08.30.2024)

Stock Indices:

Dow Jones 41,563
S&P 500 5,648
Nasdaq 17,713

Bond Sector Yields:

2 Yr Treasury 3.91%
10 Yr Treasury 3.91%
10 Yr Municipal 2.70%
High Yield 6.92%

YTD Market Returns:

Dow Jones 10.28%
S&P 500 18.42%
Nasdaq 18.00%
MSCI-EAFE 9.72%
MSCI-Europe 9.81%
MSCI-Pacific 9.34%
MSCI-Emg Mkt 7.44%
 
US Agg Bond 3.07%
US Corp Bond 3.49%
US Gov’t Bond 2.95%

Commodity Prices:

Gold 2,535
Silver 29.24
Oil (WTI) 73.65

Currencies:

Dollar / Euro 1.10
Dollar / Pound 1.31
Yen / Dollar 144.79
Canadian /Dollar 0.74

Macro Overview

The Fed raised rates for the third time this year, signaling it was on track for further hikes over the next few months. Rates moved higher across the fixed income spectrum, with the 10-year Treasury bond piercing the 3% mark, a level last reached in May of this year. The Federal Reserve also revised its estimates for GDP growth from 2.8% to 3.1% for 2018, with an eventual slowing to 1.8% by 2021.

Newly imposed tariffs by the Department of Commerce on Chinese imports became effective in late September. The $200 billion worth of tariffs will begin at a 10% rate and increase to 25% by year end should the two countries not come to an agreement.

The Department of Commerce is incentivizing U.S. companies to shift production of goods in China to the U.S. by allowing companies to redirect production prior to year end before tariffs are scheduled to reach 25% on Chinese made products.

Equity markets brushed aside ongoing concerns over escalating international trade tensions and instead focused on economic expansion in the United States. Analysts are seeing the benefits of the recent tax cuts and deregulation translate into expanding earnings for U.S. companies. Economists are also citing the tax cuts as a monumental factor in economic expansion.

Preliminary damage estimates following the destruction caused by hurricane Florence are expected to reach between $38 billion and $50 billion.The cost of Florence is not expected to be anywhere near the cost of hurricanes Harvey, Maria, or Irma, yet will impose additional strain on an all ready straddled insurance industry. Damage estimates are compiled by Moody’s which tracks the claims paying ability of insurance companies, especially during periods of significant payment of claims. The Federal Emergency Management Agency (FEMA) has thus far received over 8,000 claims for flood damage which allows for a $5,000 payment without an adjuster visit.

Oil prices headed higher in September topping levels not reached since 2014. Global energy markets reacted to limited production from OPEC, Saudi Arabia, Russia and the United States. The price for a barrel of Brent oil, which is priced internationally, reached $80 while the price of domestic oil priced as WTI surpassed $72. Adding to the supply strain were recently imposed sanctions on Iranian oil exports along with production constraints in the U.S.

Consumer sentiment reached its second highest level since 2004, as tracked by the University of Michigan’s Consumer Sentiment Index. Sentiment among consumers improved across all income categories with the expectation of higher wages and continued job growth. Modest levels of inflation also propelled confidence among consumers.

The White House Council of Economic Advisers reported that 623 companies this past month announced bonuses, pay increases, and better benefits as a result of the recent tax cuts. The council also estimates that over 6 million American workers have so far directly benefited from the tax law changes. (Sources: Fed, Dept. of Commerce, Moody’s, EIA, White House Council of Economic Advisers)

 
Equity Indices Post Gains for the Third Quarter

Economic Data Influences Stocks – U.S. Equity Update

Major equity indices all posted gains for the third quarter, with the S&P 500 advancing 7.2%, the Dow Jones Index gaining 9%, and the Nasdaq rising 7.1%. It was the single best quarter for stocks since 2013, buoyed by recent corporate tax cuts, improving earnings, and stable economic growth.

A notable shift occurred in the third quarter as equities surpassed real estate as the largest portion of household wealth. Real estate has out-valued equities as a percentage of household wealth for nearly 20 years.

Investments by companies in the S&P 500 Index increased to $341 billion in the first half of 2018, exceeding the same period last year by 19 percent. The increase in investments is on pace to be the most significant in nearly 25 years.

Several analysts are forecasting that the positive effects of the recent tax cuts will begin to fade as higher interest rates begin to inflate capital borrowing costs.

Growth estimates from the Organization for Economic Cooperation and Development (OECD) place U.S. economic growth at 2.9% for 2018, up from 2.2% in 2017, making it the fastest pace of growth since 2005. (Sources: S&P, Bloomberg, OECD, Dow Jones, NASDAQ)

International Markets Struggle – International Equities Update

European markets reacted to a possible impasse regarding negotiations surrounding the exit of Britain from the EU, also known as Brexit. Six months remain before the formal separation between the two occurs.

Developed and emerging market equity indices are having a tough time keeping up with U.S. equities, with most major international indices posting negative returns for the year. Emerging markets welcomed a weaker dollar as trade tensions wore on the U.S. currency.

Rising oil prices levied an additional burden on larger developing nations including Turkey, India, the Philippines, and South Africa as these countries import the majority of their oil. Higher oil prices tend to spur inflation for countries dependent on imports and laden with debt payments.

Sources: Eurostat, Reuters

Rates On The Rise – Fixed Income Update

The Fed announced its third rate hike for the year, indicating another rate increase anticipated in December and three more to follow in 2019. The Fed’s key policy rate, the Federal Funds Rate, now stands at a range of 2% – 2.25%, the highest in ten years. Borrowing rates are gradually increasing in various consumer sectors including autos, appliances, and home mortgages.

Many analysts believe that the current Fed Chairman, Jerome Powell, may have the ability to orchestrate a soft landing, meaning raising interest rates gradually without triggering a recession or economic slowdown.

Of the various fixed income sectors, U.S. corporate high-yield bonds had the least amount of price declines in September, outperforming both government and investment grade debt. Some analysts view this as a validation of improving financial conditions for U.S. companies and their ability to repay debt.

Sources: Treasury Dept., Federal Reserve, Bloomberg

 
Retirement Tax Planning

Tax on Social Security In Retirement – Retirement Tax Planning

A prudent and effective tax strategy during your employment years will mostly likely need to be modified in retirement. Once earned income ceases and income from retirement plans, investments, and Social Security commences, tax liabilities change.

The impact of the changes is primarily driven by the assets that we have little tax control over once we reach 70.5, which include IRAs, 401ks, and pensions. Reaching age 70.5 triggers RMDs (Required Minimum Distributions). Distributions from tax deferred retirement accounts such as an IRA or a 401k are generally taxed at the ordinary tax rate. Distributions from a Roth IRA or Roth 401k are income tax free as long as the account has been opened for at least five years and the account holder is 59.5.

Investment income such as stock dividends and bond interest are taxed differently, especially when they are held outside of a retirement account. Realizing gains on stocks that have been held for one year or more can be taxed at a more favorable rate than the ordinary rate. Interest on bonds and gains realized on short-term positions less than one year, are taxed at the ordinary rate.

Retirement also introduces us to Social Security which, contrary to popular belief, can be taxed. Eligibility for Social Security benefit payments begins at age 62, but can be postponed until age 70. A key determinant as to when to start receiving Social Security may be contingent on the amount of retirement assets in retirement accounts subject to RMDs. This is where tax strategies can vary dramatically.reflecting less confidence in their future income and/or overall financial position.

Retirees with excessive assets in retirement accounts subject to RMDs and with non-retirement investment income may want to confer with a tax professional to help determine when to take Social Security. Conversely, retirees with minimal assets in retirement accounts and investments may have little concern about paying taxes on their Social Security benefits.

The IRS determines if and how taxes are owed on Social Security by the “provisional income” measure. Provisional income includes gross income, tax-free interest, and 50% of Social Security benefits. If the provisional income is above a certain amount, then a portion of the Social Security income becomes taxable.

One way to potentially lower taxes in retirement is to start taking distributions from tax-deferred accounts before it’s required. Again, once you reach age 59½, you can withdraw funds from those accounts without paying the 10% early withdrawal penalty. The withdrawals are still taxed as ordinary income, but over time they reduce the size of tax deferred accounts, and thus the size of your RMDs. Another reason to access those funds before 70½ is that it could help you delay taking your social Security benefit, which increases in size the later you take it, up to age 70.

Another strategy for reducing the potential tax consequences of RMDs is converting a traditional IRA or 401(k) plan into a Roth IRA before the age of 70½. A Roth conversion may make sense when you’re certain you’ll be in a higher bracket when you eventually withdraw the money, which is often the case once RMDs and Social Security are factored in.

Sources: Social Security Admin., IRS, Tax Policy Center


Household Equity Approaching $16 Trillion

Household Equity Rising as Mortgage Debt Falling – Housing Market Overview

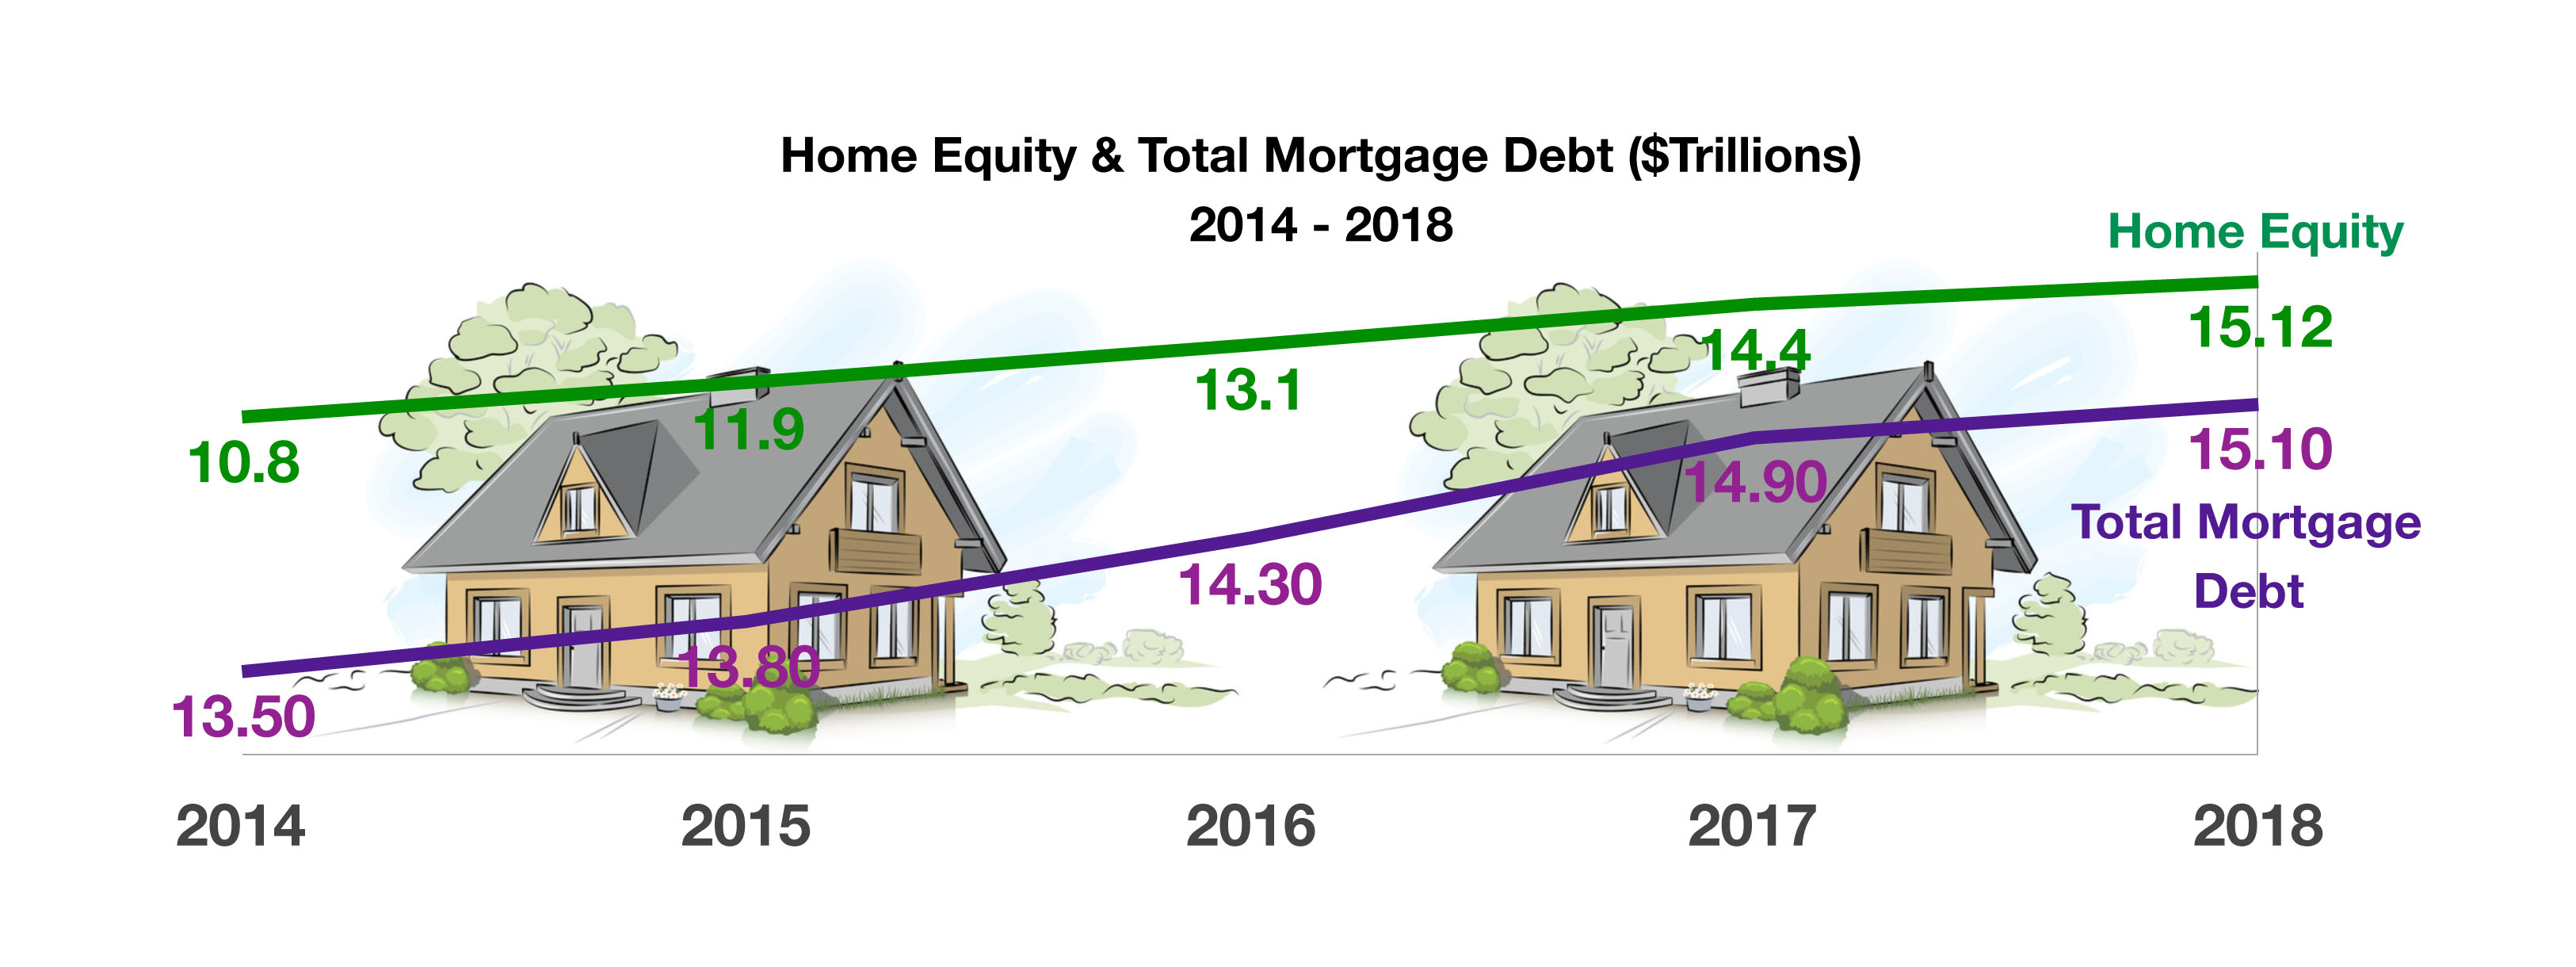
Following the debacle of the housing crisis from ten years ago, homeowners have become less ambitious and more conservative. Equity levels in homes across the country have respectfully increased past mortgage debt levels over the past few months. The latest data from the Fed shows that household equity is approaching $16 trillion, exceeding the level of mortgage debt standing at $15.1 trillion. Contributing to the rise in home equity includes rising real estate values, a sustained low rate environment, limited housing supply, and an improving economic environment.

The amount of mortgage debt held by homeowners has not yet returned to the levels seen since before the housing crisis. Homeowners have become more conservative and less ambitious as they were during the crisis. Americans are also staying in their homes longer which helps build equity faster as opposed to moving and taking out a new loan laden with fees and interest payments. The Fed report notes that homeowners are taking much less equity out of their homes relative to the crisis period. The Fed data has also identified that more cash buys are prevailing throughout the market, helping to somewhat reduce the reliance on mortgage loans. (Sources: FRED; Federal Reserve Bank of St. Louis)

Households Holding Less Debt – Consumer Behavior

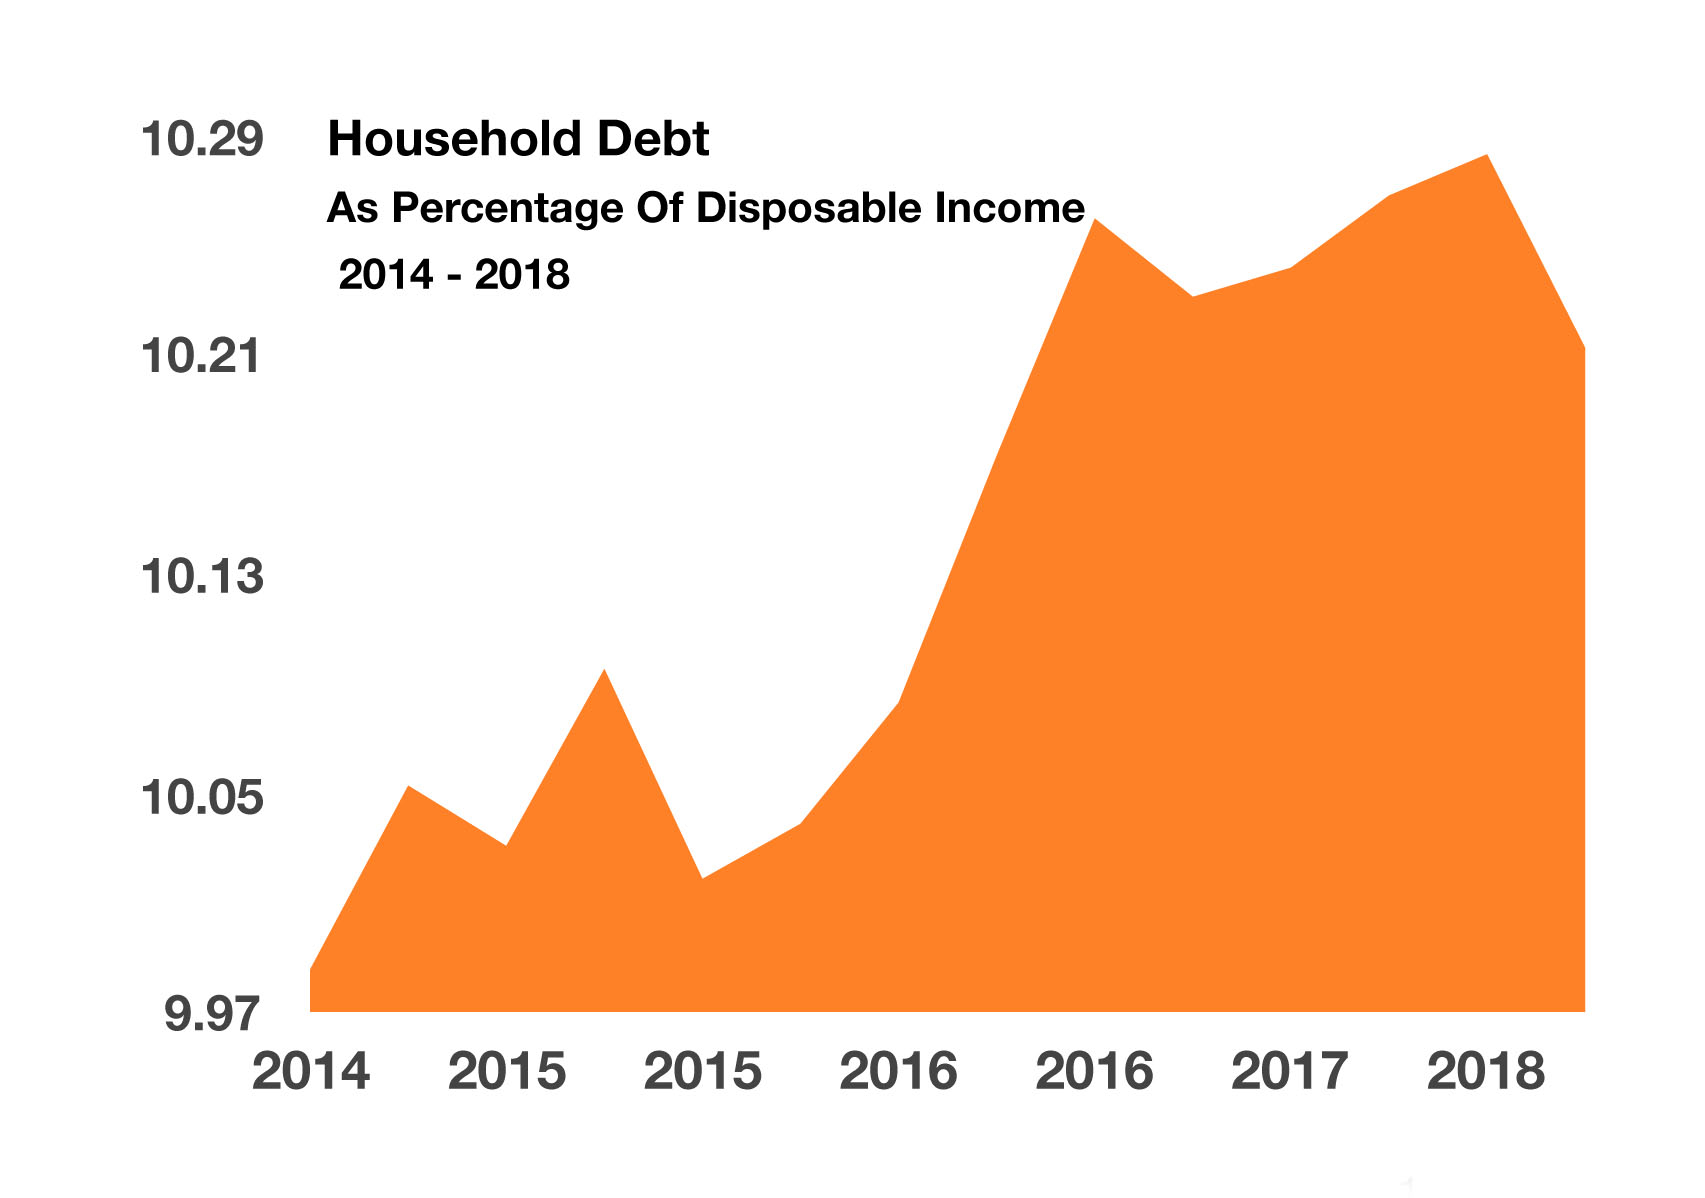
The New York Federal Reserve Bank compiles data on how much debt and what type of debt households have. The most recent release of debt data shows that household debt as a percentage of disposable income fell to the lowest levels since 2002. Debt payments include loans on autos, mortgages, education, and credit card balances.

The data shows that households are seeing less debt payments as a percentage of disposable income. Economists view the recent data from different perspectives. Optimistically consumers may be scaling back on debt payments and thus have more free cash to spend on goods, services, or savings. Pessimistically, consumers may be in the beginning stages of cutting back on borrowing, thus reflecting less confidence in their future income and/or overall financial position.

Either way, holding less debt in a rising interest rate environment is good for consumers since they are saving on the higher costs incurred from rising interest rates. The most recent data shows that households spend about 10.21% of their disposable income on debt payments, a slight decrease from levels over the past two years. (Source: New York Federal Reserve Bank)