3 Big Things, and the KCG Market Perspective
Market Update
(all values as of 06.28.2024)

Stock Indices:

Dow Jones 39,118
S&P 500 5,460
Nasdaq 17,732

Bond Sector Yields:

2 Yr Treasury 4.71%
10 Yr Treasury 4.36%
10 Yr Municipal 2.86%
High Yield 7.58%

YTD Market Returns:

Dow Jones 3.79%
S&P 500 14.48%
Nasdaq 18.13%
MSCI-EAFE 3.51%
MSCI-Europe 3.72%
MSCI-Pacific 3.05%
MSCI-Emg Mkt 6.11%
 
US Agg Bond -0.71%
US Corp Bond -0.49%
US Gov’t Bond -0.68%

Commodity Prices:

Gold 2,336
Silver 29.43
Oil (WTI) 81.46

Currencies:

Dollar / Euro 1.06
Dollar / Pound 1.26
Yen / Dollar 160.56
Canadian /Dollar 0.73

Profit:  “The idea that this expansion will continue has been predicated on manufacturing weakness remaining contained, but this dynamic is increasingly being called into question.”  That said, these numbers are seriously skewed by the GM strike and the Boeing 737 MAX accidents. “The data in aggregate suggest that U.S. economic growth is slowing, but not stalling. However, this is not necessarily true for the rest of the world. The risk of recession outside of the U.S. has been rising.” (Source: David Lebovitz, Tyler Voigt, J.P.Morgan Asset Management)

Liquidity:  Inflation Picks Up – Consumer Trends

A measure of inflation as gauged by the Consumer Price Index (CPI) accelerated by more than forecast over the past year. The CPI, which excludes food and energy, rose 2.4% from a year earlier as reported by the Department of Labor. These statistics are tracked by the Labor Department since they affect all U.S. workers throughout the country. The latest reading of 2.4% may be considered inflationary by some economists. 
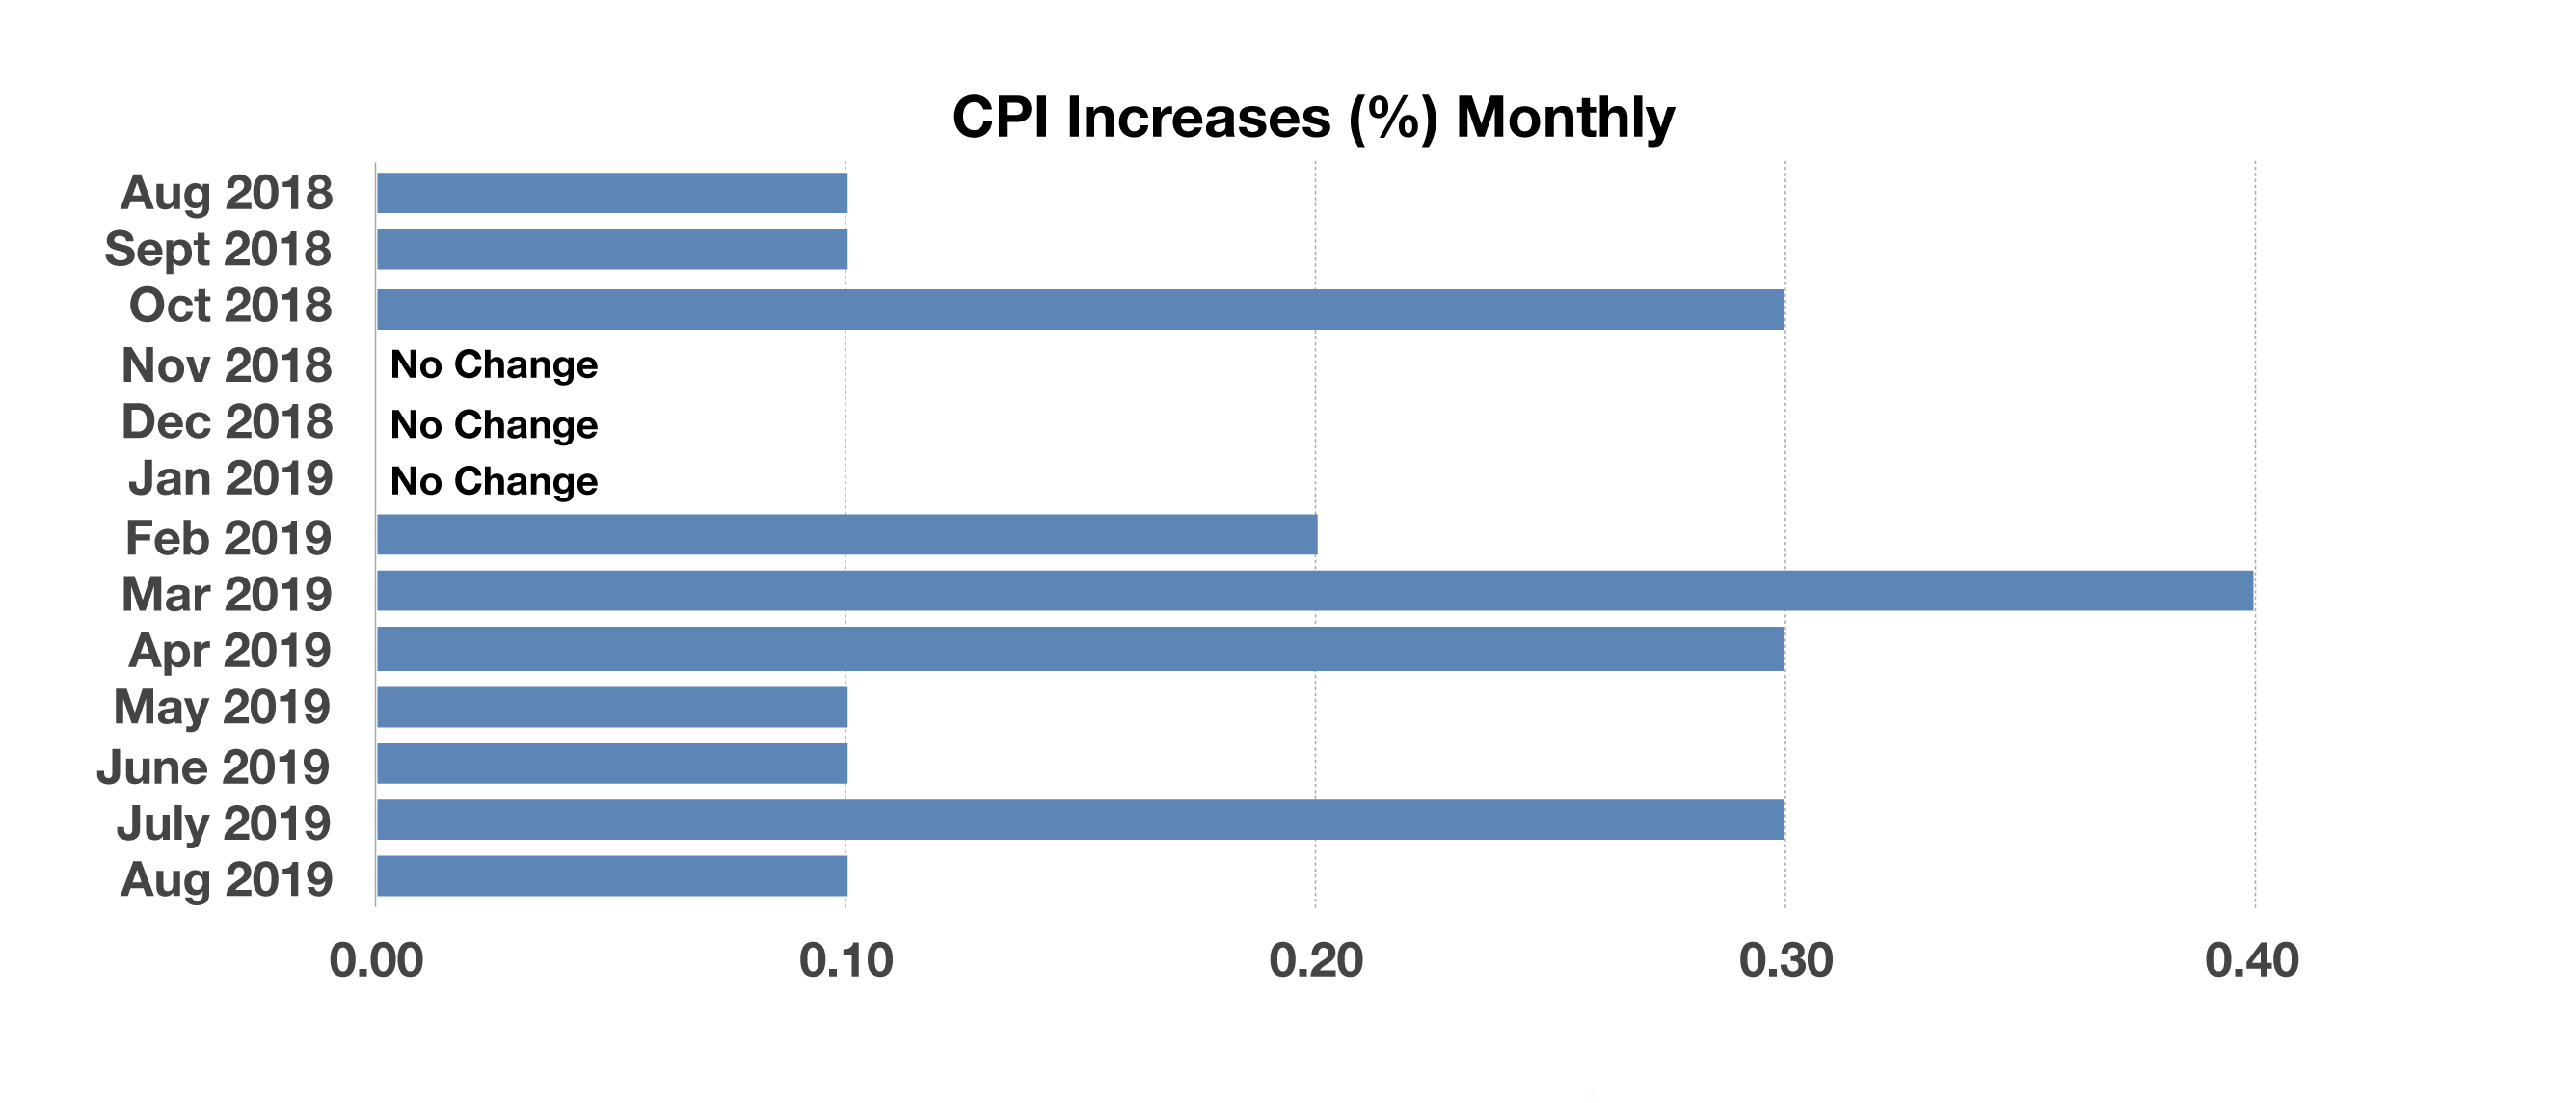
The BLS compiles and releases monthly inflation readings. CPI increases so far this year have been greater than the monthly changes in 2018. CPI data registered no change from November 2018 through January 2019, yet have seen consistent, measurable gains thereafter. (Source: BLS)

Sentiment: Survey data has been weak relative to expectations, while hard data has fared better (Bloomberg U.S. Economic Surprise Index)

Sentiment has been a key driver of recent volatility, but fundamentals have not disappointed to the same extent as the surveys. Uncertainty continues to drive market volatility and Gold values are highly correlated  to volatility.

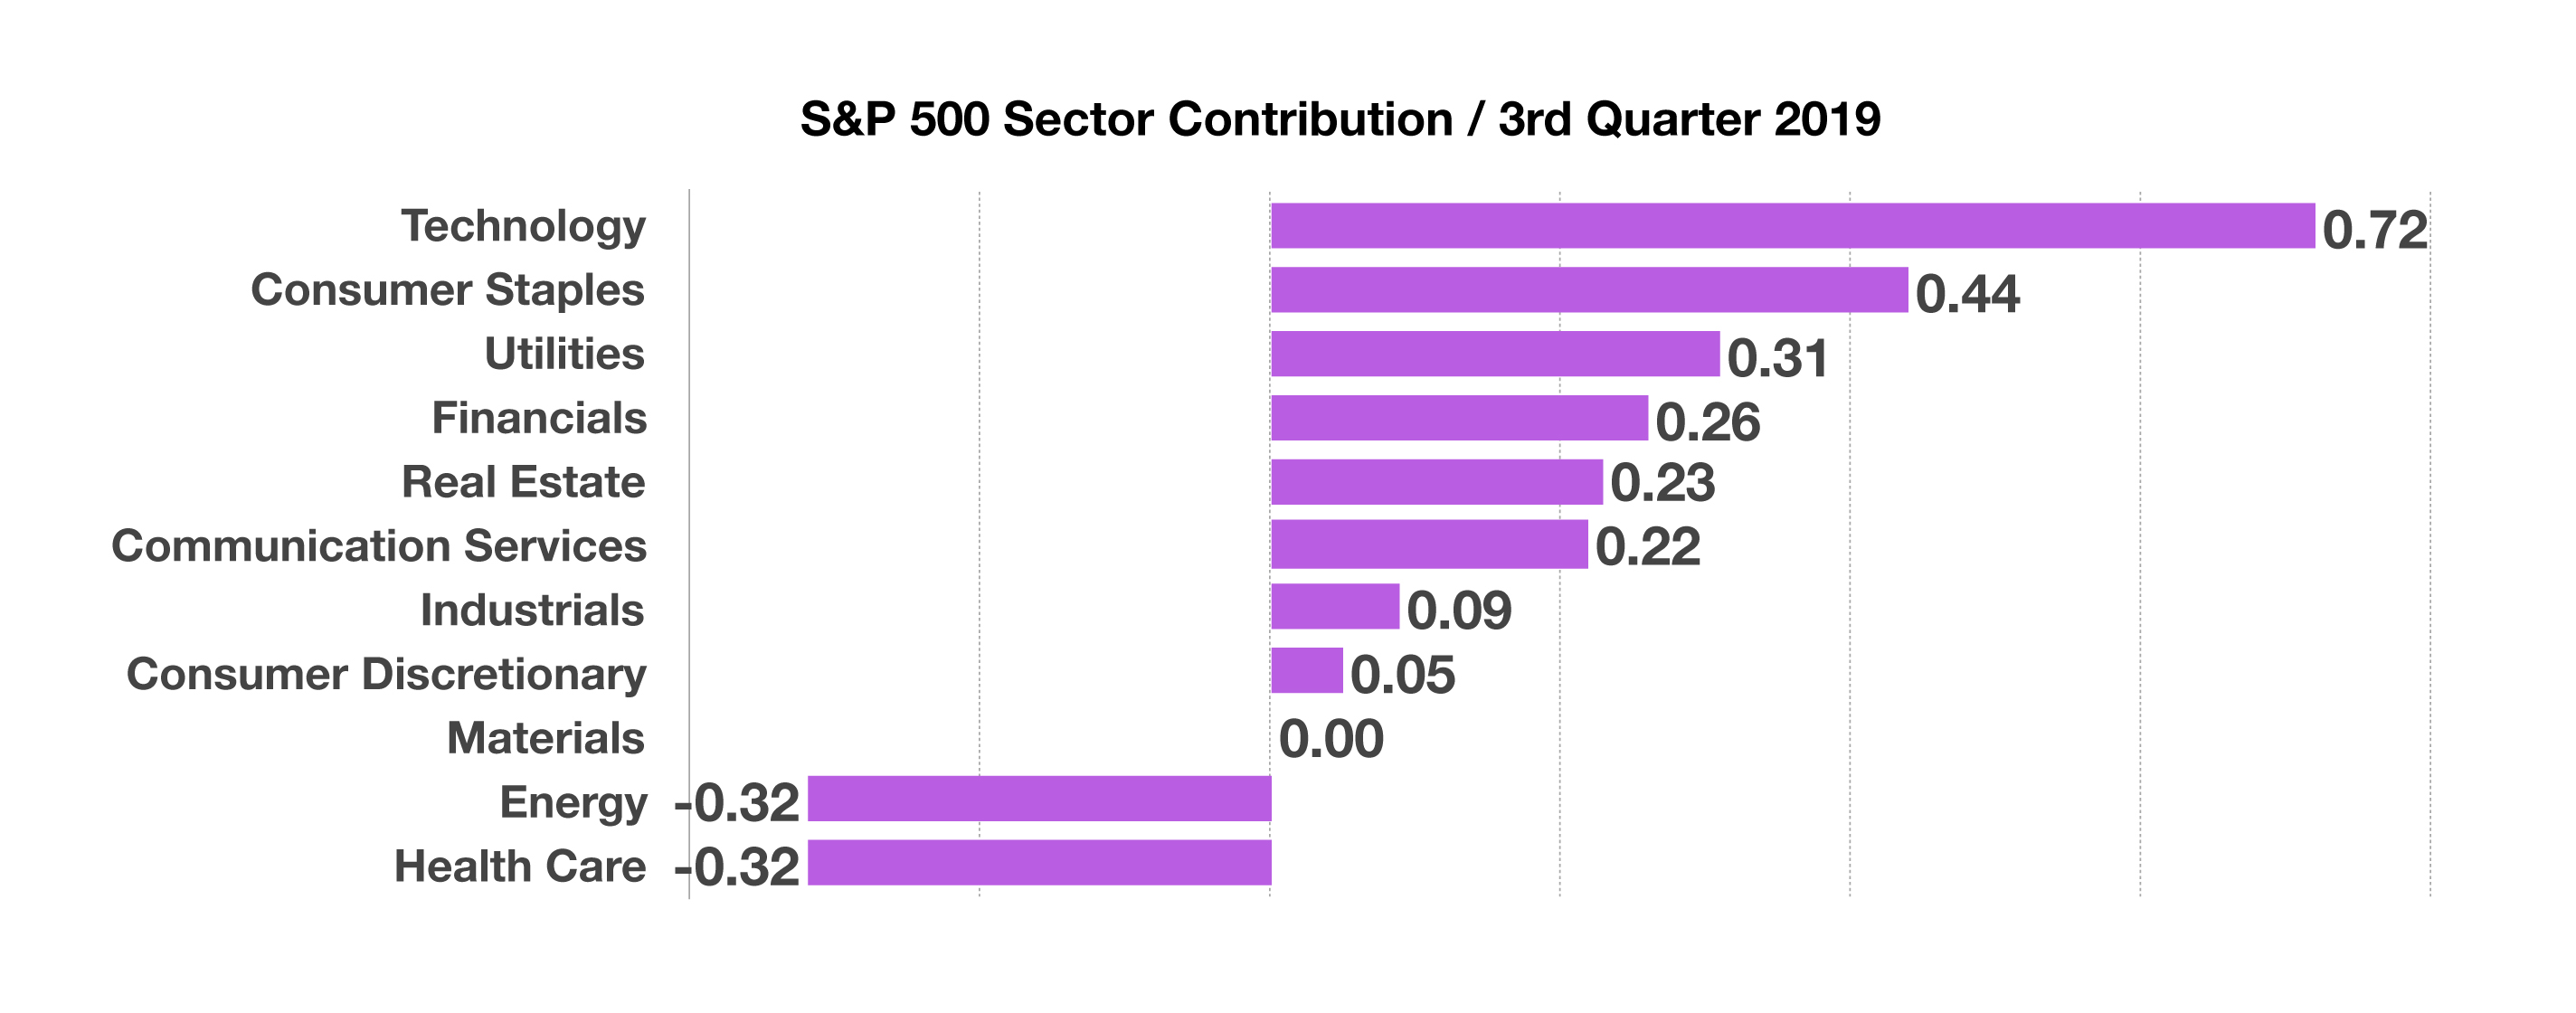
After multiple quarters of the same trends in momentum, September saw significant changes.  While Large-caps continued to out-perform Small and Mid-caps, Value overtook Growth for the first time in a long time.  Technology remains a favored sector while Healthcare has disappointed.  KCG Sector Models are over-weight Real Estate and Consumer Discretionary.  Interest rates swung from an upward trend to falling precipitously, making bond yields scarce and requiring a much more immediate response by KCG when an opportunity becomes available.

Source: Bloomberg, J.P. Morgan Asset Management. Hard data is a simple average of the housing and real estate, industrial, labor market, personal/household and retail & wholesale subindices. Data are as of 10/11/2019.
 
KCG Market Commentary October 2019

Macro Overview

A proposed tariff increase on goods imported from China was delayed from October 1st to October 15th. Tariffs on a number of Chinese goods are scheduled to increase to 30 percent from 25 percent effective on the 15th.

Year-to-date, U.S. equity markets have recaptured gains that were lost in the final quarter of 2018. The market’s resilience has allowed stock and bond prices to elevate higher even with the headwinds of trade tensions and recessionary concerns. Meager bond yields worldwide also fueled a gravitation towards stocks as investors sought more attractive yields in the form of dividends.

Domestic bond yields rose in September, climbing back from ultra low levels reached in August. The Fed’s easing rate trend is part of a larger global movement by other central banks to lower rates internationally.

Currency markets reacted to slightly higher U.S. rates in September, sending the U.S. dollar to its strongest levels in over two years. Various factors such as consistent consumer demand and a stable economic environment, relative to other global economies, helped drive the demand for the dollar.

A key inflation indicator, the Consumer Price Index (CPI), moved higher with its fastest annualized growth since 2008. The CPI index, which measures the price of various goods and services such as food, housing, and medical expenses, rose 2.4% over the past year. Medical insurance and healthcare related expenses saw some of the largest increases. (Sources: Commerce Depart., U.S. Treasury, BLS)

Equity Markets Advance In The 3rd Quarter – Domestic Equity Update

Despite ongoing trade tensions and concerns about a slowing economy, U.S. equities excelled in the third quarter, with technology, consumer staples, and utilities as the leading sectors for the S&P 500 Index. The energy and health care sectors were the under performers relative to the other 9 sectors. Equity markets are reacting more sensitively to economic indicators, such as unemployment, manufacturing, and Gross Domestic Production (GDP) data. Earnings growth for U.S. companies is starting to slow for certain sectors, as economic expansion decelerates. The corresponding chart illustrates how the various sectors contributed to the S&P 500 Index for the 3rd quarter. (Sources: BLS, Bloomberg, Reuters)


KCG Market Commentary October 2019

Rates Edge Up Slightly In September – Fixed Income Overview

Bond yields edged higher in September, rebounding from the lows reached in August. The 10- year Treasury bond yield rose from 1.47% at the beginning of September to 1.68% at the end of the month. The rise in yields affected loan rates as they had just reached lows in August not seen in years.

Additional rate cuts in Europe by the European Central Bank (ECB) pressured bond yields lower in Europe and Asia. Bond markets are eagerly awaiting indications of any further rate reduction in the U.S. by the Fed, perhaps prompted by economic data.

Low mortgage rates continue to fuel home sales nationally, with the rate on a conventional 30-year fixed mortgage at 3.64% at the end of September, down from 4.51% at the beginning of the year. (Sources: FreddieMac, ECB, U.S. Treasury)

Debt Limit Gets Put On Suspension – Fiscal Policy Overview 

Formally known as the statutory debt limit, the United States debt ceiling or debt limit is a legislative restriction on the amount of national debt that can be issued by the Treasury. The debt limit has been raised 79 times since its creation in 1917, with 17 of these increases occurring over the past 20 years.

The debt ceiling may also be suspended, meaning that spending can continue without a Congressional vote until a specific date. On July 21st, Congress voted to suspend the debt limit until July 21, 2021, thus allowing for an increase in borrowing to meet expected expenses over the next two years.

The United States has maintained legislative restriction on debt since 1917. To control the amount of total debt outstanding, Congress has placed restrictions on Federal debt issuance since the passing of the Second Liberty Bond Act of 1917, which eventually evolved into a general debt limit in 1939. The Second Liberty Bond Act of 1917 helped finance the United States’ entry into World War I, which allowed the Treasury to issue long-term Liberty Bonds.

Periodically, a political dispute arises over legislation to raise the debt ceiling. Until the debt ceiling is raised, the Treasury undertakes what is termed as “extraordinary measures”, which essentially buys more time for the ceiling to be raised.  (Source: Congressional Research Service)


KCG Wealth Management & Advisory Services

 The cost of borrowing money overnight using repurchase agreements

Due to the end of Quantitative Easing and the reduction of assets on the Fed’s balance sheet, bank deposits held at the Fed, called Reserves, has declined.  In mid September, for the first time since 2008, the Fed intervened to provide liquidity as the overnight lending rate soared.  The Fed injected cash in exchange for ultra-safe assets like t-bills and is expected to extend the program through 2020.

Liquidity is deteriorating.  Today global yield curves are extremely flat, the US inverted, and yield curves have historically been good indicators of recession within the following 12 months.  Yet consumer confidence and large cap earnings forcasts remain positive.  This, in spite of the need for Central Bank interventions.  We have never been here before.

Stretch IRA Rules May Change – Retirement Planning

Rules surrounding the distribution of funds from an Inherited IRA may change due to new rules being imposed. Those most affected by the new rules are retirees with generous IRA balances intending to leave funds to their children and grandchildren. Known also as Stretch IRAs, which have allowed IRA beneficiaries to stretch distributions and taxes over an extended period of time.

Both the House of Representatives and the Senate have drafted their own versions of the new rules. The House has named the legislation the Secure Act, which stands for the Setting Every Community Up For Retirement Enhancement Act. Both versions essentially accelerate the distribution and taxation of Inherited IRA funds going to non spouses.

A current rule that will remain the same is allowing a spouse to rollover their deceased spouse’s IRA to a spousal IRA and take Required Minimum Distributions (RMDs) based on their life expectancy. Inherited IRA rules will be modified by the newly imposed legislation, affecting non spousal beneficiaries such as children and grandchildren, the most common types of inherited IRA beneficiaries. For years, legislation has allowed inherited IRA beneficiaries to distribute funds over the course of decades based on the beneficiary’s life expectancy. Revised legislation will require inherited IRAs to be distributed entirely within 10 years. The distribution could be taken as intervals, at the end of the period, or whenever desired, as long as the entire account is disbursed within 10 years. Both versions do allow distribution exceptions for minor children, disabled beneficiaries, and beneficiaries not more than 10 years younger than the deceased IRA owner.

A challenge for inherited IRA beneficiaries is the tax implication of accelerated distributions over a much shorter time period. Some beneficiaries may also run the risk of falling into a higher tax bracket especially if they are working. The Senate version allows for a stretch on the first $400,000 of IRA assets with the exceeding balance distributed within 5 years. Both versions would apply to inherited IRAs with the original owner’s death occurring after December 31, 2019. (Sources: https://waysandmeans.house.gov)